

IPCS dump debugging
IPCS provides an interactive, online facility for diagnosing software failures. Using data sets and active system storage, IPCS analyzes information and produces reports that can be viewed at a Time Sharing Option Extensions (TSO/E) terminal, or can be printed.
SVC dumps, standalone dumps, and some traces are unformatted and need to be formatted before any analysis can begin. IPCS provides the tools to format dumps and traces in both an online and batch environment. IPCS provides you with commands that will let you interrogate specific components of the operating system and allows you to review storage locations associated with an individual task or control block. IPCS allows you to quickly review and isolate key information that will assist with your problem determination process
Some dumps, such as CEEDUMP, are in a readable format. To debug these dumps you have to browse them.
Dumps produced by an MVS system fall into two categories:
•Formatted dumps: SYSABEND and SYSUDUMP ABEND dumps and SNAP dumps. IPCS cannot be used with formatted dumps.
•Unformatted dumps: SVC dumps, SYSMDUMP ABEND dumps, and standalone dumps. IPCS formats and analyzes unformatted dumps.
When you submit unformatted dump data sets to IPCS, it simulates dynamic address translation (DAT) and other storage management functions to recreate the system environment at the time of the dump. IPCS reads the unformatted dump data and translates it into words. For example, IPCS can identify the following:
•Jobs with error return codes
•Resource contention in the system
•Control block overlays
IPCS also helps your own dump analysis. For example, you can:
•Format control blocks. IPCS inserts field names into the output and displays the data in columns by field.
•Browse unformatted dump storage. IPCS allows you to easily follow pointers to other locations in the dump. It also retains addresses of certain locations in the dump.
•Reduce the size of a standalone dump. You can reduce the size of a standalone dump as you transfer it from tape to a direct access storage device (DASD) for IPCS processing.
This chapter gives a brief overview of how to work with IPCS and get at least a useful search argument looking for known problems or asking for IBM support, as follows:
•Setting IPCS defaults
•ASIDs to be dumped
•The VERBX MTRACE command
•The IPCS SUMMARY command
•IPCS virtual storage commands
•Using IPCS to browse dumps
•Searching IBM problem databases
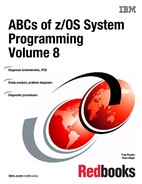
6.1 IPCS dump debugging
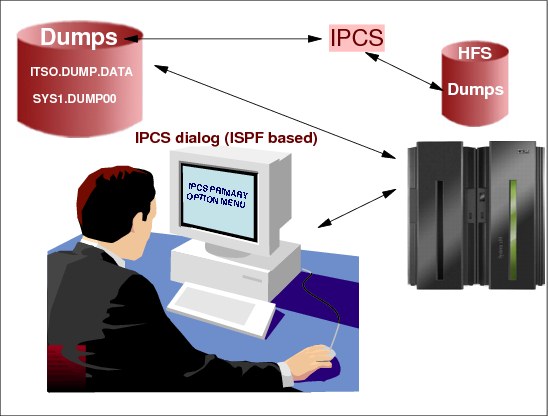
Figure 6-1 IPCS dump debugging
IPCS dump debugging
The interactive problem control system (IPCS) is a tool provided in the MVS system to aid in diagnosing software failures. IPCS provides formatting and analysis support for dumps and traces produced by MVS, other program products, and applications that run on MVS.
IPCS decides whether the source data set should be treated as a system dump by comparing the data set to the following criteria.
The dump data must be stored on a data set with sequential (PS), direct (DA), or unidentified (*) organization. With z/OS V1R2 and higher, IPCS also allows data stored on hierarchical file systems (HFS) to be accessed.
IPCS dialog
IPCS provides a full-screen dialog through the Interactive System Productivity Facility (ISPF). This mode, known as the IPCS dialog, runs on top of ISPF and the IPCS command processor. The IPCS dialog is an interactive dialog that you use at a terminal. The IPCS dialog organizes the problem analysis process into seven options:
•Set IPCS defaults.
•View formatted dump data.
•Generate and edit dump analysis reports.
•Submit dump analysis jobs for batch processing.
•Run IPCS subcommands, CLISTs, and REXX execs.
•Copy dump and trace data from one data set to another.
•Manage dump and trace data set sources.
IPCS Primary Option Menu
As part of customizing access to IPCS, IBM recommends that you or your installation provide an option for starting the IPCS dialog from an ISPF selection panel, usually the ISPF Primary Option Menu. To start the IPCS dialog from such an ISPF panel, select the option for IPCS.
After you select the IPCS option and press Enter, the system displays the IPCS Primary Option Menu. Figure 6-15 on page 157 shows the IPCS Primary Option Menu panel.
DUMPs on DASD and HFS
Dumps produced by an MVS system fall into two categories:
Formatted dumps SYSABEND and SYSUDUMP ABEND dumps and SNAP dumps. IPCS cannot be used with formatted dumps.
Unformatted dumps SVC dumps, SYSMDUMP ABEND dumps, and standalone dumps. IPCS formats and analyzes unformatted dumps.
When you submit unformatted dump data sets to IPCS, it simulates dynamic address translation (DAT) and other storage management functions to recreate the system environment at the time of the dump. IPCS reads the unformatted dump data and translates it into words. For example, IPCS can identify the following:
•Jobs with error return codes
•Resource contention in the system
•Control block overlays
•Loop
•Processor utilization
6.2 IPCS command processing
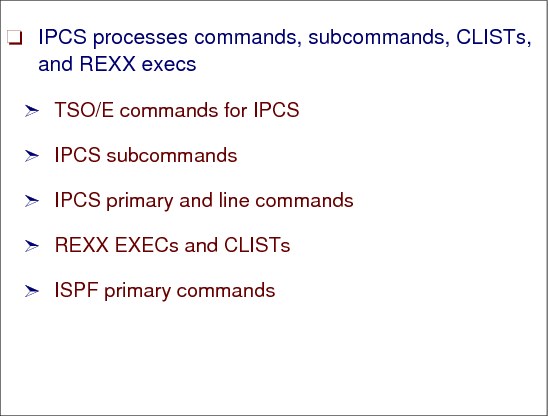
Figure 6-2 IPCS command processing
IPCS and commands
IPCS is a problem-state, key 8 program that runs in a TSO/E user's address space. IPCS operates in interactive and batch environments supported by TSO/E. The base of IPCS is a TSO/E command processor. The TSO/E command “IPCS” activates the IPCS command processor. All commands used to perform IPCS functions are “subcommands” of the IPCS command. You can use IPCS functions from any TSO/E line mode session.
TSO/E commands for IPCS
IPCS provides three commands to be invoked from the TSO/E READY prompt. Other TSO/E commands may have unique processing features when issued from an IPCS dialog session. The commands are:
•IPCS
•IPCSDDIR
•SYSDSCAN
IPCS subcommands
Once you enter the IPCS command to begin an IPCS session, the IPCS subcommands are your main tools for performing dump and trace analysis. These commands allow you to analyze, format, view, retrieve, and copy dump and trace data, and to maintain an IPCS session. You may use subcommands in any mode.
IPCS primary and line commands
An additional set of IPCS commands are available for use in the full-screen dialog. These commands control various panel functions. The primary commands are entered on the COMMAND or OPTION line of the IPCS dialog. The line commands are used in the prefix area of an IPCS dialog.
Use the IPCS primary command to invoke an IPCS subcommand, CLIST, or REXX exec from any of the panels of the IPCS dialog. The subcommand, CLIST, or REXX EXEC is entered exactly as though it was being invoked under IPCS in line mode. If the subcommand, CLIST, or REXX EXEC sends a report to the terminal, you view the report using the dump display reporter panel. The syntax is as follows:
IPCS { subcommand }
IP { clist }
{ rexx-exec }
REXX EXECs and CLISTs
You can invoke REXX EXECs and CLISTs from an IPCS session. These procedures can enter subcommands or use other REXX and CLIST functions to analyze dumps and traces. IPCS provides functions to store data in REXX or CLIST variables and to print data to the IPCS dialog or print data set.
Delete IPCS dump directory before initializing the SA dump
To get a better initialization SA dump performance you should delete your IPCS dump directory, which will automatically be allocated during IPCS access. If the original dump directory is used, it may take hours, depending on the dump size, to have the dump available for debug.
|
DELETE PHILGER.DDIR *VSAM*
PHILGER.DDIR.D SBOXFJ
PHILGER.DDIR.I SBOXFJ
|
Figure 6-3 Delete IPCS dump directory
ISPF primary commands
For interactive use, the IPCS dialog uses ISPF dialog support to run as an interactive, full-screen application. This application uses the IPCS command processor. z/OS IPCS exploits data spaces, if permitted, to free virtual storage to allow large, complex analysis routines to function.
6.3 IPCS dump debug example
Figure 6-4 Dump debug
Dump debug example
Digging in a dump like one from UNIX System Services is like walking through New York without a map. And if you have a map you might get lost anyway. This chapter provides steps for how to start looking at a dump. It describes IPCS commands used to debug a UNIX. A dump was taken because we got an ICH408I message. What does this dump provide?
|
ICH408I USER(HILGER ) GROUP(SYS1 ) NAME(PETER HILGER ) 720
/etc/peter CL(DIRACC ) FID(01E2C2D6E7F1C2004B08000000000003)
INSUFFICIENT AUTHORITY TO OPEN
ACCESS INTENT(-W-) ACCESS ALLOWED(OTHER R-X)
EFFECTIVE UID(0000001210) EFFECTIVE GID(0000000002)
|
Figure 6-5 ICH408I Permission denied message
IPCS dump commands
After the dump has been initialized by IPCS, check whether the dump is a complete one by issuing the following IPCS command:
Command ===> ip l e0. block(0) l(16)
LIST E0. BLOCK(0) LENGTH(X'10') AREA
E0. LENGTH(X'10')==>All bytes contain X'00'
Get the dump status information
Command ===> ip st
Dump Title: SLIP DUMP ID=PHIL
CPU Model 2094 Version 00 Serial no. 06991E Address 003
Date: 11/14/2011 Time: 13:34:58.554366 Local
Original dump dataset: DUMP.D111114.H18.SC64.HILGER.S00025
SYSTEM RELATED DATA
CVT SNAME (154) SC64
List the dumped address spaces
Command ===> ip cbf rtct;f astb
ASTB
SDAS SDF4 SDF5
---- ---- ----
001 005B 80 00
002 0010 80 00
Get the jobnames for address space 10 and 5B
Command ===> IP SELECT ASID(X'10',X'5B')
ASID JOBNAME ASCBADDR SELECTION CRITERIA
---- -------- -------- ------------------
0010 OMVS 00F55280 ASID
005B HILGER 00F8C280 ASID
Get PSW and registers at time dump was taken
Command ===> ip st regs
CPU STATUS:
PSW=07043000 80000000 00000000 01A5DFCE
(Running in PRIMARY, key 0, AMODE 31, DAT ON)
Disabled for PER
ASID(X'0010') 01A5DFCE. IEANUC01.IEAVTSMG+04EE IN READ ONLY NUCLEUS
ASCB91 at F8C280, JOB(HILGER), for the home ASID
ASXB91 at 7FDB60 and TCB91K at 7AE560 for the home ASID
HOME ASID: 005B PRIMARY ASID: 0010 SECONDARY ASID: 005B
General purpose register values
Left halves of all registers contain zeros
0-3 02B51000 0406F000 02B4FA18 02B4FA20
4-7 00000007 00000006 00000C40 02B4F480
8-11 00000000 00FB1390 00000008 02B4FA18
12-15 01A5E458 02B4FAA0 81A5DC12 00000008
The IP ST command shows that the problem occurred in TCB 7AE560. You need to look now for this TCB in the IP SUMM FO ASID(X'5B') output.
The IPCS SUMMARY FORMAT command
To format the control block fields, use the SUMMARY FORMAT subcommand. Format specifies a report containing the major control blocks associated with the specified address space as follows:
•ASCB Address Space Control Block
•TCB Task Control Block
•STCB Secondary TCB
•RB Request Block
•XSB eXtended requeSt Block
•SRB Service Request Block
•SSRB Suspended SRB
•WEB Work Element Block (IHAWEB)
•IHSA Interrupt Handler Save Area
•LSE Linkage Stack Entry
|
Command ===> IP SUMM FO ASID(X'5B')
The end of the output shows the TCB summary
JOB HILGER ASID 005B ASCB 00F8C280 FWDP 00F9A700 BWDP 00F8C700 PAGE
00000006
TCB AT CMP NTC OTC LTC TCB BACK PAGE
007FE040 00000000 00000000 00000000 007FF890 007FD0C0 00000000 00000056
007FD0C0 00000000 00000000 007FE040 00000000 007FF890 007FE040 00000061
007FF890 00000000 007FD0C0 007FE040 007FF070 007FF070 007FD0C0 00000066
007FF070 00000000 00000000 007FF890 007DE930 007DE930 007FF890 00000075
007DE930 00000000 00000000 007FF070 007DE6A0 007DE6A0 007FF070 00000091
007DE6A0 00000000 00000000 007DE930 007DE508 007DE508 007DE930 00000099
007DE508 00000000 00000000 007DE6A0 007AE060 007DE1E0 007DE6A0 00000107
007DE1E0 00000000 00000000 007DE508 00000000 007AE060 007DE508 00000123
007AE060 00000000 007DE1E0 007DE508 007AE560 007AE988 007DE1E0 00000134
007AE988 00000000 00000000 007AE060 00000000 007AE560 007AE060 00000144
007AE560 00000000 007AE988 007AE060 007AE2D0 007AE2D0 007AE988 00000154
007AE2D0 00000000 00000000 007AE560 00000000 00000000 007AE560 00000167
|
Figure 6-6 The SUMMARY FORMAT subcommand
Due to the fact that there is no entry in the CMP column, there is no unexpected error indication. You then need to have a look at the TCB pointed to by the IP ST output.
|
TCB: 007AE560
+0000 RBP...... 007AE768 PIE...... 00000000 DEB...... 00000000
+000C TIO...... 007CBFD0 CMP...... 00000000 TRN...... 40000000
+0018 MSS...... 7F662358 PKF...... 80 FLGS..... 00000000 01
+0022 LMP...... FF DSP...... FE LLS...... 007AE738
+0028 JLB...... 0000C4F0 JPQ...... 00000000
|
Figure 6-7 TCB partial output shown
If a user or program needs USS services, a syscall depending on the request is issued. In our case an open was requested like the one in the first linkage stack belonging to our TCB. Linkage stacks are save areas that are provided by the hardware.
|
LINKAGE STACK ENTRY 01 FROM TCB. LSED: 7F65F518
LSE: 7F65F3F8
GENERAL PURPOSE REGISTER VALUES
00-01.... 00000000 00000026 00000000 24D9D7B4
02-03.... 00000000 01380548 00000000 24B201F6
04-05.... 00000000 00000000 00000000 24D9D6B8
06-07.... 00000000 01A93660 00000000 00FDCA48
08-09.... 00000000 000000D5 00000000 24C222C4
10-11.... 00000000 24D9A6B8 00000000 24B15260
12-13.... 00000000 24D9A008 00000000 24D9A6B8
14-15.... 00000000 A4B202CC 00000000 00001300
ACCESS REGISTER VALUES
00-03.... 00000000 00000000 00000000 00000000
04-07.... 00000000 00000000 00000000 00000000
08-11.... 00000000 00000000 00000000 00000000
12-15.... 00000000 00000000 00000000 00000000
PKM...... 00C0 SASN..... 005B SINS..... 00000045
EAX...... 0000 PASN..... 005B PINS..... 00000045
PSW...... 07851000 80000000 PSWE..... 00000000 01380EAC
TARG..... 00100001 00001314 MSTA..... 27C090C8 27C0A508
TYPE..... 0D
|
Figure 6-8 First linkage stack in the TCB structure
Register 0 shows the syscall 00000026 >>> open request. Register 1 shows the parameter list. The layout can be found in z/OS UNIX System Services Programming: Assembler Callable Services Reference, SA22-7803.
Browse the storage for asid(x'5B') and locate the area pointed to by Register 1.
|
Storage area browsed shows:
24D9D7B4 24D9D7B0 24D8F040 24D9D7AC
24D9D7C0 24D9D7A8 24D9A760 24D9A764 A4D9A768
|
Figure 6-9 Parameter list for syscall request open
In Figure 6-9, the first address in our storage area should show a length indication, as follows:
24D9D7B0 0000000A
A parameter list should be read as shown in z/OS UNIX System Services Programming: Assembler Callable Services Reference, SA22-7803.
|
CALL BPX1OPN,(Pathname_length,
Pathname,
Options,
Mode,
Return_value,
Return_code,
Reason_code)
|
Figure 6-10 Parameter list layout for open request
In Figure 6-10 on page 152, the second address is the pathname, as follows:
24D8F040 6185A383 619785A3 85990000 00000000 ! /etc/peter...... !
This shows that somebody tried to access, allocate or delete this /peter file or directory.
A USS Ctrace will provide detailed information about the request, as follows:
Command ===> ip ctrace comp(sysomvs) full asid(x'5b')
The last entry, 24D9D7AC, is shown in Figure 6-11.
|
SC64 FILE 05610109 18:34:57.741236 CALL TO VN_CREATE
ASID..005B USERID....HILGER STACK§....27C090C8
TCB...007AE560 EUID......000004BA PID.......0204003E
+0000 E5E5E540 00969C30 004A1CA8 00000003 ! VVV .o...Ä.y.... !
+0010 27C09E40 27C09C10 27C09B90 00000000 ! .ä. .ä...ä...... !
+0020 00000005 9785A385 99404040 40404040 ! ....peter !
+0030 40404040 40404040 40404040 40404040 ! !
+0040 40404040 C1E3E3D9 000000E0 03000000 ! ATTR...Ö.... !
+0050 00000000 00000000 00000000 00000000 ! ................ !
+0060 00000000 00000000 00000000 00000000 ! ................ !
+0070 00000000 00000000 00000000 00000000 ! ................ !
+0080 00000000 B4D5C400 0000A008 00000000 ! .....ND......... !
|
Figure 6-11 Address 24D9D7AC display
In this example, user HILGER tried to create the file peter and got permission denied. The syslog or IP VERBX MTRACE command should show the ICH408I message. The syslog and MTRACE may also show the message. There might be the possibility that the ICH408I messages are suppressed by the syscall requestor. WebSphere is doing this for some requests. Have a look at the MTRACE in the dump, by issuing the following command:
Command ===> ip verbx mtrace
Message ICH408i can be seen, as shown in Figure 6-12.
|
ICH408I USER(HILGER ) GROUP(SYS1 ) NAME(PETER HILGER
/etc/peter CL(DIRACC ) FID(01E2C2D6E
INSUFFICIENT AUTHORITY TO OPEN
ACCESS INTENT(-W-) ACCESS ALLOWED(OTHER R-X)
EFFECTIVE UID(0000001210) EFFECTIVE GID(0000000002)
IEA992I SLIP TRAP ID=PHIL MATCHED. JOBNAME=HILGER ,
|
Figure 6-12 ICH408I IBM RACF® message
To get information about active USS processes at the time the dump was taken, use (see Figure 6-13 on page 154):
Command ===> ip omvsdata
|
Process Userid Asid Parent Process Session Status
ID PID Group ID ID
---------------------------------------------------------------------------
00000001 OMVSKERN 0058 00000000 00000001 00000001 -
00040002 STC 001A 00000001 00040002 00040002 -
05040039 PHILGER 0088 00000001 05040039 05040039 -
0304003A PHILGER 0088 05040039 05040039 05040039 -
0204003E HILGER 005B 00000001 0204003E 0204003E -
0004003F STC 0061 00000001 0004003F 0004003F -
01040040 HILGER 005B 0204003E 0204003E 0204003E -
|
Figure 6-13 USS process list
To get detailed process information, use:
Command ===> ip omvsdata detail
6.4 IPCS support of large data sets
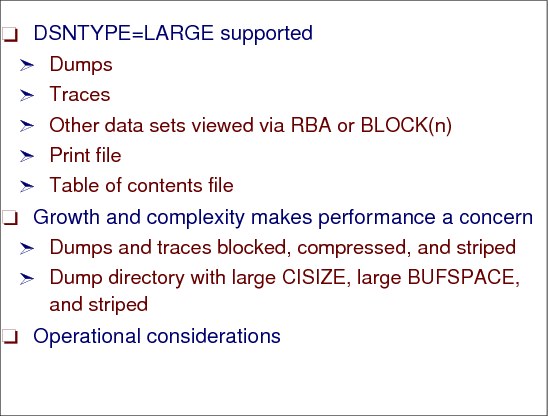
Figure 6-14 IPCS and large data sets
IPCS large data sets
Files directly supported by IPCS may have the DSNTYPE=LARGE attribute in z/OS V1R7. If you are planning to run larger LPARs, it makes sense to set aside some time to plan for larger dumps and traces.
DSNTYPE=LARGE
The DSNTYPE=LARGE is supported in:
• Dumps
• Traces
• Other data sets viewed via RBA or BLOCK(n)
• Print file
• Table of contents file
Large dumps and traces
Large dumps and traces make performance more of a concern. So consider the following:
•Large BLKSIZEs, compression, and striping are all supported. Each can make a significant difference.
•Good allocation for dump directories can make a significant difference in IPCS efficiency. Compression is not recommended because directories are updated very rapidly during IPCS analysis, but focusing on primary space, secondary space, CISIZE, BUFSPACE, and striping can really help. If you anticipate the need to work with really large media, the VSAM extended addressing option should be used.
•Ensure large CISIZE for the DATA portion. BLSCDDIR CLIST is updated to help. A DSNTYPE=LARGE data set can only be used if the dump is both written and processed on a V1R7 system or a later release. A VSAM linear data set with either an extended format or conventional format with a control interval size (CISIZE) of 32K can be substituted. Neither extended sequential nor VSAM data sets, other than linear data sets with the required CISIZE, should be used.
•In addition, consider the following options:
– Ensure large (but not excessive) BUFSPACE for the directory.
– Consider striping.
– Avoid compression because of intensive updating during IPCS analysis.
Operational considerations
SADMP runs very much the same way as prior releases. From the perspective of the operator who runs SADMP, DSNTYPE=LARGE data sets are treated just the same as the ones used previously. The operational changes are as follows:
•SADMP tries harder to ensure that data needed to process every SADMP is written to it early. Several page data set pages may be brought in concurrently to achieve this acceleration if independent paths are available.
•An alteration of some messages tells the operator about progress through the three phases, and, if the operator is sensitive to such things, a modest acceleration of capturing data from page data sets may be sensed. Some messages are changed to reflect the following logic and inform the operator about the phases, as follows:
– Primary phase dumps vital MVS data (PSAs, CVT, and so forth).
– Second phase dumps ASIDs 1-4.
– Third phase dumps the rest.
If installation priorities mandate cutting the dumping process short, this makes it more likely that the truncated dump will be useful. We do not recommend truncation, but we recognize that your specific business priorities may require it.
6.5 Setting the IPCS defaults
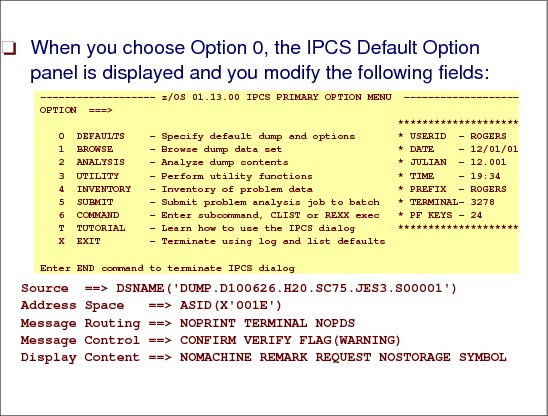
Figure 6-15 Selecting the IPCS default options
Setting the IPCS defaults
Selecting Option 0 from the Primary Option Menu enables you to identify the data set that contains the dump you will be analyzing. Figure 6-16 shows the part of the IPCS default option menu that you change to gain access to the dump you want to process.
You may change any of the defaults listed in Figure 6-16. The defaults shown before any changes are LOCAL. Change scope to GLOBAL to display global defaults. If you change to BOTH, dump data set will be kept until you initialize a new dump.
Scope ==> LOCAL (LOCAL, GLOBAL, or BOTH)
If you change the Source default, IPCS will display the current default Address Space for the new source and will ignore any data entered in the Address Space field.
Creating the defaults
The initial display will show Source ==> NODSNAME and no value in Address Space. When you enter your dump DSNAME (in single quotes), you must manually change the NODSNAME for DSNAME. Pressing Enter will then update the Address Space field with the primary ASID for the dump.
|
BLSPSETD ---------------- IPCS Default Values --------------------------------
Command ===>
You may change any of the defaults listed below. The defaults shown before
any changes are LOCAL. Change scope to GLOBAL to display global defaults.
Scope ==> LOCAL (LOCAL, GLOBAL, or BOTH)
If you change the Source default, IPCS will display the current default
Address Space for the new source and will ignore any data entered in
the Address Space field.
Source ==> DSNAME('DUMP.D100626.H20.SC75.JES3.S00001')
Address Space ==> ASID(X'001E')
Message Routing ==> NOPRINT TERMINAL NOPDS
Message Control ==> CONFIRM VERIFY FLAG(WARNING)
Display Content ==> NOMACHINE REMARK REQUEST NOSTORAGE SYMBOL
Press ENTER to update defaults.
Use the END command to exit without an update.
|
Figure 6-16 IPCS Default Option Panel
If the dump was captured via the DUMP COMM command, the ASID will always equal x'0001', the Master Address space, but the dump data set will also include any address spaces that you requested to be dumped.
You will be able to change the Address Space ASID when you know what ASID dump date you need to review.
After setting the IPCS defaults, return to the IPCS Primary Option menu (Figure 6-15 on page 157) and select Option 6, Command. The first IPCS command you enter will start the initialization process for the dump you have specified.
Figure 6-17 shows the messages that are issued during the initialization process.
|
TIME-03:04:25 PM. CPU-00:00:04 SERVICE-328514 SESSION-08:03:50 NOVEMBER 14,2011
Initialization in progress for DSNAME('DUMP.D111114.H18.SC64.HILGER.S00025')
TITLE=SLIP DUMP ID=PHIL
Dump written by z/OS 01.13.00 SLIP - level same as IPCS level
z/Architecture mode system
May summary dump data be used by dump access? Enter Y to use, N to bypass.
y
125,496 blocks, 522,063,360 bytes, in DSNAME('DUMP.D111114.H18.SC64.HILGER.S000
25')
TIME-03:04:37 PM. CPU-00:00:05 SERVICE-346504 SESSION-08:04:02 NOVEMBER 14,2011
Dump of z/OS 01.13.00 - level same as IPCS level
***
|
Figure 6-17 IPCS Dump Initialization messages
After the initialization process, the address space field in the IPCS Default Values panel will now contain the address space identifier (ASID) information stored in the dump data set DUMP.D111114.H18.SC64.HILGER.S00025. For example:
Address Space ==> ASID(X'0010')
6.6 IPCS utility menu
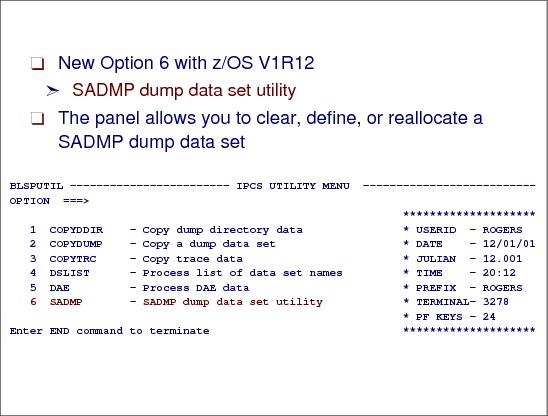
Figure 6-18 New option on IPCS UTILITY MENU - SADMP
IPCS utility panel
When you select Option 3 from the IPCS panel shown in Figure 6-15 on page 157, you receive the panel shown in Figure 6-18. The IPCS Utility Menu panel provides three options for copying data, an option for listing the names of your source data sets, and an option for the dump analysis and elimination (DAE) data set. To invoke it, select Option 3 (Utility) from the IPCS Primary Option Menu panel.
SADMP option
When you choose Option 6, the new SADMP DASD Dump Data Set Utility panel shown in Figure 6-19 on page 161 is displayed. Use the SADMP option to perform the tasks associated with creating, clearing, and reallocating of SADMP data sets on DASD.
|
Note: This new option was available beginning with z/OS V1R12.
|
6.7 SADMP dump data set utility
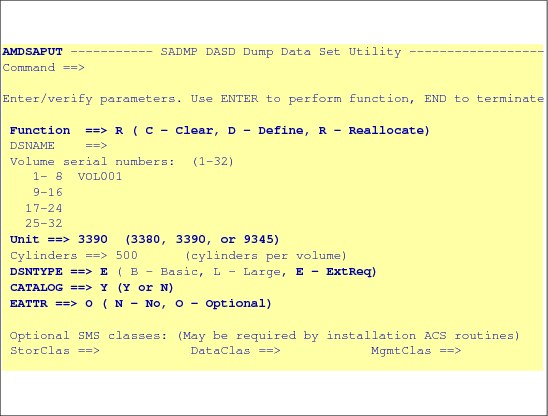
Figure 6-19 Panel to define SADMP processing
SADMP panel
This panel was updated to support EAV volumes in z/OS V1R12. The highlighted options are new in Figure 6-19.
This utility performs the same functions associated with the AMDSADDD REXX utility. You can also use AMDSADDD, but references to SAMPLIB must now refer to ABLSCLI0. The data set is placed in SBLSCLI0 rather than SAMPLIB because it is no longer a sample.
|
Note: Systems and the applications that they support tend to get larger and more complex over time. This impacts the dumps and traces that they produce and, in turn, may create problems for you when you attempt to analyze problems using IPCS.
|
New options with z/OS V1R12
The panel now supports DSNTYPE=EXTREQ DASD dump data sets (extended-format data set (E)) with no operational changes required. The placement of the dump data set on an EAV relies upon the DSNTYPE and EATTR options and the BreakPointValue (BPV). EATTR indicates the extended attributes of the dump data set. EATTR=OPT indicates that extended attributes are optional for the dump data set. EATTR=NO indicates that extended attributes are not requested for the dump data set.
These are the expected results for the different combinations of EATTR and the size of the data set when DSNTYPE=EXTREQ is requested:
•DSNTYPE=EXTREQ,EATTR=OPT - Cylinders requested is more than BPV
Result: Data set in cylinder-managed space (format 8 DSCB)
•DSNTYPE=EXTREQ,EATTR=OPT - Cylinders requested is less than BPV
Result: Data set in track-managed space (Format 8 DSCB)
•DSNTYPE=EXTREQ,EATTR=NO
Result: Data set in track-managed space (Format 1 DSCB)
Use the EATTR parameter to indicate whether the data set can support extended attributes (format 8 and 9 DSCBs) or not. To create such data sets, you can include extended address volumes (EAVs) in specific storage groups or specify an EAV on the request or direct the allocation to an esoteric containing EAV devices.
EATTR = OPT - Extended attributes are optional. The data set can have extended attributes and reside in EAS. This is the default value for VSAM data sets.
EATTR = NO - No extended attributes. The data set cannot have extended attributes (format 8 and 9 DSCBs) or reside in EAS. This is the default value for non-VSAM data sets.
REXX utility AMDSADDD
The REXX utility AMDSADDD resides in SYS1.SBLSCLI0. You can use the AMDSADDD REXX utility to:
•Allocate and initialize the SADMP data set.
•Clear (reinitialize) the data set.
•Reallocate and initialize the data set.
The IPCS SADMP dump data set utility panel, shown in Figure 6-19 on page 161, performs the same functions as the AMDSADDD REXX utility.
6.8 Using IPCS subcommands
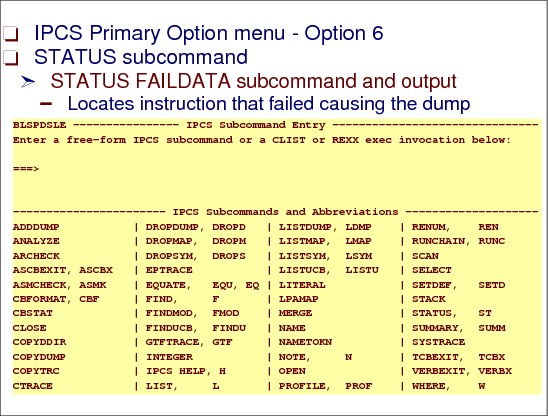
Figure 6-20 IPCS subcommands
Select the IPCS subcommand entry panel
Once you enter the IPCS command to begin an IPCS session, the IPCS subcommands are your main tools for performing dump and trace analysis. These commands allow you to analyze, format, view, retrieve, and copy dump and trace data, and to maintain an IPCS session. You may use subcommands in any mode.
Return to the IPCS Primary Option menu and select Option 6. When you press Enter, the IPCS Subcommand Entry panel is displayed.
STATUS subcommand
Use the STATUS subcommand to display data usually examined during the initial part of the problem determination process.
STATUS produces different diagnostic information depending on the report type parameter or parameters entered: SYSTEM, CPU, WORKSHEET, and FAILDATA.
Locate failing instruction
Use the IPCS subcommand STATUS FAILDATA to locate the specific instruction that failed and to format all the data in an SVC dump related to the software failure. This report gives information about the CSECT involved in the failure, the component identifier, and the PSW address at the time of the error.
Diagnostic report output
The IPCS STATUS FAILDATA command shows a diagnostic report that summarizes the failure. The following show the FAILDATA information. Figure 6-21 shows an example of the IPCS STATUS FAILDATA partial report. A client can use this information to look for same or similar problems already known in the IBM problem data base.
|
SEARCH ARGUMENT ABSTRACT
RIDS/CEEPLPKA#L RIDS/#UNKNOWN AB/U4083 PRCS/00000002 REGS/0E012 REGS/B01D8
Symptom Description
------- -----------
RIDS/CEEPLPKA#L Load module name: CEEPLPKA
RIDS/#UNKNOWN Csect name: #UNKNOWN
AB/U4083 User Abend code: 4083
PRCS/00000002 Abend reason code: 00000002
Time of Error Information
PSW: 07851400 80000000 00000000 0B916CB8
Instruction length: 02 Interrupt code: 000D
Failing instruction text: 00181610 0A0D9500 C39DA774
Breaking event address: 00000000_00000000
Registers 0-15
Home ASID: 0020 Primary ASID: 0020 Secondary ASID: 0020
PKM: 00C0 AX: 0000 EAX: 0000
This Task's ASID/TCB: 0020/007FF3A0
This Task's ASID/TCB: 0020/007FF3A0
RTM was entered because a task requested ABEND via SVC 13.
PSW and registers are the same as those from the time of error.
RECOVERY ENVIRONMENT
Recovery routine type: ESTAE recovery routine
Recovery routine entry point: 0B917CA0
An SVC dump was scheduled by a previous recovery routine.
User requested no I/O processing.
|
Figure 6-21 IPCS STATUS FAILDATA output
|
Note: The STATUS FAILDATA data in this case shows that the load module that was pointed to by the program status word (PSW) was CEEPLPKA, the CSECT within that load module could not be determined, the abend code (U4083), and the abend reason code (002). This information is also displayed during the initialization of the dump data set but is not formatted as it is here.
|
With the information we currently have we could perform a search of the IBM problem databases for a possible solution, but in this instance we will pursue the problem using IPCS to help you develop a better understanding of problem analysis techniques. To get the CSECT module name you need an AMBLIST from LMOD CEEPLPKA.
6.9 SADMP analysis and COPYDUMP
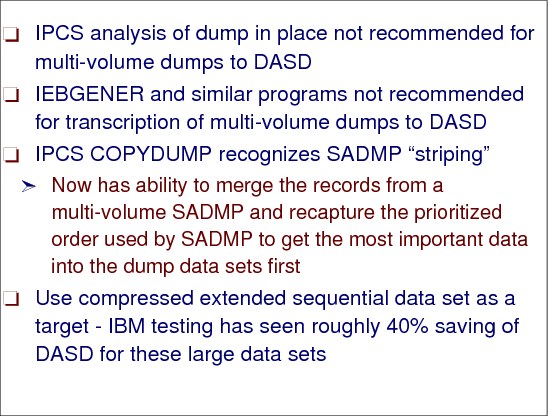
Figure 6-22 SADMP analysis
SADMP analysis considerations
When doing SADMP analysis, consider the following when processing dumps:
•IPCS analysis of dumps in place is not recommended for multi-volume dumps to DASD.
•Use IPCS COPYDUMP since it produces a dump that IPCS can process more efficiently than one copied by IEBGENER or similar programs. This subcommand, COPYDUMP, can be issued from the panel shown in Figure 6-20 on page 163.
Dump testing with CISIZE
Use a compressed extended sequential data set as a target. This could save about 40% of DASD for large data sets. Figure 6-23 on page 166 shows an 87 GB dump, with SADMP, unloaded using IEBGENER. This performance test was to see whether dump directory performance could be improved by simply striping it. Appropriate SMS classes, with a dump directory striped 5 ways, was used to try to improve performance. The result was a dump initialization that completed in 36 minutes.
The version of IPCS with which all preceding runs had taken place was z/OS V1R6 IPCS. A dump directory striped 5 ways and using z/OS V1R7 IPCS resulted in a one third reduction in initialization time and brought it down to 24 minutes.
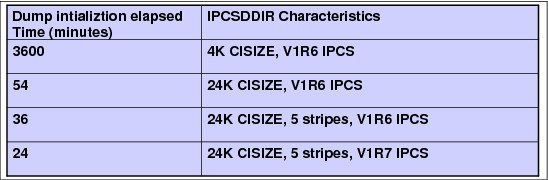
Figure 6-23 Improvement in dump directory size for performance
Striping support
Striping spreads sections, or stripes, of a data set across multiple volumes and uses independent paths, if available, to those volumes. The multiple volumes and independent paths accelerate sequential reading and writing of the data set, reducing the time during which dump I/O competes with production I/O.
It is recommended that the number of stripes match the number of volumes you use. This combination will yield the best performance because MVS data management allows random access to any record as though it appeared on a single volume. This is particularly useful during an IPCS analysis of a dump. The savings when loading the data set are real but smaller, the result of reducing the number of times end of volume processing comes into play.
In a striped data set, when the last volume receives a stripe, the next stripes are placed on the first volume, the second volume, the third, and so on to the last volume, then back to the first volume.
Merge a striped SA dump
To make a striped SA dump ready for IPCS debug, you need to merge it. According to data set naming you can use the job in Figure 6-24.
|
//HILGAA JOB 7904,HILGER,MSGLEVEL=(1,1),MSGCLASS=K,CLASS=A,
// NOTIFY=HILG
//COPY EXEC PGM=IKJEFT01
//IPCSDDIR DD DISP=SHR,DSN=HILG.ZOS1A.DIRECTRY
//SYSTSPRT DD SYSOUT=A
//COPYFROM DD DSN=ONTOP.GS019.P87894.C866.SADMP1,DISP=SHR
// DD DSN=ONTOP.GS019.P87894.C866.SADMP2,DISP=SHR
// DD DSN=ONTOP.GS019.P87894.C866.SADMP3,DISP=SHR
//COPYTO DD DSN=ONTOP.GS019.P87894.C866.SADMP.MERGED,
// DISP=(NEW,CATLG),
// DCB=(RECFM=FBS,LRECL=4160,BLKSIZE=24960),
// SPACE=(CYL,(3000,500),RLSE)
//SYSTSIN DD *
IPCS NOPARM
COPYDUMP OUTFILE(COPYTO) INFILE(COPYFROM) NOCONFIRM
END
|
Figure 6-24 How to merge an SA dump
6.10 IPCS COPYDUMP
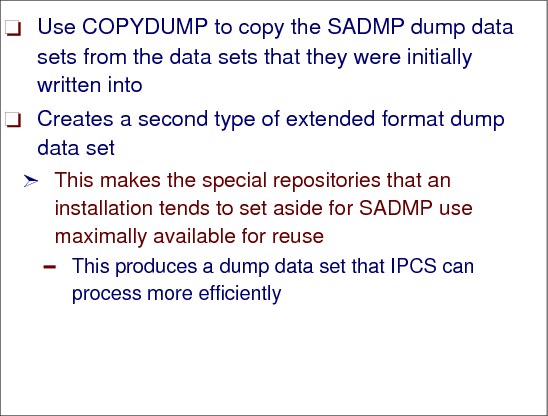
Figure 6-25 Using the IPCS COPYDUMP subcommand
IPCS COPYDUMP
IPCS COPYDUMP is the recommended method to copy an SADMP dump data set. IPCS COPYDUMP can run without a dump directory being employed. IPCS COPYDUMP is enhanced with z/OS V1R7 as follows:
•Input may be a list of ddnames or dsnames to accommodate SADMP overflow. SADMP can fill one dump data set, ask the operator for another, and write overflow records to the second. It can also go from a 2nd to a 3rd and so on. IPCS COPYDUMP has been updated to accept a list of input data sets to bring such dumps back together for analysis.
•Original multi-volume SADMP detected:
– All volumes accessed in parallel.
– Records merged to recover SADMP placement of important data first.
– DSNTYPE=LARGE supported for input and output.
Use COPYDUMP to copy the SADMP dump data sets from the data sets which they were initially written into to a second type of extended format dump data set. This makes the special repositories that the installation tends to set aside for SADMP use maximally available for reuse, and produces a dump data set that IPCS can process more efficiently. SADMP sees a multi-volume dump data set as though it were volume-count separate sequential repositories. DFSMS sees all records on volume 1 followed by all records on volume 2, and so on. Transcription multi-volume SADMPs using COPYDUMP reconciles the two views and produces a data set where the most important records appear early in the dump data set, not scattered across N volumes
6.11 Using subcommands

Figure 6-26 Using subcommands
What ASIDs have been dumped
The SELECT ALL command shows what address spaces were active when the dump was taken. It does not show what address spaces are included in the dump. Figure 6-29 on page 169 shows an example of the IPCS SELECT ALL command.
SELECT CURRENT command
The SELECT CURRENT command displays the address space that was executing at the point in time the dump was initiated. If the dump was issued via a console dump command, the SELECT CURRENT command will display the Master scheduler address space. Figure 6-27 shows the IPCS SELECT CURRENT output.
|
ASID JOBNAME ASCBADDR SELECTION CRITERIA
---- -------- -------- ------------------
0020 BCDRUN 00FCAE80 CURRENT
|
Figure 6-27 IPCS SELECT CURRENT output
This shows that the BCDRUN ASID was dispatched at the time of the abend.
If the dump was taken while in cross-memory mode, both address spaces involved in the cross-memory operation will be included in the dump. Figure 6-28 on page 169 shows the IPCS SELECT CURRENT output, showing the ASIDs involved in the cross-memory function.
|
ASID JOBNAME ASCBADDR SELECTION CRITERIA
---- -------- -------- ------------------
0033 CICSFILE 00F4E680 CURRENT
008E CICSJG03 00ED8100 CURRENT
|
Figure 6-28 IPCS SELECT CURRENT cross-memory output
SLIP and console dumps
For SLIP dumps or dumps initiated from consoles, use SUMMARY FORMAT or VERBEXIT LOGDATA instead of STATUS FAILDATA. Any valid IPCS command would have started the initialization process and the related display that results after initialization. It should be noted that the dump is only initialized the first time it is referenced via IPCS, and will only be initialized again if the dump is deleted from the IPCS inventory.
|
ASID JOBNAME ASCBADDR SELECTION CRITERIA
---- -------- -------- ------------------
0001 *MASTER* 00FD1480 ALL
0002 PCAUTH 00FBDB80 ALL
0003 RASP 00FBDA00 ALL
0004 TRACE 00FBD880 ALL
0005 DUMPSRV 00FBD700 ALL
0006 XCFAS 00FB4700 ALL
0007 GRS 00FB4580 ALL
0008 SMSPDSE 00FA1480 ALL
0009 SMSVSAM 00FA1300 ALL
000A CONSOLE 00FB4400 ALL
000B WLM 00FB4280 ALL
000C ANTMAIN 00FB4100 ALL
000D ANTAS000 00FA3780 ALL
000E OMVS 00FAF080 ALL
0010 IEFSCHAS 00FBFE80 ALL
0011 JESXCF 00FBFD00 ALL
0012 ALLOCAS 00FBF300 ALL
0013 IOSAS 00FBF180 ALL
0014 IXGLOGR 00FA3600 ALL
0015 SMF 00FA3480 ALL
007C CMAS 00F43400 ALL
007D CAS 00F43580 ALL
007E EYUX140 00F43280 ALL
0080 MQT1CHIN 00F45700 ALL
0081 MQC1CHIN 00F38500 ALL
0082 NETMOPS 00F57B80 ALL
0084 NETMSNA 00F57880 ALL
0086 IOAOMON1 00F57580 ALL
0087 XCOM 00F57280 ALL
0088 CICSCCTR 00F57100 ALL
0089 DWTSPAS 00F63B80 ALL
008B CICSUA1B 00F4E280 ALL
008C CICSCA3B 00F47A00 ALL
008D CICSTA3B 00F47880 ALL
|
Figure 6-29 IPCS SELECT ALL output
IP SUMMARY FORMAT
The IP SUMMARY FORMAT output will provide major control blocks living in an address space.
ASCB Address Space Control Block
TCB Task Control Block
STCB Secondary TCB
RB Request Block
XSB eXtended requeSt Block
SRB Service Request Block
SSRB Suspended SRB
WEB Work Element Block (IHAWEB)
IHSA Interrupt Handler Save Area
LSE Linkage Stack Entry
ASCB - Address Space Control Block
An address space typically represents a system application or function, as follows:
•Provides dispatchability information about address spaces
•Provides address space-related queue anchors and data
•Provides information about an address space's local lock
TCB and STCB
TCB - Task Control Block
•Represents a task within an address space.
•A task represents a subfunction within an application.
•Each task is an independent, dispatchable unit of work.
•Provides dispatchability information.
•Used to save task status.
STCB - Secondary TCB
•Associated with a TCB
•Used to save task-related status
RB and XSB
RB - Request Block
•Used to save status as interrupts occur under a task
•Provides some dispatchability information
•Different types of RBs
– PRB - Program Request Block
– SVRB - Supervisor Request Block
– IRB - Interrupt Request Block
XSB - Extended Request Block
•Associated with an RB
•Provides additional area for saving status
SRB and SSRB
SRB - Service Request Block
•Provides information for high priority, asynchronous, non-preemptible execution of work.
– Non-preemptible means that the SRB will be given back the same processor immediately after an interrupt.
•Address space-related, but not task-related.
•See next page for SRB exceptions.
SSRB - Suspended SRB
Holds status information when an SRB gets suspended
•Page fault processing
•Requesting suspend lock (local, CML, or CMS)
6.12 Analyzing dumps

Figure 6-30 Analyzing dumps
Identify address spaces in a dump
To identify which address spaces are contained in the dump, you can also use IPCS as follows:
1. Format the CVT (IPCS command CBF CVT)
Use the CBFORMAT (CBF) primary command to format a control block. CBF CVT formats the CVT control block which contains the ASIDs that are in the dump.
2. Issue a FIND command for RTCT to locate the address of the Recovery Termination Control Table (RTCT).
Use the FIND primary command to search through all dump output for a single occurrence of a specified value.
3. At offset +x'10C' in the RTCT begins a list of 1-word entries for the address spaces in the dump. The first half of the word contains the ASID.
268 (10C) CHARACTER 64 RTCTASTB SVC DUMP ASID TABLE
To shorten this scenario you can use IP CBF RTCT+9C? STR(SDUMP) VIEW(FLAGS)
Figure 6-31 on page 173 shows the commands required to determine what address spaces are contained in the dump. The field SDAS contains the ASIDs that are present in the dump.
|
cbf rtct;f astb
ASTB
SDAS SDF4 SDF5
---- ---- ----
001 03EB F8 00
002 045F F8 00
003 0445 F8 00
004 008A F8 00
005 010F F8 00
006 0000 00 00
007 0000 00 00
|
Figure 6-31 IPCS control block format output of RTCT for the ASTB (SVC DUMP ASID TABLE)
SELECT ASIDLIST command
The select address space identifier (ASID) service scans the ASCBs in a dump by following the pointers in the ASVT and then generates a list of entries for selected address spaces within that dump. The select ASID service returns a list of ASCBs meeting selection criteria. The ASID service also creates storage maps entries for ASCBs, which indirectly improve performance.
Figure 6-32 shows the result of the following IPCS SELECT ASIDLIST command where you use the ASID values returned in the previous format of the RTCT ASTB shown in Figure 6-31. In Figure 6-32, the ASIDs and associated JOBNAMEs that are contained in the dump are displayed.
select asidlist(x'3eb',x'45f',x'445',x'8a',x'10f')
|
ASID JOBNAME ASCBADDR SELECTION CRITERIA
---- -------- -------- ------------------
008A MQT1CHIN 00ED8A00 ASID
010F IMSTFAFM 00F0E280 ASID
03EB IMSTCTL 00F60D00 ASID
0445 MQT1MSTR 00F17700 ASID
045F IMSTDLI 00FA2B80 ASID :
|
Figure 6-32 IPCS SELECT ASIDLIST command output
Get z/OS release information
If you are browsing the storage using IPCS, enter the following command to get the release level:
IPCS LIST CVT
IP L CVT
|
-00028 00FDCA20. E2D7F74B F14BF340 C8C2C2F7 F7F8F040 !SP7.1.3 HBB7780 !
|
6.13 IPCS trace commands - MTRACE

Figure 6-33 Tracing the master trace table with IPCS
VERBX MTRACE subcommand
The VERBEXIT MTRACE subcommand has no parameters. Specify the MTRACE verb name on the VERBEXIT subcommand to display.
Figure 6-34 on page 175 shows an example of the VERBX MTRACE output display the master trace table which is similar to the SYSLOG output.
The VERBX MTRACE command displays the following:
•The master trace table entries for the dumped system. This table is a wraparound data area that holds the most recently issued console messages in a first-in, first-out order.
The MTRACE output in Figure 6-35 on page 175 shows a small sample of what is contained in the MTRACE. In this sample we see details of the symptom dump for our problem.
All data that is displayed on the MVS master console will be captured in the master trace table. The amount of data kept is related to the master trace table buffer size.
•The NIP hard-copy message buffer
•The branch entry and NIP time messages on the delayed issue queue
|
00000090 IEA995I SYMPTOM DUMP OUTPUT
137 00000090 SYSTEM COMPLETION CODE=0F4 REASON CODE=00000024
137 00000090 TIME=17.21.42 SEQ=00084 CPU=0000 ASID=0008
137 00000090 PSW AT TIME OF ERROR 075C2000 82CC5BCC ILC 2 INTC 0D
137 00000090 NO ACTIVE MODULE FOUND
137 00000090 NAME=UNKNOWN
137 00000090 DATA AT PSW 02CC5BC6 - 41F00024 0A0D5880 D19C5840
137 00000090 GPR 0-3 12088C0C 440F4000 00000008 00000583
137 00000090 GPR 4-7 00FD1060 12088C0C 06BA3998 7F7697C8
137 00000090 GPR 8-11 00FD102C 02CC79A5 02CC69A6 02CC59A7
137 00000090 GPR 12-15 82CC49A8 7F769B48 82CC5BC0 00000024
137 00000090 END OF SYMPTOM DUMP
|
Figure 6-34 IPCS VERBX MTRACE output
IPCS Trace Processing panel
The MTRACE can also be obtained by using the IPCS Trace Processing panel. The IPCS Trace Processing panel, shown in Figure 6-35, displays a menu of trace formatting options. Invoke it by selecting option 7 (TRACE) from the Analysis of Dump Contents panel or by entering option 2.7 from the IPCS Primary Option Menu panel, shown in Figure 6-15 on page 157.
After choosing a trace processing option (and specifying parameters for certain options), IPCS processes the request for the current default source and displays the formatted trace data on a dump display reporter panel.
|
BLSPTRC1 ------------------ IPCS Trace Processing -----------------------------
OPTION ===>
To display trace information, enter the corresponding option number.
1 CTRACE - Component trace
2 GTFTRACE - Generalized trace facility
3 MTRACE - Master trace
4 SYSTRACE - System traces
5 MERGE - Merge multiple traces
T TUTORIAL - Details on these traces
Enter END command to terminate IPCS trace processing.
|
Figure 6-35 Using IPCS Trace Processing panel for trace information in the dump
IPCS MVS Dump Component Data Analysis panel
Entering 2.6 on the IPCS primary option menu panel displays the Dump Component Data Analysis panel, bypassing the Analysis of Dump Contents Menu panel. From this IPCS panel you can specify the MTRACE option. For a display of this panel, see Figure C-2 on page 364.
Using IPCS command to browse CTRACE
You can use the IPCS command to browse CTRACE information. Figure 6-36 on page 176 shows the short form of USS CTRACE output provided by IP CTRACE COMP(SYSOMVS).
You can use the IP CTRACE COMP(xxxxxxx) command for all components providing ctrace information.
|
COMPONENT TRACE SHORT FORMAT
COMP(SYSOMVS)
**** 11/14/2011
SYSNAME MNEMONIC ENTRY ID TIME STAMP DESCRIPTION
------- -------- -------- --------------- -------------
SC64 SYSCALL 0F080001 18:28:13.263661 STANDARD SYSCALL ENTRY TRACE
SC64 FILE 05700103 18:28:13.263662 CALL TO VN_RDWR
|
Figure 6-36 IP CTRACE COMP(SYSOMVS) output
If you would like to get detailed information for all active processes, you should use the IPCS command IP CTRACE COMP(SYSOMVS) FULL.
To select a special address space, use IP CTRACE COMP(SYSOMVS) FULL ASID(X’5B’) Output shown in Figure 6-37.
|
SC64 FILE 05940208 18:34:57.741233 RETURN FROM VN_LOOKUP
ASID..005B USERID....HILGER STACK§....27C090C8
TCB...007AE560 EUID......000004BA PID.......0204003E
+0000 D9D9D940 FFFFFFFF 00000081 0654003D ! RRR .......a$... !
+0010 C3D1C1D9 00000040 00000000 7F753000 ! CJAR... ...."... !
+0020 00000000 7EE12D20 00000000 7E9FAD00 ! ....=.......=... !
+0030 00000000 00000000 ! ........ !
|
Figure 6-37 CTRACE full output entry
This ctrace entry shows a bad return code. To get information why it was issued use the IPCS command IP BPXMTEXT 0654003D. The output is shown in Figure 6-38.
|
Notice: unknown modid, reason text may be incorrect
JRDirNotFound: A directory in the pathname was not found
Action: One of the directories specified was not found. Verify that the name
specified is spelled correctly.
|
Figure 6-38 IP BPXMTEXT output
6.14 SYSTRACE command

Figure 6-39 Using the system trace with the SYSTRACE command
Examining the system trace
The system trace table describes the events in the system leading up to the error. The trace table is helpful when the PSW does not point to the failing instruction, and to indicate what sequence of events preceded the abend. You can increase the system trace table using the console command TRACE ST,2M.
Because system trace usually runs all the time, it is very useful for problem determination. While system trace and the general trace facility (GTF) lists many of the same system events, system trace also list events occurring during system initialization, before GTF tracing can be started. System trace also traces branches and cross-memory instructions, which GTF cannot do.
SYSTRACE command
The system trace can be examined by issuing the SYSTRACE command from the IPCS subcommand entry panel shown in the visual. Issuing the SYSTRACE command on its own will display trace entries associated with the dumped ASID only. Issuing the SYSTRACE ALL command will display all system trace entries. To display the time field in local time, add the TIME(LOCAL) parameter. A complete system trace command is as follows:
SYSTRACE ALL TIME(LOCAL)
Reviewing system trace data
Figure 6-40 on page 178 shows a small sample of the system trace. The time stamps would appear on the right-hand side of the display but have been removed for presentation reasons.
The system trace report marks important or significant entries with an asterisk (*). The system trace data can be best reviewed by going to the end of the trace output, and issuing a FIND “*SVC” PREV command. This should help you locate the trace entry that indicates the abend. Another useful trace point to search for is *RCVY, which indicates a recovery action. Entries prior to this can assist with problem diagnosis. An SVC D is the abend SVC. Note that the PSW, which is the same as identified in previous steps will point to the next instruction to be processed.
The SVC trace entries are as follows:
•An SVC trace entry is for processing of a Supervisor Call (SVC) instruction.
•An SVCE trace entry is for an error during processing of an SVC instruction.
•An SVCR trace entry is for return from SVC instruction processing.
|
SYSTRACE Example 1 (*SVC)
------------------------------------------------------------------- CP ASID TCB TRACE ID PSW R15 R0 R1 --|----|--------|-----------|-----------------|---------|--------|- 00 0008 007FD720 *SVC D 075C2000 82CC5BCC 00000024 12088C0C 00 0008 007FD720 SSRV 78 828BC3F0 0000FF50 000000C8 00080000 00 0008 007FD720 SSRV 78 828BC41A 0000FF70 00000FB0 00080000 00 0008 007FD720 EXT 1005 070C0000 813B54AC 00001005 ------------------------------------------------------------------- SYSTRACE Example 2 (*RCVY) ------------------------------------------------------------------- 00 0153 008DA530 SSRV 78 40E5269C 4050E612 000002B8 01530000 00 0153 008DA530 SSRV 78 80E52704 4050E612 00000080 01530000 02 0013 008C5E88 *RCVY PROG 940C4000 00000011 02 0013 008C5E88 SSRV 78 8109CADC 4000EF50 00000818 00010000 02 0013 008C5E88 *RCVY FRR 070C0000 9056FBE8 940C4000 00000011 |
Figure 6-40 IPCS SYSTRACE ALL output
The actual SVC identified in the SYSTRACE is the hexadecimal identification. This must be converted to decimal to enable the correct research, for example:
The SYSTRACE entry for SVC 78 would convert to a decimal SVC number of 120, which, when referencing z/OS MVS Diagnosis Reference, SY28-1084, would identify the GETMAIN/FREEMAIN SVC.
This is an example of just one of the many trace entries that are created during the life of a z/OS task. For a further explanation of other trace entries, you can reference z/OS Diagnosis: Tools and Service Aids, SY28-1085.
Systrace detailed information
When analyzing a dump by looking at the IP SYSTRACE output, it may be that the triggering error took place long before and could not be located in the systrace. Some dumps keep additional systrace information. You can check this with the IP SYSTRACE TTCH(LIST) TIME(LOCAL) command, which will provide the information shown in Figure 6-41.
|
No address spaces with the ERROR attribute were found
TTCH ASID TCB TIME
7F72C000 0001 00000000 11/14/2011 13:34:57.783440
|
Figure 6-41 IP SYSTRACE TTCH(LIST) TIME(LOCAL) output
This output shows only one entry that belongs to the systrace you get using the IP SYSTRACE command. If you have additional entries, IP SYSTRACE TTCH(x'7F2B000') for example, will format trace entries in this TTCH.
Common system trace entries
The system trace entries are formatted by IPCS and displayed in an SVC dump. Note that system trace data in an abend dump has the same format. The subcommand is issued from the IPCS Subcommand Entry panel, SYSTRACE. The entries are:
•Cross Memory entries
– PC - Program Call
– PT - Program Transfer
– PR - Program Return
– SSAR - Set Secondary Address Space Number
•I/O entries
– SSCH - Start Subchannel
– MSCH - Modify Subchannel
– HSCH - Halt Subchannel
– RSCH - Resume Subchannel
•Dispatcher related entries
– DSP - TCB Dispatch
– SRB - Initial SRB Dispatch
– SSRB - Suspended SRB Dispatch
– WAIT - Dummy (No-work) Wait Dispatch
•Interrupt entries
– SVC, SVCR, SVCE - SVC issuance, SVC return, SVC error
– I/O - Input/Output
– CLKC, EMS, EXT, CALL, SS - External interrupts such as Clock Comparator, Emergency Signal, General External, External Call, Service Signal
– PGM - Program Check
– MCH - Machine Check
– RST - Restart
•Recovery entries
– RCVY - Recovery
– ACR - Alternate CPU Recovery
•Additional entries
– SSRV - System Service entered through a PC or branch
– SUSP - Lock suspension
– BR - Branch Trace entry
– MODE - Mode Trace entry
– BSG - Branch to Subspace Group
•Exception entries
– *PGM
– *SVCE D
– *RCVY
– *RST
– *ACR
– *I/O
•Using wrong IPCS migration library
If you are debugging for example a 1.13 dump using the 1.12 IPCS migration library level, you will not get all entries in a systrace output displayed correctly, as shown in Figure 6-42.
|
02 0607 006C1468 ?EXPL 000F 7B0052FC FE9BE0E4 0008000F
006C1468 00000607 00040004
47044001 80000000 00000000
01757286 00000000 00040300
00800000 00000001 00FA6580
02 0607 006C1468 ?EXPL 0003 7A0052FC FEDBC5C2 00080003
006C1468 00000607 00040004
47044001 80000000 00000000
01757286 00001005 00000001
00FA6580 00000000
02 0607 006C1468 ?EXPL 000F 7B0052FC FEDC205A 0008000F
006C1468 00000607 00040004
47044001 80000000 00000000
01757286 00000000 00040300
00800000 00000001 00FA6580
|
Figure 6-42 Bad systrace entries due to wrong IPCS migration library
Systrace output examination
The systrace output in Figure 6-43 on page 181 shows an error indication followed by Functional Recovery Routines (FRRs) calls. RTM1 is entered due to a program check. An FRR receives control and requests retry.
|
PR ASID WU-ADDR- IDENT CD/D PSW----- ADDRESS- UNIQUE-1 UNIQUE-2 UNIQUE-3
UNIQUE-4 UNIQUE-5 UNIQUE-6
00 0001 009A8A10 PGM 011 070C4000 94111D9E 00020011 00000000
00002001
00 0001 009A8A10 *RCVY PROG 940C4000 00000011 00000000
00 0001 009A8A10 SSRV 78 811CB9EA 4000EF50 00000970 00F9D690
00010000
00 0001 009A8A10 *RCVY FRR 070C0000 94111E94 940C4000 00000011 00000000
00000001
00 0001 009A8A10 *RCVY RTRY 070C0000 94111E7C 140C4000 00000011 00000000
00000001
00 0001 009A8A10 SSRV 78 811C5158 0000EF03 00000970 00F9D690
00010000
00 0001 009A8A10 PR ... 0 06E95C7C 14111E7C
|
Figure 6-43 Systrace error entry
Figure 6-43 displays the following:
*RCVY FRR 070C0000 94111E94 entry: RTM1 gives control to an FRR at 14111E94
*RCVY RTRY 070C0000 94111E7C entry: The FRR requestsretry to 14111E7C
SSRV 78 811C5158 entry: RTM1 freeing an SDWA
The error could be fixed by an FRR. An FRR is delivered by the application program. Figure 6-44 shows a failing scenario that could not be recovered.
|
PR ASID WU-ADDR- IDENT CD/D PSW----- ADDRESS- UNIQUE-1 UNIQUE-2 UNIQUE-3
UNIQUE-4 UNIQUE-5 UNIQUE-6
02-0035 006CB220 PGM 011 078D1400 92436C78 00040011 00000000
456F8000
02-0035 006CB220 *RCVY PROG 940C4000 00000011 00000000
02-0035 006CB220 SSRV 12D 814159E8 006CB220 000C8000 FF3A0000
00000000
02-0035 006CB220 SSRV 12D 81415A04 006CB220 000B8000 00000000
00000000
02-0035 006CB220 DSP 078D1400 8130C79A 00000000 3FE69D50 40FE9B8C
02-0035 006CB220 *SVC D 078D1400 8130C79C 00000000 3FE69D50 40FE9B8C
02-0035 006CB220 SSRV 78 83C174AE 0000FF50 000000C8 006BF000
00350000
02-0035 006CB220 SSRV 78 83C174E4 0000FF70 00001210 7F267DF0
00350000
|
Figure 6-44 Non-recoverable error
If the System Trace Table is not available, the problem could be:
•Using wrong level of IPCS
•Problem with the dump data set
•TRT is not requested in SDATA of SVC Dump (LZ command against the dump will show whether ASID 4 is dumped)
•A major control block (for example CVT) is overlayed and IPCS cannot get to the System Trace Table.
6.15 IPCS SUMMARY subcommand
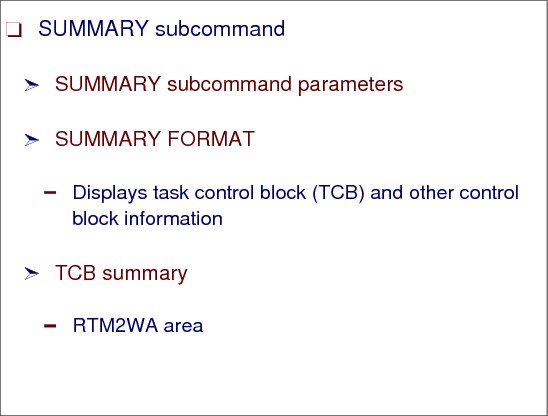
Figure 6-45 Using SUMMARY subcommand to locate failing TCB
SUMMARY subcommand
Use the SUMMARY subcommand to display or print dump data associated with one or more specified address spaces.
Using SUMMARY produces different diagnostic reports depending on the report type parameter, FORMAT, KEYFIELD, JOBSUMMARY, and TCBSUMMARY, and the address space selection parameters, ALL, CURRENT, ERROR, TCBERROR, ASIDLIST, and JOBLIST. Specify different parameters to selectively display the information you want to see. See Figure C-3 on page 365 for a display of all the parameters with the SUMMARY subcommand.
|
Note: Installation exit routines can be invoked at the system, address space, and task level for each of the parameters in the SUMMARY subcommand.
|
SUMMARY FORMAT command
The SUMMARY FORMAT command displays task control block (TCB) and other control block information. By issuing the MAX DOWN, or M PF8 command the TCB summary will be located.
TCB summary
The TCB summary can be located at the end of an IPCS summary format report as shown in the following example. By reviewing the data in the CMP field, we see that TCB 007FD588 has a non-zero CMP field that reflects the 440F44000 abend. Figure 6-46 shows the TCB Summary.
|
* * * * T C B S U M M A R Y * *
JOB SMXC ASID 0008 ASCB 00FBC580 FWDP 00FBC400 BWDP 00F4E600 PAGE
TCB AT CMP NTC OTC LTC TCB BACK PAGE
007FE240 00000000 00000000 00000000 007FDE88 007FF1D8 00000000 000014
007FF1D8 00000000 00000000 007FE240 00000000 007FDE88 007FE240 000018
007FDE88 00000000 007FF1D8 007FE240 007FD588 007FDB70 007FF1D8 000021
007FDB70 00000000 00000000 007FDE88 00000000 007FD588 007FDE88 000024
007FD588 440F4000 02000000 00000000 00000000 00000000 007FBFB8 000026
|
Figure 6-46 TCB Summary at the bottom of the SUMMARY FORMAT display
RTM2WA area
By issuing a FIND “TCB: 007FD588” prev command, the failing TCB data is displayed in the Summary Format display. From this point, you can locate the RTM2WA area. This can contain information that in many cases identifies the failing program.
In the TCB summary, find the task control block (TCB) for the failing task. This TCB has the abend code as its completion code in the CMP field. In the TCB summary, obtain the address of the recovery termination manager 2 (RTM2) work area (RTM2WA) for the TCB.
In the RTM2WA summary, obtain the registers at the time of the error and the name and address of the abending program.
If the RTM2WA summary does not give the abending program name and address, probably an SVC instruction abnormally ended.
If the RTM2WA summary gives a previous RTM2WA for recursion, the abend for this dump occurred while an ESTAE or other recovery routine was processing another, original abend. In recursive abends, more than one RTM2WA may be created. Use the previous RTM2WA to diagnose the original problem.
If IP SUMM FORMAT shows a non-zero completion code in the CMP column but you do not see a RTM2 work area for this TCB, the error was recovered.
6.16 What is VERBX

Figure 6-47 VERBEXIT subcommand for exit routines
IPCS VERBEXIT subcommand
You use the VERBEXIT subcommand to run an installation-supplied or IBM-supplied verb exit routine. One of the more common IPCS commands is VERBEXIT (VERBX). VERBX supports a product-specific exit routine that can be used to format the dump. See Figure C-4 on page 366.
VERBX example
For example, to format dump data for CICS/TS Release 1.3 we would use the exit routine DFHPD530. This program is supplied with CICS/TS Release 1.3 to enable you to format the CICS/TS-specific data.
For example, the commands could be used as follows:
•Format the CICS Dispatcher data contained in the dump.
VERBX DFHPD660 ‘DS=1’
•Format the IMS save area.
VERBX IMSDUMP ‘imsjobname FMTIMS savearea’
•Format the DB2 thread data.
VERBX DSNWDMP ‘verbx dsnwdmp 'sumdump=no,subsys=itso,ds=1'
Verb exit routine
A verb exit routine can generate a unique diagnostic report that is not currently available in IPCS. A verb exit routine can process either:
•Installation application storage
•IBM component data areas and storage
Verb exit routines can be defined in BLSCUSER, in the IPCSPARM concatenation data set, or invoked by name. Define the verb exit routine in the BLSCUSER parmlib member with the following statement:
EXIT EP(name) VERB(verb_name) AMASK(X'aaFFFFFF')
ABSTRACT('text') HELP(helppanel)
The variables are as follows:
name The exit routine name.
verb_name The exit routine verb name.
aa Can be either:
•00 - Indicates 24-bit storage accessing.
•7F - Indicates 31-bit storage accessing.
text The abstract shown on the component data analysis panel entry associated with this verb exit.
Figure 6-48 shows a list of all VERBX options that can be used. A detailed description is shown in z/OS MVS IPCS Commands, SA22-7594.
|
ALCWAIT AOMDATA ASMDATA AVMDATA BLSAIPST CBFATA CICSDATA DAEDATA DSNWDMP
GRSTRACE HASMFMTM IEAVTSFS IEFIVAWT IEFIVIGD IMSDUMP IRLM JESXCF JES3
LEDATA LOGDATA MMSDATA MTRACE NUCMAP SADMPMSG SMSDATA SMSXDATA SRMDATA
SUMDUMP SYMPTOM TSODATA VSMDATA VTAMMAP
|
Figure 6-48 VERBX options
6.17 IPCS VERBX LOGDATA command

Figure 6-49 VERBEXIT LOGDATA subcommand and LOGREC reports
LOGDATA verb
Specify the LOGDATA verb name on the VERBEXIT subcommand to format the LOGREC buffer records that were in storage when the dump was generated. LOGDATA locates the LOGREC records in the LOGREC recording buffer and invokes the EREP program to format and print the LOGREC records. The records are formatted as an EREP detail edit report.
LOGDATA report
Use the LOGDATA report to examine the system errors that occurred just before the error that caused the dump to be requested.
Examining the LOGREC buffer
Use the IPCS subcommand VERBEXIT LOGDATA to view the LOGREC buffer in a dump. This report might repeat much of the information contained in the STATUS FAILDATA report, but it helps to identify occasions when multiple error events caused the software failure.
Viewing the LOGDATA report
When viewing the VERBEXIT LOGDATA report, skip the hardware records to view the software records. Search for the first software record. Figure 6-50 on page 187 shows the start of the last error log entry displayed.
|
TYPE: SYMPTOM RECORD REPORT: SOFTWARE EDIT REPORT DAY YEAR
REPORT DATE: 319 11
SCP: VS 2 REL 3 ERROR DATE: 314 11
MODEL: 2094 HH MM SS.T
SERIAL: 06991E TIME: 06:07:39.8
SEARCH ARGUMENT ABSTRACT:
PIDS/5752SCLOG RIDS/IXGC4CWO RIDS/IXGINPVT#L LVLS/770
FLDS/RETCODE VALU/H0000000C FLDS/REASON VALU/H03190001
------- -----------
Hardware record
DEVICE NUMBER: 006138 REPORT: OUTBOARD (LONG) DAY YEA
SCP: VS 2 REL. 3 DATE: 316 11
DEVICE NED: 002105.000.IBM.75.000000021968.0138
DEVICE TYPE: 3390
MODEL: 2094 HH MM S
ERROR PATH: 9B-6138 CPU ID: 06991E TIME: 12 57 2
RECORD IS: TEMPORARY
MODE IS: 370XA
CC CA FL CT
FAILING CCW: AF 1DA15BF0 00 000C
K FLAGS CA US SS CT
SCSW: 05 824417 02746BF0 02 00 000C
|
Figure 6-50 VERBX LOGDATA output Soft and Hardware entries
System error log
Another valuable source of diagnostic information in the dump are the system error log entries, which are created for all hardware and software error conditions. To review these records the VERBX LOGDATA command can be used and the last records should relate to the abend. This is not always the case, but reviewing this data from the last entry and moving backwards in time can often present information that relates to the problem or may indicate what the cause was. This may indicate a hardware or software error. In our case, the logdata does include records for our problem and is representative of data already found.
6.18 Using the SYS1.LOGREC
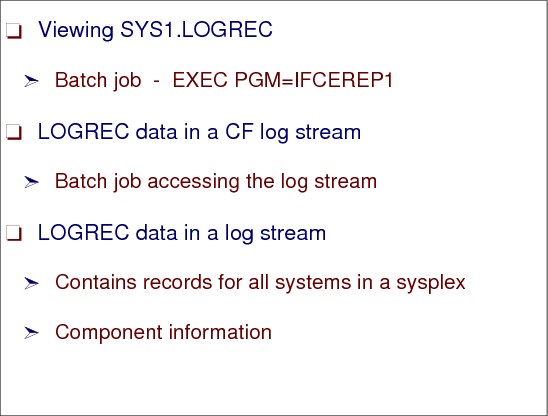
Figure 6-51 Using SYS1.LOGREC data
Viewing SYS1.LOGREC
The system error log can also be interrogated via a batch utility. The program used to extract this data from either the online error log data set, SYS1.LOGREC, or a historical error log data set is, IFCEREP1. This program can be used to produce hardware and software failure reports in both a summary and detailed format. Figure 6-52 shows the JCL required to process a software summary report.
|
//LOGREC JOB,..........
//STEP1 EXEC PGM=IFCEREP1,PARM=CARD
//SYSPRINT DD SYSOUT=*
//SERLOG DD DSN=SYS1.LOGREC,DISP=SHR
//DIRECTWK DD UNIT=SYSDA,SPACE=(CYL,5,,CONTIG)
//EREPPT DD SYSOUT=(*,DCB=BLKSIZE=133)
//TOURIST DD SYSOUT=(*,DCB=BLKSIZE=133)
//SYSIN DD *
PRINT=PS
TYPE=SIE
ACC=N
TABSIZE=512K
ENDPARM
//
|
Figure 6-52 IFCEREP1 sample JCL
LOGREC data in a CF
If your LOGREC data is stored in a Coupling Facility (CF) log stream data set you can use the IFCEREP1 program to access this. Figure 6-53 shows the JCL that will enable you to produce error log reports from the log stream data set.
|
//LOGREC1 JOB,.........
//EREPLOG EXEC PGM=IFCEREP1,REGION=4M,
// PARM=(¢ HIST,ACC=N,TABSIZE=512K,PRINT=PS,TYPE=SIE¢ )
//ACCIN DD DSN=sysplex.LOGREC.ALLRECS,
// DISP=SHR,
// SUBSYS=(LOGR,IFBSEXIT,¢ FROM=(1999/125),TO=YOUNGEST¢ ,
// ¢ SYSTEM=SC42¢ ) ,
// DCB=(RECFM=VB,BLKSIZE=4000)
//DIRECTWK DD UNIT=SYSDA,SPACE=(CYL,5,,CONTIG)
//TOURIST DD SYSOUT=*,DCB=BLKSIZE=133
//EREPPT DD SYSOUT=*,DCB=BLKSIZE=133
//SYSABEND DD SYSOUT=*
//SYSIN DD DUMMY
|
Figure 6-53 IFCEREP1 JCL to format Coupling Facility LOGREC data
LOGREC reports
When generating error log reports from log stream data it should be remembered that the log stream data set contains error information for all systems in the sysplex connected to the Coupling Facility. You should use the SYSTEM option of the SUBSYS parameter to filter the log stream records. Date and time parameters will also assist with the filtering.
Component information
Other information is included in the error log information in the component data. This can assist with isolating the specific product that is being affected and the maintenance level of the module that detected the failure. The maintenance level or service release level is also known as the PTF level, or you might be requested for the replacement modification identifier (RMID). It should be noted that the maintenance level of the failing load module is not necessarily the maintenance level of the failing CSECT, or module, within the load module.
Figure 6-54 shows some of the component data that can be located in the system error log.
|
COMPONENT INFORMATION:
COMPONENT ID: 5695DF115
COMPONENT RELEASE LEVEL: 1B0
PID NUMBER: 5695DF1
PID RELEASE LEVEL: V1R2
SERVICE RELEASE LEVEL: UW04733
DESCRIPTION OF FUNCTION: PDSE LATCH SUPPORT
PROBLEM ID: IGW00000
SUBSYSTEM ID: SMS
|
Figure 6-54 LOGREC error component data
6.19 IPCS virtual storage commands
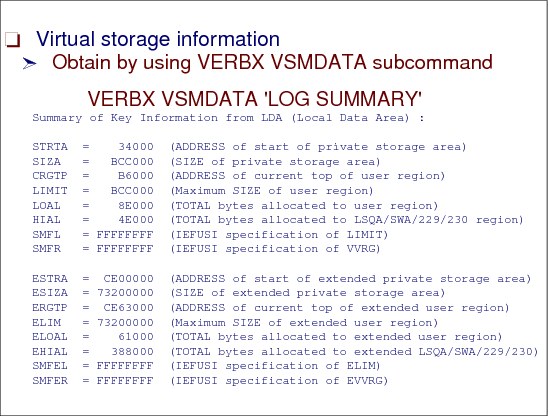
Figure 6-55 Virtual storage data
Virtual storage information
Interrogating Virtual Storage usage in a dump is achieved by using the IPCS VERBX VSMDATA command. Some examples of this command are:
VERBX VSMDATA ‘LOG SUMMARY’
VERBX VSMDATA 'OWNCOMM' (Check Common Storage Tracking)
VERBX VSMDATA 'OWNCOMM DETAIL ALL SORTBY(ASIDADDR)'
VERBX VSMDATA 'OWNCOMM DETAIL ASID(ddd) SORTBY(TIME)'
VERBX VSMDATA 'NOGLOBAL,JOBNAME(xxxxDBM1)'
The VERBX VSMDATA parameters are shown in Figure C-5 on page 366.
The VERBX VSMDATA command also supports a SUMMARY parameter, which provides a more concise report designed specifically for diagnosis of out of storage conditions. This report, generated by the VERBEXIT VSMDATA 'SUMMARY' subcommand, formats key data from the following VSM control blocks:
•Address queue anchor table (AQAT)
•Allocated element (AE)
•Double free element (DFE)
•Descriptor queue element (DQE)
•Free block queue element (FBQE)
•Free queue element (FQE)
•Global data area (GDA)
•Local data area (LDA)
The end of the VSMDATA LOG SUMMARY display has this interesting summary that can be very helpful for assisting with S878/80A abends. Figure 6-56 on page 191, and Figure 6-60 on page 193 show a sample of the data displayed for the Virtual Storage Manager.
|
L O C A L S T O R A G E D A T A S U M M A R Y
LOCAL STORAGE MAP
___________________________
! !80000000 <- Top of Ext. Private
! Extended !
! LSQA/SWA/229/230 !80000000 <- Max Ext. User Region Address
!___________________________!7F25B000 <- ELSQA Bottom
! !
! (Free Extended Storage) !
!___________________________!2511A000 <- Ext. User Region Top
! !
! Extended User Region !
!___________________________!24B00000 <- Ext. User Region Start
: :
: Extended Global Storage :
=======================================<- 16M Line
: Global Storage :
:___________________________: 800000 <- Top of Private
! !
! LSQA/SWA/229/230 ! 800000 <- Max User Region Address
!___________________________! 785000 <- LSQA Bottom
! !
! (Free Storage) !
!___________________________! CA000 <- User Region Top
! !
! User Region !
!___________________________! 6000 <- User Region Start
: System Storage :
:___________________________: 0
Input Specifications:
Region Requested => 7FF00000
IEFUSI/SMF Specification => SMFL : FFFFFFFF SMFEL: FFFFFFFF
SMFR : FFFFFFFF SMFER: FFFFFFFF
Actual Limit => LIMIT: 7FA000 ELIM : 5B500000
|
Figure 6-56 VERBX VSMDATA storage map output
|
Summary of Key Information from LDA (Local Data Area) :
STRTA = 6000 (ADDRESS of start of private storage area)
SIZA = 7FA000 (SIZE of private storage area)
CRGTP = CA000 (ADDRESS of current top of user region)
LIMIT = 7FA000 (Maximum SIZE of user region)
LOAL = A0000 (TOTAL bytes allocated to user region)
HIAL = 69000 (TOTAL bytes allocated to LSQA/SWA/229/230 region)
SMFL = FFFFFFFF (IEFUSI specification of LIMIT)
SMFR = FFFFFFFF (IEFUSI specification of VVRG)
ESTRA = 24B00000 (ADDRESS of start of extended private storage area)
ESIZA = 5B500000 (SIZE of extended private storage area)
ERGTP = 2511A000 (ADDRESS of current top of extended user region)
ELIM = 5B500000 (Maximum SIZE of extended user region)
ELOAL = 340000 (TOTAL bytes allocated to extended user region)
EHIAL = C56000 (TOTAL bytes allocated to extended LSQA/SWA/229/230)
SMFEL = FFFFFFFF (IEFUSI specification of ELIM)
SMFER = FFFFFFFF (IEFUSI specification of EVVRG)
|
Figure 6-57 Summary of Key Information from LDA in VSMDATA output
Figure 6-58 shows that an IEFUSI exit, which is used to minimize storage, is active.
|
Input Specifications:
Region Requested => 0
IEFUSI/SMF Specification => SMFL : 980000 SMFEL: 79E00000
SMFR : 880000 SMFER: 79800000
Actual Limit => LIMIT: 980000 ELIM : 55100000
|
Figure 6-58 IEFUSI active
Figure 6-59 shows IEFUSI not active. This is shown by the FFFFFFFF character strings.
|
Input Specifications:
Region Requested => 7FF00000
IEFUSI/SMF Specification => SMFL : FFFFFFFF SMFEL: FFFFFFFF
SMFR : FFFFFFFF SMFER: FFFFFFFF
Actual Limit => LIMIT: 7FA000 ELIM : 5B500000
|
Figure 6-59 IEFUSI not active
Subpool usage summary
This SUMMARY report also generates the following information:
•Global storage map
•Global subpool usage summary
•Local storage map
•Local subpool usage summary
What are subpools
A subpool is a group of logically related storage blocks identified by a subpool number. In a request for virtual storage, a subpool number indicates the type of storage that is requested.
•VSM manages storage through the use of subpools. Each subpool has an associated set of predefined storage characteristics, for example user region, fetch-protected.
•Subpools are storage requested via GETMAIN or STORAGE OBTAIN services.
– User input: subpool number and storage size
– VSM output: storage of requested size and characteristics
•Subpools start off empty, then they grow, as follows:
When a user requests a page of storage from a particular subpool, VSM maps a page of free storage to that subpool, then passes the storage address to the user. When a page is mapped to a subpool, it is said to be subpool-assigned or allocated.
|
Note: The Global and Local subpool usage summaries reflect pages that have all or some of the page allocated. You can find information about the allocation of a particular page in the VSM control blocks representing the page.
|
Following is a subpool storage usage summary for each TCB.
|
LOCAL SUBPOOL USAGE SUMMARY
TCB/OWNER SP# KEY BELOW ABOVE TOTAL
--------- --- --- ----- ----- -----
9FF410 129 0 340000 3100000 3440000
9FF410 130 8 100000 1200000 1300000
9FF410 130 9 80000 200000 280000
9FF410 131 8 4000 62B000 62F000
9FF410 132 4 0 1E000 1E000
9FF410 132 8 C000 86000 92000
LSQA 205 0 0 A3000 A3000
LSQA 215 0 0 19000 19000
LSQA 225 0 0 15000 15000
9FFE88 229 0 0 D000 D000
9FFBF8 229 0 0 1C000 1C000
9FF5A8 229 0 1000 2000 3000
9FF410 229 0 0 1000 1000
9FF180 229 0 0 1000 1000
9FB280 229 0 0 8000 8000
9ECE88 229 0 0 1000 1000
9ECAD8 229 0 3000 9000 C000
|
Figure 6-60 VERBX VSMDATA subpool usage summary
What is high virtual storage
The IARV64 macro allows a program to use the full range of virtual storage in an address space that is supported by 64-bit addresses. The macro creates and frees storage areas above the two gigabyte address and manages the physical frames behind the storage. Each storage area is a multiple of one megabyte in size and begins on a megabyte boundary. You can think of the IARV64 macro as the GETMAIN/FREEMAIN, PGSER or STORAGE macro for virtual storage above the 2-gigabyte address.
The 2-gigabyte address in the address space is marked by a virtual line called the bar. The bar separates storage below the 2-gigabyte address, called below the bar, from storage above the 2-igabyte address, called above the bar. The area above the bar is intended to be used for data only, not for executing programs. Programs use the IARV64 macro to obtain storage above the bar in “chunks” of virtual storage called memory objects. Your installation can set a limit on the use of the address space above the bar for a single address space. The limit is called the MEMLIMIT. Therefore, this virtual storage is:
•64-bit addressable storage located above the 2-GB bar
•Managed by RSM, not VSM
•Managed via the IARV64 macro rather than GETMAIN/FREEMAIN or STORAGE
•Storage always obtained in 1-Meg multiples
•Allocated areas are called Memory Objects
– Private memory objects are owned by TCBs.
– Shared memory objects are owned by the system.
Use the IPCS RSMDATA HIGHVIRT command to view memory object status. You can use the IPCS RSMDATA HIGHVIRT ASID(X’5B') command to list storage above the BAR for asid x’5B’. Figure 6-61 shows the storage layout, including the 64-bit addressing area.
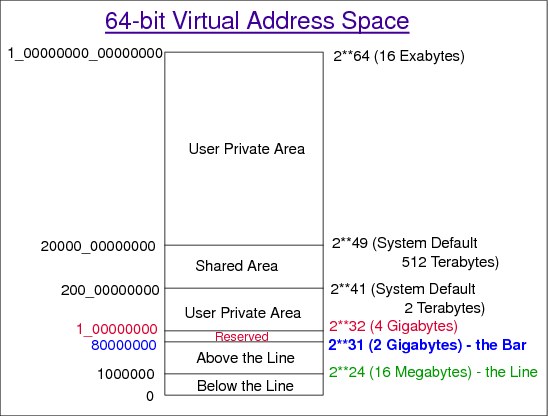
Figure 6-61 Storage layout
6.20 Using IPCS to browse storage
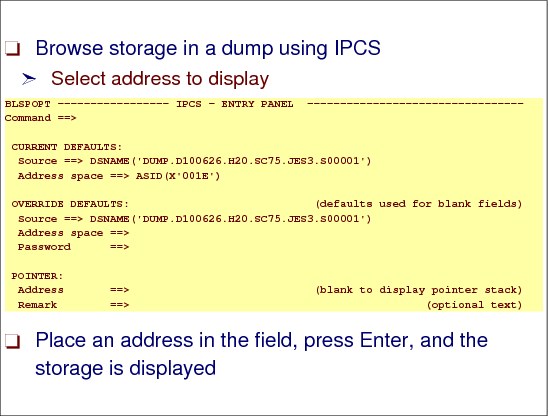
Figure 6-62 Browsing storage with IPCS
Browse storage in a dump using IPCS
Another function of IPCS is the ability to browse storage locations with the dump. There will be many times when you will need to look at storage locations in a dump using IPCS. Normally you browse storage locations once you have been viewing other options in the dump. Select the BROWSE (Option 1) from the IPCS primary option menu, shown in Figure 6-15 on page 157. The next panel will identify the current dump data set, as shown in Figure 6-63 on page 196.
Select address to display
Once you place an address in the Address (Pointer: field) in Figure 6-63 on page 196, the address appears in Figure 6-64 on page 196.
|
------------------------- IPCS - ENTRY PANEL ---------------------------------
Command ==>
CURRENT DEFAULTS:
Source ==> DSNAME('DUMP.D0506.H15.SC65.GABERT1.S00011')
Address space ==> ASID(X'001E')
OVERRIDE DEFAULTS: (defaults used for blank fields)
Source ==> DSNAME('DUMP.D100626.H20.SC75.JES3.S00001')
Address space ==>
Password ==>
POINTER:
Address ==> (blank to display pointer stack)
Remark ==> (optional text)
|
Figure 6-63 IPCS BROWSE storage panel
From this panel you can do a select (S) on the address, as shown in Figure 6-64.
|
DSNAME('DUMP.D0506.H15.SC65.GABERT1.S00011') POINTERS ------------------------
Command ===> SCROLL ===> CSR
ASID(X'001E') is the default address space
PTR Address Address space Data type
S0003 01329D48. ASID(X'001E') AREA
Remarks:
|
Figure 6-64 IPCS BROWSE storage Select option
Storage address displayed
Figure 6-65 shows the storage at location 01329D48—storage starting at that address.
|
ASID(X'001E') ADDRESS(01329D48.) STORAGE -------------------------------------
Command ===> SCROLL ===> CSR
01329D48 50E0D004 91802021 | &}.j... |
01329D50 47806124 45E0631A 47F0629E BF8F208C | ../.....0...... |
01329D60 47806184 58B08008 9501B018 47706162 | ../d....n...../. |
01329D70 1F11BF17 B0014100 00484130 00FA45E0 | ............... |
|
Figure 6-65 IPCS BROWSE selected storage
Browsing dataspace storage
Dataspaces are used to have quick access to data stored in the 2-Gig storage area. To list data space storage you need to have the dataspaces you would like to look at in the dump. If you would like to dump all dataspaces for omvs, you have to use the following option in your dump command or slip: DSPNAME=(‘OMVS’.*)
Figure 6-66 on page 197 shows how to access dataspace storage.
|
DSNAME('DUMP.D111114.H18.SC64.HILGER.S00025') POINTERS -----------------------
Command ===> SCROLL ===> CSR
ASID(X'0010') is the default address space
PTR Address Address space Data type
s0001 00. ASID(X'0010') DSPNAME(SYSZBPX2) AREA
Remarks:
|
Figure 6-66 Browse dataspace storage
6.21 Using IPCS to find the failing instruction
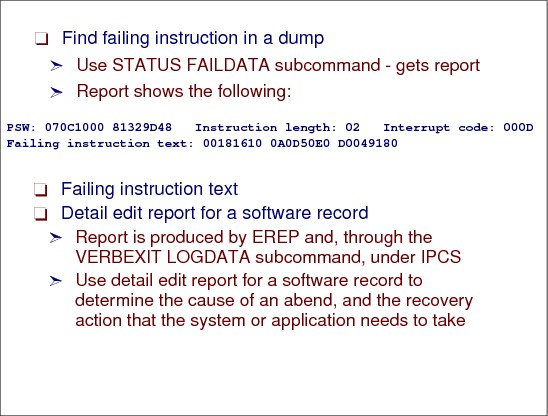
Figure 6-67 Finding the failing instruction in a dump
Find failing instruction in a dump
Normally when analyzing certain dumps, one of the first things to determine is to find the failing instruction. The STATUS FAILDATA report also helps you find the exact instruction that failed. This report—an example is shown in Figure C-6 on page 367 and Figure C-7 on page 368—provides the PSW address at the time of the error and the failing instruction text. Note that the text on this screen is not always the failing instruction text. Sometimes the PSW points to the place where the dump was taken and not the place where the error occurred. See Figure 6-20 on page 163, for the STATUS subcommand. On that display you issue the STATUS FAILDATA subcommand.
From the report, the PSW and failing instruction text are as follows:
PSW: 070C1000 81329D48 Instruction length: 02 Interrupt code: 000D
Failing instruction text: 00181610 0A0D50E0 D0049180
Failing instruction text
This contains 12 bytes of the instruction stream at the time of the error, including the actual instruction that caused the abend. Starting at the end of the sixth byte, subtract the instruction length to indicate the failing instruction. In the preceding example, the failing instruction is X'0A0D'.
Detail edit report for a software record
The detail edit report for a software record shows the complete contents of an error record for an abnormal end, including the system diagnostic work area (SDWA). The report is produced by EREP and, through the VERBEXIT LOGDATA subcommand, under IPCS.
Use the VERBEXIT subcommand to format the logrec buffer records that were in storage when the dump was generated. LOGDATA locates the logrec records in the logrec recording buffer and invokes the EREP program to format and print the logrec records. The records are formatted as an EREP detail edit report.
Use the LOGDATA report to examine the system errors that occurred just before the error that caused the dump to be requested.
EREP detail edit report
Use this report to determine the cause of an abend, and the recovery action that the system or application has either taken or not taken. This report enables you to locate where an error occurred, similar to the analysis of an SVC dump. Once you locate the error, you can develop a search argument to obtain a fix for the problem.
See Environmental Record Editing and Printing Program (EREP) User's Guide, GC35-01511, for information about producing a detail edit report for an SDWA-type record. See z/OS MVS Interactive Problem Control System (IPCS) Commands, SA22-7594, for information about the VERBEXIT LOGDATA subcommand.
6.22 Analyzing for resource contention
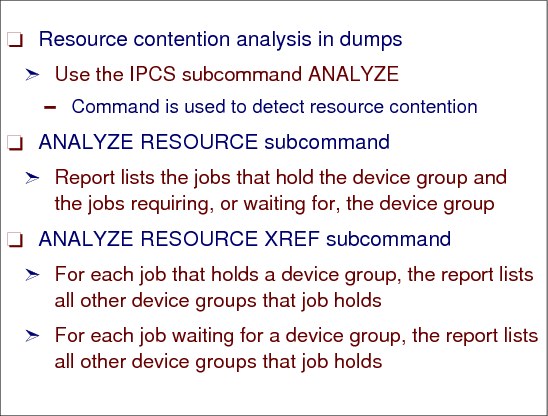
Figure 6-68 Subcommands to analyze resource contention
Resource contention analysis in dumps
You can obtain information related to resource contention by using the IPCS subcommand ANALYZE. Use the ANALYZE subcommand to gather contention information from component analysis exits and format the data to show where contention exists in the dump. ANALYZE obtains contention information for I/O, ENQs, suspend locks, allocatable devices, real frames, global resource serialization latches, and other resources.
This command is used to detect resource contention. Specifying GRSQ in the SDATA options makes the information more reliable. Generally the most useful information is found at the bottom of this example report, shown in Figure 6-69. The top is generally I/O device contention and is not usually relevant.
|
RESOURCE #0011:
NAME=MAJOR=IGDCDSXS MINOR=SYSD.DFSMS.COMMDS SCOPE=SYSTEMS
RESOURCE #0011 IS HELD BY:
JOBNAME=SMS ASID=0025 TCB=009EB0F0 SYSNAME=CM01
RESOURCE #0011 IS REQUIRED BY:
JOBNAME=SMS ASID=0026 TCB=009EB0F0 SYSNAME=PR02
JOBNAME=SMS ASID=0026 TCB=009EB0F0 SYSNAME=PR03
JOBNAME=SMS ASID=0028 TCB=009EC660 SYSNAME=SP02
JOBNAME=SMS ASID=0027 TCB=009EB0F0 SYSNAME=TS01
|
Figure 6-69 Resource contention data from the IPCS ANALYZE command
|
Note: Holders of and waiters on resources are identified in the output. ASIDs and TCBs (where appropriate) are provided and if the scope is SYSTEMS, the resource is the holding system name.
|
ANALYZE RESOURCE subcommand
The ANALYZE RESOURCE subcommand produces a report that identifies each resource, or device group, that is experiencing contention. Under each resource, it lists the jobs that hold the device group and the jobs requiring, or waiting for, the device group. For example, the resource name in contention in Figure 6-69 on page 200 is:
MAJOR=IGDCDSXS MINOR=SYSD.DFSMS.COMMDS SCOPE=SYSTEMS
|
Note: Scope=SYSTEMS means multisystem, and scope=SYSTEM means single system.
|
ANALYZE RESOURCE XREF subcommand
If you add the XREF keyword to the ANALYZE RESOURCE subcommand, IPCS would add the following information to the previous report:
•For each job that holds a device group, the report lists all other device groups that job holds.
•For each job waiting for a device group, the report lists all other device groups that job holds.
Report using XREF keyword
An example of the output from a report generated using the XREF keyword is shown in Figure 6-70.
|
CONTENTION REPORT BY RESOURCE NAME
RESOURCE #0001:
NAME=GROUP record, group = SYSMCS , member = all members
RESOURCE #0001 IS HELD BY:
JOBNAME=XCFAS ASID=0006 UNKNOWN#00000001=00000000
DATA=Local lock owner
Request id = 000131B8
Request code = 00000002
|
Figure 6-70 ANALYZE RESOURCE XREF report
6.23 Searching IBM problem databases

Figure 6-71 Providing database search information
IBM database searches
At this point in time we have evaluated some of the available diagnostic data from the dumps. Look in z/OS MVS Systems Codes, SA22-7626 to find the meaning of an 0F4 abend. Figure 6-72 shows the explanation from this manual for a 0F4 abend.
|
Explanation: An error occurred in DFSMSdfp support.
Source: DFSMSdfp
System Action: Prior to the ABEND error occurring, a return code was placed in the general register 15 and a reason code in general register 0. An SVC dump has been taken unless the failure is in IGWSPZAP where register 15 contains 10. The DFSMSdfp recovery routines retry to allow the failing module to return to its caller. See DFSMS/MVS DFSMSdfp Diagnosis Guide for return code information. Programmer Response: System error. Rerun the job.
System Programmer Response: If the error recurs and the program is not in error, search problem reporting data bases for a fix for the problem. If no fix exists, contact the IBM Support Center. Provide the JCL, the SYSOUT output for the job, and the logrec data set error record.
|
Figure 6-72 Documented abend S0F4 Information
|
Note: The 9 volumes of the z/OS MVS System Messages and Systems Codes, SA22-763x manuals should always be your first reference point for possible causes.
|
Build search arguments for IBM databases
These are recommended formats to be used when querying the problem database or reporting problems. These are not the only formats that are used, and some creativity and imagination can assist with expanding your search. These search arguments are also called a symptom string. If the problem being diagnosed was already reported and the symptoms entered in the database, the search will produce a match. Figure 6-73 displays what we know of the abend details.
|
LOAD MODULE NAME: IGWLHHLS - Maintenance level UW04733
CSECT NAME: IGWLGMOT - Maintenance level UW03389 SYSTEM ABEND CODE: 00F4 ABEND REASON CODE: 00000024 RSN=12088C01 |
Figure 6-73 Abend details
This information can be used to build the IBM problem database search arguments. The search arguments should use the following formats:
Abend: The format should be ABENDxxx or ABENDSxxx, where xxx is the abend code.
Messages The format should be MSGxxxxxxx, where xxxxxxx is the message code.
Return and Reason Codes
The format should be RCxx, where xx is the reason or return code. A reason code alternative is:
The format should be RCxx, where xx is the reason or return code. A reason code alternative is:
Reason Codes The format can be RSNxxxxx, where xxxxx is the reason code.
Partial dump check
A partial or incomplete dump will be missing some key areas of storage that in most cases will make the dump useless when it comes to efficient problem diagnosis. We should first check whether the dump is ok. The command shown in Figure 6-74 can provide this information, but there could be another problem which will not be shown by this command. If the dump has been transferred via FTP, it could be that not all data has been sent correctly.
|
Command ===> l e0. block(0) l(16)
|
Figure 6-74 Partial dump check command
The dump will not be a partial dump if you receive the following information:
LIST E0. BLOCK(0) LENGTH(X'10') AREA
E0. LENGTH(X'10')==>All bytes contain X'00'
If you get a bad return like the one shown below, you need to refer to the z/OS data areas manual. These codes are mapped by the SDRSN control block.
LIST E0. BLOCK(0) LENGTH(X'10') AREA
BLOCK(0) ADDRESS(E0)
000000E0. 00000000 30000000 00000000 00000000
For this example, you will find:
20000000 - The system detected an error in the SVC dump task and gave recovery control
10000000 - The SVC dump task failed
Partial standalone dumps
While it is always best to get a complete standalone dump, sometimes time constraints will not allow this. There is no guarantee that it will be possible to diagnose a failure from a partial standalone dump; however, if the choice is between no dump at all or a partial dump, then the partial dump is the best choice.
When taking a partial standalone dump:
•Let the standalone dump run for as long as you can. If you run out of time, you can stop the dump cleanly.
•A standalone dump tries to write out the most important information first:
– Status information (PSW, registers, and so forth) for all CPUs
– Critical real storage, including common storage and trace information
– Real storage for address spaces executing at the time of the dump
– Any remaining real storage
– Paged out storage for swapped in address spaces
– Paged out storage for swapped out address spaces
•Use the EXTERNAL INTERRUPT key to terminate the dumping process. This causes a clean stop, closing the output data set properly.
..................Content has been hidden....................
You can't read the all page of ebook, please click here login for view all page.