

IBM Fault Analyzer for z/OS
Fault Analyzer for z/OS provides the information you require to determine the cause and assist with the resolution of application and system failures. Integrated support for Java and IBM WebSphere Application Server for z/OS gives Fault Analyzer expanded application coverage and related business value beyond traditional applications. You can use this one tool to assist in composite-application abend analysis, including 64-bit DB2 Universal Database support. It helps you repair failures quickly by gathering information about an application and its environment at the time of failure.
When an application abend occurs, Fault Analyzer captures and analyzes real-time information about the application and its environment, then generates an analysis report detailing the cause of the failure. The report describes the failure in terms of the application code, so you no longer lose time reviewing cumbersome, low-level system error messages. Fault Analyzer allows you to choose a report format to locate the information more easily.
Each application abend is recorded by Fault Analyzer in a fault-history file by job name, failure code and other details, along with the analysis report and storage pages referenced during the analysis. This information can later be retrieved to reanalyze the failure.
Through the inclusion of softcopy versions of selected manuals, Fault Analyzer can extract message and failure-code descriptions and insert them into the analysis report where applicable. You can also provide your own descriptions for messages.
You can write your own user exits. For example, you can write a user exit to access compiler listings that are compressed or available only through a proprietary access method.
Integration with IBM Rational® Developer for IBM System z® enables application developers to work with fault entries directly from their development environment, and also allows Debug Tool and Fault Analyzer to share common source files without redundancy.
IBM Application Performance Analyzer for z/OS, IBM Debug Tool Utilities and Advanced Functions for z/OS, IBM Fault Analyzer for z/OS and IBM File Manager for z/OS, along with Optim™ MOVE and Rational Developer for System z, provide a robust suite of problem determination tools that can help improve application delivery throughout the application life cycle.
11.1 Fault Analyzer
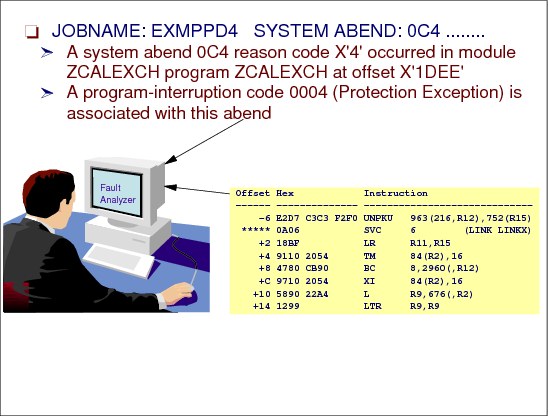
Figure 11-1 Fault Analyzer
Fault Analyzer highlights
A summary of the main features of Fault Analyzer for z/OS:
•Fault Analyzer provides a detailed report about program failures to help you resolve them quickly, which also includes a fault-history file that enables you to track and manage application failures and fault reports.
•Fault Analyzer offers a view of storage contents, trace tables, and terminal screen images at the time of failure to help speed corrective action.
•Fault Analyzer provides the ability to customize message descriptions to be used in application-failure reports.
•All z/OS subsystems and compilers are supported.
•Fault Analyzer provides integration with Rational Developer for System z.
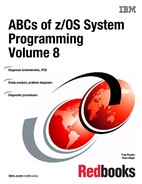
System abend analysis
When an application abend occurs, such as an 0C4, Fault Analyzer captures and analyzes real-time information about the application and its environment, then generates an analysis report detailing the cause of the failure. The report describes the failure in terms of the application code, so you no longer lose time reviewing cumbersome, low-level system error messages. Fault Analyzer allows you to choose a report format to locate the information more easily.
Recording abend information
Each application abend is recorded by Fault Analyzer in a fault-history file by job name, failure code and other details, along with the analysis report and storage pages referenced during the analysis. This information can later be retrieved to reanalyze the failure.
|
Note: This chapter describes how to work with Fault Analyzer using the panels provided on z/OS. If you need information about Fault Analyzer Browser, see IBM Application Development and Problem Determination, SG24-7661.
|
11.2 Fault Analyzer analysis options
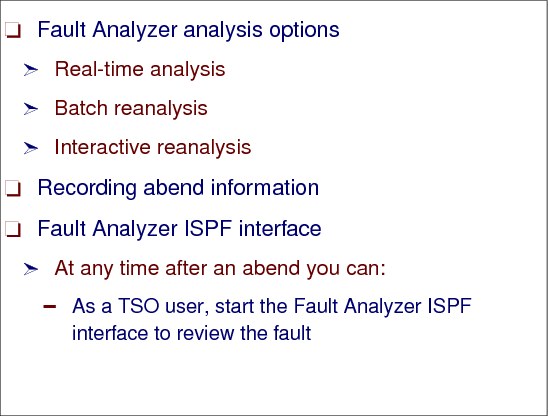
Figure 11-2 Fault Analyzer analysis options
Using Fault Analyzer
Fault Analyzer provides three modes to help you better track and analyze application and system failure information:
•Real-time analysis
When a program abends, the abend processing (MVS or subsystem) is intercepted and Fault Analyzer is automatically invoked via an appropriate exit for the processing environment. Fault Analyzer performs fault analysis processing, and then records details about the abend in a history file. Fault Analyzer writes the fault analysis report to the job, and a summary to the SYSLOG. It also saves the analysis report in the history file along with a minidump consisting of a copy of all virtual storage pages that were referenced during the analysis process.
|
Note: If Fault Analyzer deems the analysis to be successful, and either a SYSMDUMP, SYSABEND, or SYSUDUMP was specified for the abending job step, then Fault Analyzer tells MVS to suppress the dump.
|
•Batch reanalysis
Batch reanalysis generates a new analysis report. This report is based on the dump and information gathered in real time, but with potentially different options specified, or with compiler listings or side files made available. You can submit a Fault Analyzer batch-mode job using either the Fault Analyzer ISPF or RDz interface or your own job control language.
The format of the batch reanalysis report is the same as the real-time analysis report. The batch reanalysis report is written as a sequential file to a DD statement in the reanalysis job but it is not saved in the fault history file entry. As well as using the ISPF interface to initiate batch reanalysis, you can also submit a batch reanalysis job using your own JCL.
•Interactive reanalysis
Interactive reanalysis runs under ISPF and enables you to navigate through a formatted, structured view of a fully detailed reanalysis. This Fault Analyzer mode enables you to view working storage and control blocks at the time the dump was written. The interface has many point-and-click fields for easy navigation through the interactive reports.
The reanalysis process is essentially identical to the real-time analysis process, except for the following:
– Fault Analyzer obtains the required information from the saved minidump (and/or SYSMDUMP) instead of the abending program's virtual storage.
– The history file is not updated.
– No summary is written to the SYSLOG.
|
Note: Interactive reanalysis can only be initiated using the Fault Analyzer ISPF interface.
|
The Fault Analyzer ISPF interface
At any time after an abend you can, as a TSO user, start the Fault Analyzer ISPF interface to review the fault. Using this interface you can:
•View the stored real-time analysis report.
•Start a batch reanalysis.
•Start an interactive reanalysis.
•View information about the fault.
•View details about any faults that might have occurred, that were deemed to be duplicates of the current fault.
•Delete the fault entry.
|
Attention: When analyzing dumps with Fault Analyzer, you can choose several ways to do the analysis, as follows:
1. Use a line command as shown in “IDI.SIDIEXEC(IDISFA) as a line command” on page 274.
|
11.3 IDI.SIDIEXEC(IDISFA) as a line command
Figure 11-3 IDI.SIDIEXEC(IDISFA)
IDI.SIDIEXEC(IDISFA)
To use this exec, it needs to be copied to a data set that is allocated to the SYSPROC concatenation of the ISPF user. Although the name of this sample is IDISFA, it may be more convenient to rename it to a shorter name, FA for example, once it has been copied to the SYSPROC data set.
Modifying your ISPF environment
To use Fault Analyzer with ISPF, you need to ensure that the appropriate data sets have been allocated and that one or more ways to invoke Fault Analyzer have been provided. This is now explained.
Allocating ISPF data sets
The following data sets must be allocated to the respective ISPF DDnames (either in the TSO logon procedure or using any other installation-specific method):
•DDname Data set name
•ISPPLIB IDI.SIDIPLIB
•ISPMLIB IDI.SIDIMLIB
•ISPSLIB IDI.SIDISLIB
•ISPTLIB IDI.SIDITLIB
•SYSEXEC IDI.SIDIEXEC
One of the data sets that should exist after you have completed the SMP/E APPLY of Fault Analyzer is:
IDI.SIDIEXEC
This data set contains the REXX execs that are needed and should be placed into SYSEXEC as shown above. While IDISFA will work as a line command against ISPF 3.4 data sets, as long as IDI.SIDIEXEC is included in the SYSEXEC concatenation, it might be more convenient to copy this exec to another data set in the SYSEXEC concatenation with a shorter name, for example FA.
Using Fault Analyzer with a line command
From ISPF Option 3.4, enter a HLQ, dump, on the command line; Figure 11-4 is displayed, showing the current dumps.
|
Menu Options View Utilities Compilers Help
-----------------------------------------------------------------------------
DSLIST - Data Sets Matching DUMP Row 1 of 24
Command ===> Scroll ===> PAGE
Command - Enter "/" to select action Message Volume
-------------------------------------------------------------------------------
DUMP *ALIAS
IDISFA DUMP.D120204.H02.SC55.OMVS.S00001 DUMPS8
DUMP.D120204.H02.SC69.DUMPSRV.S00001 DUMPS3
DUMP.D120212.H15.SC67.MQG2MSTR.S00001 DUMPS3
DUMP.D120217.H01.SC55.DB9MMSTR.S00001 DUMPS3
DUMP.D120218.H18.SC69.WOMS001S.S00001 DUMPS6
DUMP.D120221.H16.SC69.#MASTER#.S00004 DUMPS4
DUMP.D120221.H18.SC47.#MASTER#.S00009 DUMPS6
DUMP.D120222.H00.SC55.WMSR01AS.S00002 DUMPS2
DUMP.D120222.H00.SC55.WMSR01AS.S00003 DUMPS5
DUMP.D120222.H00.SC55.WMSR01AS.S00004 DUMPS4
DUMP.D120222.H05.SC55.WKDMGR.S00005 DUMPS3
DUMP.D120223.H00.SC55.WKDMGR.S00001 DUMPS2
DUMP.D120224.H11.SC47.IM1BCQS.S00001 DUMPS7
DUMP.D120224.H11.SC47.IM1BRM.S00002 DUMPS4
DUMP.D120227.H03.SC55.WYSR01A.S00002 DUMPS1
DUMP.D120301.H05.SC55.WYSR01AA.S00003 DUMPS6
|
Figure 11-4 Current dumps in the system
As shown in Figure 11-4, when you enter the command IDISFA next to a dump, this invokes Fault Analyzer.
11.4 Analyze MVS dump data set selection
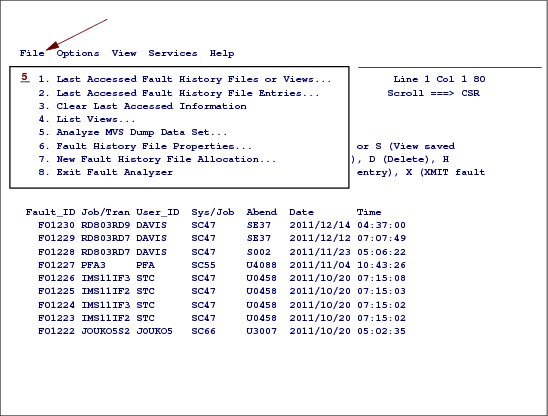
Figure 11-5 Analyze MVS dump data set selection (Option 5)
MVS dump data set selection
If you know the dump data set name you want to analyze, you can use the options shown in Figure 11-5 and the Options described below.
Once the cursor is placed on an action-bar item, File, in Figure 11-5, press the Enter key and the associated pull-down menu is displayed, as shown in Figure 11-5.
Select Option 5
By selecting Option 5 in the pull-down shown in Figure 11-5, Figure 11-6 on page 277 is displayed.
Then Enter the dump data set name to initiate the analysis. This Option is mainly used to initiate an interactive analysis of a SYSMDUMP or SVC dump data set and is primarily intended for CICS system dump analysis or Java dump analysis.
|
Note: The data set name specification follows the ISPF data set name rules, that is, a data set name that is not enclosed in single quotes is prefixed with the current TSO profile prefix.
|
The data set specified is checked for existence before being accepted. In Figure 11-6 on page 277, data set CICS.GS075.P78308.C724.D111110.N4039.SYD is being analyzed.
The last data set name specified is stored in the ISPF profile for your application ID and is used for initialization of the display.
|
File View Services Help
------------------------------------------------------------------------------
Analyze MVS Dump Data Set
Enter the name of a MVS SVC or SYSMDUMP data set and press Enter to initiate
analysis. To return from this display without performing analysis, issue the
Exit (PF3) or Cancel (PF12) command.
Dump Data Set Name. . . . . : 'CICS.GS075.P78308.C724.D111110.N4039.SYD'
*** Bottom of data.
|
Figure 11-6 Enter dump data set name
11.5 Invoke Fault Analyzer from ISPF
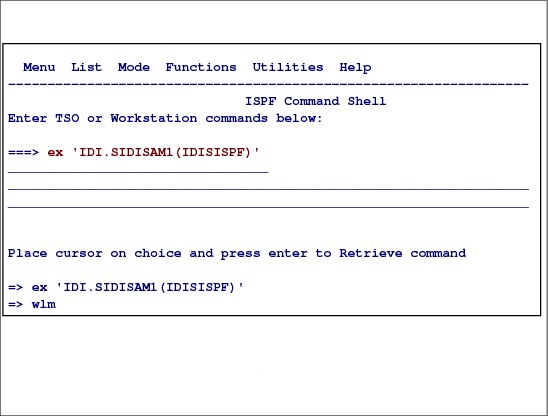
Figure 11-7 ISPF Option 6 panel to invoke Fault Analyzer
Invoke Fault Analyzer from ISPF
|
Note: A sample REXX EXEC that can be used to invoke Fault Analyzer from within ISPF is provided as member IDISISPF in data set IDI.SIDISAM1. The EXEC performs the necessary dynamic definition of the required data sets using the ISPF LIBDEF and TSO ALTLIB services.
To enable edit or browse of data sets using IBM File Manager for z/OS, all necessary ISPF libraries for File Manager must be made available also when Fault Analyzer is invoked. Refer to the File Manager documentation for information about the required data set names that should be added to your TSO logon procedure or invocation exec. The IDISISPF sample exec allows you to optionally include File Manager data sets.
To help with diagnosis of problems relating to the allocation of data sets for Fault Analyzer, the TSO/ISPF commands ISRDDN, ISRFIND, or ISPLIBD might be useful.
|
While IDISFA will work as a line command against ISPF 3.4 data sets, as long as IDI.SIDIEXEC is included in the SYSEXEC concatenation, it might be more convenient to copy this exec to another data set in the SYSEXEC concatenation with a shorter name, for example FA, or use the following command from the ISPF Option 6 command line:
ex 'IDI.SIDISAM1(IDISISPF)'
This command displays Figure 11-8 on page 279.
11.6 IBM Fault Analyzer history files

Figure 11-8 IBM Fault Analyzer history files
Fault history files
Fault Analyzer performs fault analysis processing, and then records details about the abend in a history file. It writes the fault analysis report to the job, and a summary to the SYSLOG. It also saves the analysis report in the history file along with a minidump consisting of a copy of all virtual storage pages that were referenced during the analysis process. This mode of operation is known as “real-time analysis”.
Fault history files are PDS(E) data sets that contain information about faults that have been analyzed by Fault Analyzer. Fault entries, which are stored as separate members in the history file, as shown in Figure 11-8, contain the following type of information:
•Real-time analysis key information, such as abend code and failing program name
•Execution environment details, such as job name, system ID, and date and time when the fault occurred
•Associated real-time analysis report (if applicable)
•Saved minidump (if applicable)
•Name of associated SYSMDUMP or SVC dump data set (if applicable)
Each new fault entry in a history file is given an identifier, which is unique to that history file. The ID consists of a 1-3 character prefix, and the default is F, followed by a 5-digit sequence number.
|
Note: Although a history file can be either a PDS or a PDSE data set, PDSE data sets are recommended because they provide concurrent member write capability, which is not possible with PDS data sets. This allows Fault Analyzer to provide better sharing and performance when using PDSE history files.
|
Select a dump to analyze
The options, as shown in Figure 11-8 on page 279, are the following line commands:
•? (Query)
•V or S (View saved report)
•I (Interactive reanalysis)
•B (Batch reanalysis)
•D (Delete
•H (Duplicate history)
•C (Copy fault entry)
•M (Move fault entry)
•X (XMIT fault entry).}
Interactive reanalysis (I)
As shown in Figure 11-9 on page 281, when you enter an I next to a history file as shown in Figure 11-8 on page 279, when the specified MVS dump data set name has been validated, the Fault Analyzer CICS system abend analysis commences as indicated by the message being displayed in Figure 11-9 on page 281:
“Analyzing MVS dump data set. Please wait...”
11.7 Analyzing dumps with Fault Analyzer

Figure 11-9 Analyzing an MVS dump data set
Analyzing dumps with Fault Analyzer
The purpose of Fault Analyzer is to determine why an application abends. After analyzing information about the application and its environment, Fault Analyzer generates an analysis report. The report describes the problem in terms of application code, which means that application developers and system programmers are not forced to interpret a low-level system dump or system-level error messages. As a result, the reason for the abend is made available sooner and with less effort.
Figure 11-10 on page 282 is displayed when the analysis of the “SYSTEM ABEND: 0C4:” , is complete. This Interactive Reanalysis Report is the first display shown when interactive reanalysis has finished analyzing a fault. It includes a brief summary of the fault and provides access to key areas of the analysis.
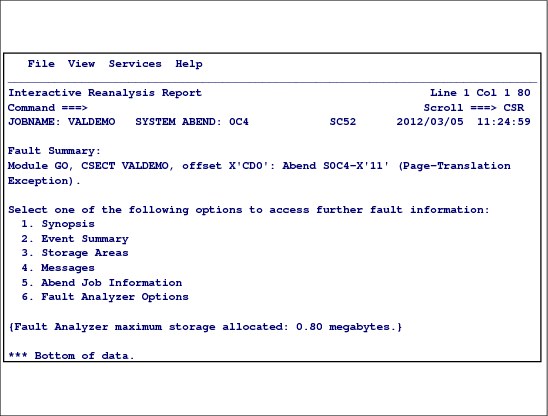
Figure 11-10 Sample Interactive Reanalysis Report display
Interactive Reanalysis Report panel
There are six options shown in Figure 11-10 for the Report, but there are many possible options that can be displayed depending on the abend type. For the particular abend, the options shown are:
1. Synopsis Selecting the Synopsis option shows a display that summarizes the analysis of the fault. The synopsis will normally contain all of the information that is required to diagnose and fix the problem that caused the fault.
2. Event Summary Selecting the Event Summary option displays a summary list of all the events associated with the fault. This display is particularly useful for getting an overview of complex faults involving numerous abends and other events.
3. Storage Areas Selecting the Storage Areas option provides access to information about storage areas for all events.
4. Messages Selecting the Messages option provides access to information about all messages issued, regardless of the event to which they might belong.
5. Abend Job Information Selecting the abend job information option provides information about the execution environment of the abending job.
6. Fault Analyzer Options Selecting Fault Analyzer options provides information about the Fault Analyzer options that were in effect during the fault analysis.
11.8 A CICS selected dump
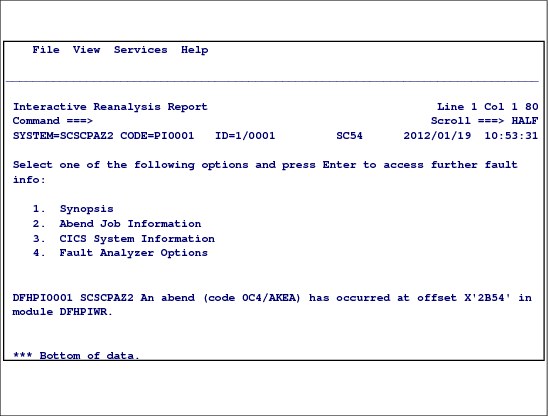
Figure 11-11 A CICS selected dump
CICS selected dump
When the analysis of the CICS system abend has completed, the CICS system abend interactive report is shown Figure 11-11. From this panel, you can display the following information:
•For Option 1 - Synopsis, see “1. Synopsis” on page 283.
•For Option 2 - Abend Job Information, see “2. Abend Job Information” on page 284.
•For Option 3 - CICS System Information, see “3. CICS System Information” on page 286.
•For Option 4 - Fault Analyzer Options, see “4. Fault Analyzer options” on page 291.
1. Synopsis
Selecting option 1 from the CICS System Abend Interactive Reanalysis Report display results in the presentation of the CICS System Abend Synopsis display, of which an example is shown in Figure 11-12 on page 284.
This display provides details about the analyzed dump.
|
Synopsis Line 1 Col 1 80
Command ===> ________________________________________________ Scroll ===>HALF
SYSTEM=SCSCPAZ2 CODE=PI0001 ID=1/0001 SC54 2012/01/19 10:53:31
Fault Information:
CICS Product Level. . . . . : V6 R6 M0
Dump Id . . . . . . . . . . : 1/0001
Dump Code . . . . . . . . . : PI0001
Date/Time . . . . . . . . . : 2012/01/19 10:53:31 (Local)
Message . . . . . . . . . . : DFHPI0001 SCSCPAZ2 An abend (code 0C4/AKEA) has
occurred at offset X'2B54' in module DFHPIWR.
Symptoms. . . . . . . . . . : PIDS/5655S9700 LVLS/660 MS/DFHPI0001
RIDS/DFHPIWR PTFS/UK57403 AB/S00C4 AB/UAKEA
ADRS/00002B54
Title . . . . . . . . . . . : n/a
Caller address. . . . . . . : n/a
*** Bottom of data.
|
Figure 11-12 A CICS System Abend Options display
2. Abend Job Information
Selecting option 2 from the CICS System Abend Interactive Reanalysis Report display results in the presentation of the Abend Job Information display, of which an example is shown in Figure 11-13 on page 285.
|
SYSTEM=SCSCPAZ2 CODE=PI0001 ID=1/0001 SC54 2012/01/19 10:53:31
Job information:
Abend Date. . . . . . . . . : 2012/01/19
Abend Time. . . . . . . . . : 10:53:31
System Name . . . . . . . . : SC54
Subsystem Info. . . . . . . : CICS V6 R6 M0 (TS 4.1)
Job Name. . . . . . . . . . : CICSPAZ2
Job Step Name . . . . . . . : CICSPAZ2
Exec Program Name . . . . . : DFHSIP
Requested Region Size . . . : 0M
User id . . . . . . . . . . : CICSUSER
Execution Environment:
Operating System. . . . . . : z/OS V01R11M00
Data Facility Product . . . : DFSMS z/OS V1R11M0
CPU Model . . . . . . . . . : 2097
SDUMP Parameter List:
+0000 FLAG0.... 12 FLAG1.... A1 SDATA.... BFE2 DCBAD....
+0010 ECBAD.... 00000000 SRBAD.... 00000000 CASID.... 0057 TASID....
+0020 SDDAT.... 00000000 FLAG2.... 00 CNTL1.... C0 TYP1.....
+002C EXIT..... FD40 SDAT3.... 40 SDAT4.... 00 SPLST....
+002C EXIT..... FD40 SDAT3.... 40 SDAT4.... 00 SPLST....
+003C DCBA..... 00000000 STRAL.... 00000000 HDRA..... 00000000 ASDLA....
+0054 KEYLA.... 00000000 LSTDP.... 00000000 LSTDA.... 00000000 SMLLP....
+006C PSWRA.... 00000000 SYMAD.... 00000000 SYMA..... 00000000 IDAD.....
+0084 SLALT.... 00000000 ITADR.... 0221F398 ITALT.... 00000000 RMADR....
+009C PDALT.... 00000000 JLADR.... 00000000 JLALT.... 00000000 DLADR....
SDATA Options:
ALLNUC (All Nucleus). . . . . . .: Yes
ALLPSA (All Prefix Save Areas). .: Yes
COUPLE (Coupling Facility). . . .: Yes
CSA (MVS Common Service Area) . .: Yes
DEFAULTS. . . . . . . . . . . . .: No
GRSQ (Resource Serialization) . .: Yes
IO (Input/Output) . . . . . . . .: Yes
LPA (Link Pack Area). . . . . . .: Yes
LSQA (Local System Queue Area). .: Yes
NUC (Nucleus) . . . . . . . . . .: Yes
PSA (Prefix Save Area). . . . . .: No
RGN (Private Region). . . . . . .: Yes
SQA (System Queue Area) . . . . .: Yes
SUM (Summary Dump). . . . . . . .: Yes
SWA (Scheduler Work Area) . . . .: Yes
TRT (MVS Trace Tables). . . . . .: Yes
---------------------------------- more data -------------
|
Figure 11-13 Abend Job Information display
3. CICS System Information
Selecting option 3 from the CICS System Abend Interactive Reanalysis Report display results in the presentation of the CICS System Information display, of which an example is shown in Figure 11-14.
|
SYSTEM=SCSCPAZ2 CODE=PI0001 ID=1/0001 SC54 2012/01/19 10:53:31
Select one of the following options and press Enter:
1. CICS Task Summary
2. Error History
3. Storage Usage by Task
4. MTRACE records
AI - AutoInstall Manager AP - Application Domain
BR - Bridge Information CC - Catalog Domains
CQ - Console Queue Component CSA - Common System Area
DB2 - DB2 Information DD - Directory Domain
DH - Document Handler Domain DLI - DL/I Information
DM - Domain Manager DP - Debug Profile Domain
DS - Dispatcher Domain DU - Dump Domain
EJ - Enterprise Java Domain FC - File Control
IC - Interval Control IS - ISC/IP Domain
KE - Kernel Domain LD - Loader Domain
LG - Log Manager Domain LM - Lock Manager Domain
ME - Message Domain MN - Monitoring Domain
MRO - Multiregion Option MQ - MQ Domain
NQ - Enqueue Domain OT - Object Transaction Domain
PA - Parameter Domain PG - Program Manager Domain
PI - Pipeline Manager Domain PR - Partner Resource Manager
PT - Partner Domain RM - Recovery Manager Domain
RS - Region Status Domain RZ - Request Stream Domain
SIT - System Initialization Table SJ - SJ (JVM) Domain
SM - Storage Manager Domain SO - Sockets Domain
SSA - Static Storage Areas ST - Statistics Domain
TCP - Terminal Control Definitions TD - Transient Data Domain
TI - Timer Domain TMP - Table Manager
TR - Trace Domain TS - Temporary Storage Domain
US - User Domain UEH - Global User Exit Details
WB - Web Domain XM - Transaction Manager Domain
XS - Security Domain
LCK - Lock Owner/Waiter Information
TRC - CICS Trace
NMT - MVS Name/Token Pairs
*** Bottom of data.
|
Figure 11-14 CICS System Information display
Error History
If you Select Option 2 in Figure 11-14, the Error History, all errors that have been found in the dump are displayed, as shown in Figure 11-15 on page 287.
If you would like to get detailed information for a specific entry, select the entry by using an S in the Err_Num column, as shown in Figure 11-15, to provide the error information, such as PSW, Registers, and much more, as shown in Figure 11-16 on page 288.
|
KE Error Table Summary Line 1 Col 1 80
Command ===> ________________________________________________ Scroll ===> HALF
SYSTEM=SCSCPAZ2 CODE=PI0001 ID=1/0001 SC54 2012/01/19 10:53:31
To review error data, tab to Err_Num and press Enter.
Err_Num Err_Time KE_NUM Error Type Err_Code Module Offset
S0000001 15:53:31 0028 PROGRAM CHECK 0C4/AKEA DFHPIWR 00002B54
*** Bottom of data.
|
Figure 11-15 Error Table Summary
|
KE Domain Error Data Line 1 Col 1 80
Command ===> Scroll ===> HALF
SYSTEM=SCSCPAZ2 CODE=PI0001 ID=1/0001 SC54 2012/01/19 10:53:31
Error Number: 00000001 Error Code: 0C4/AKEA Error Type: PROGRAM CHECK
Date (GMT): 2012/01/19 Time (GMT): 15:53:31
KE Error Data Address: 14C86E50 KE_NUM: 0028 TCA Addr: 153D6100 DS_TASK: 3
Error occurred in program DFHPIWR at offset 00002B54 under the CICS RB in bas
Execution key at Program Check/Abend: 8
Instruction Length: 6 Interrupt Code: 0010 Exception Address: 5722C000
Branch Event Address: 157EC206 Module DFHPIDML + X'EC206'
PSW: 078D1000 157EC14C Module DFHPIDML + X'EC14C'
CICS Registers:
R0: 00000108 1784 bytes of storage addressable
R1: 35380F90 65648 bytes of storage addressable
R2: 00000010 2032 bytes of storage addressable
R3: 157F1BC8 Module DFHPIDML + X'F1BC8'
R4: 00000001 2047 bytes of storage addressable
R5: 5722C050 Storage invalid
R6: 5722C050 Storage invalid
R7: 16E2BFD8 508563496 bytes of storage addressable
R8: 35380778 67720 bytes of storage addressable
R9: 00000015 2027 bytes of storage addressable
R10: 16A77BC0 512447552 bytes of storage addressable
R11: 16E28000 508579840 bytes of storage addressable
R12: 153D6100 Task 00032 User TCA + X'0'
R13: 35380990 KE STACK Entry, TranNum 00032. Module DFHPIWR + X'0'
R14: 957EBEFA Module DFHPIDML + X'EBEFA'
R15: 94B00400 Module DFHSIP + X'400'
|
Figure 11-16 PSW and Registers output
Obtain LE or trace information
If you would like to get LE or trace information for an entry shown in Figure 11-15 on page 287, you need the KE_NUM. The next panels show how to get debug information, in our case LE related, for KE_NUM 0028.
Select Option 1 in Figure 11-14 on page 286 and Figure 11-17 on page 289 is displayed, which shows KE_NUM 0028.
|
File View Services Help
-------------------------------------------------------------------------------
CICS Task Summary Line 1 Col 1 80
Command ===> Scroll ===> HALF
SYSTEM=SCSCPAZ2 CODE=PI0001 ID=1/0001 SC54 2012/01/19 10:53:31
To review task details, tab to KE_Num or Tran# and press Enter.
Initial Facility
KE_NUM Status Tran# Tran ID Program ID Error
000A Not Running 00030 CISE DFHISEMP n/a
000D Not Running 00033 CPIR DFHPIITL n/a
000F Not Running 00031 CISM DFHISRSP n/a
0011 Not Running 00006 CSSY DFHAPATT n/a
0014 Not Running 00004 CSOL DFHSOL n/a
0015 Not Running 00029 CISR DFHISRRP n/a
0017 Not Running 00007 CSSY DFHAPATT n/a
0018 Not Running 00005 CEPM DFHEPSY n/a
001C Not Running TCP CSTP DFHZCSTP n/a
S028 ***Running** 00032 CPIR DFHPIITL n/a *YES*
0029 Not Running 00027 CSHQ DFHSHSY n/a
0038 Not Running 00023 CSNC DFHCRNP n/a
*** Bottom of data.
|
Figure 11-17 Display of KEY_NUM 0028
Select this entry, KE_NUM 0028, as shown in Figure 11-17, and Figure 11-18 on page 290 is displayed.
|
CICS Task Detail Line 1 Col 1 80
Command ===> Scroll ===> HALF
SYSTEM=SCSCPAZ2 CODE=PI0001 ID=1/0001 SC54 2012/01/19 10:53:31
Tran Initial Facility
KE_NUM Status Number Tran ID Program Id In Error Userid
0028 ***Running** 00032 CPIR DFHPIITL n/a *YES* n/a
Attach Date/Time. .: 2012/01/19 15:53:31
Current program . .: DFHPIITL
AP Info Kernel Info Storage Info
UTCA : 153D6100 KE_TASK : 3537AA98 SMX : 152D4174
STCA : 153D6200 KE_KTCB : 14CD6FF8
EIB : 16A760D0
SEIB : 153D6514
EIS : 153D6408
EIUS : 16A76008
TWA : 00000000
XM Info DS Info Facility Info
TXN : 1530AB00 DS_TASK : 35307200 Type : n/a
TXD : 16C17AD0 Name : n/a
Address : n/a
PG Link Levels (includes channel information)
AP Link Levels
Language Environment is not active in this task
Trace Entries for this Task
Task Interface Elements
Last EXEC CICS Command
*** Bottom of data.
|
Figure 11-18 CICS Task Detail display
|
Note: As shown in Figure 11-18, Language Environment is not active in this task.
From a dump where it was active, see Figure 11-19 on page 291. By placing the cursor to that line and pressing Enter, you receive LE debug information as shown in Figure 11-19 on page 291. Using the CAA pointer you can get more debug information from the dump.
|
|
File View Services Help
------------------------------------------------------------------------------
Language Environment Information For Task 95978
SYSTEM=FD0ACIP3 CODE=4039 ID=4/0009 EGGD 2011/11/10 09:28:09
Link Level 2 (active at time of dump)
Program Name. . . . . . . . . . . . . . . . . . : SLOJRLP
PPTE Address. . . . . . . . . . . . . . . . . . : 19BFD088
Environment Type. . . . . . . . . . . . . . . . : EXEC
Common Anchor Area (CAA) Address. . . . . . . . : 1BC396E8
Region Control Block (RCB) Address. . . . . . . : 0010B3F0
Enclave Data Block (EDB) Address. . . . . . . . : 1BC374D8
Process Control Block (PCB) Address . . . . . . : 19713240
Options Control Block (OCB) Address . . . . . . : 1BC37BE0
LE Heap Analysis - ENSM Address . . . . . . . . : 1BC379A0
Storage Management Control Block (SMCB) Address : 1BC39F58
Thread Work Area (TWA) Address. . . . . . . . . : 19710478
Number Of Conditions (CIBs) . . . . . . . . . . : 1
Link Level 1
Program Name. . . . . . . . . . . . . . . . . . : EDQJR0P
PPTE Address. . . . . . . . . . . . . . . . . . : 19936920
Thread Work Area (TWA) Address. . . . . . . . . : 19710478
Number Of Conditions (CIBs) . . . . . . . . . . : 1
Link Level 1
Program Name. . . . . . . . . . . . . . . . . . : EDQJR0P
PPTE Address. . . . . . . . . . . . . . . . . . : 19936920
Environment Type. . . . . . . . . . . . . . . . : EXEC
Common Anchor Area (CAA) Address. . . . . . . . : 1BC043A8
Region Control Block (RCB) Address. . . . . . . : 0010B3F0
Enclave Data Block (EDB) Address. . . . . . . . : 1BC02198
Process Control Block (PCB) Address . . . . . . : 19713240
Options Control Block (OCB) Address . . . . . . : 1BC028A0
LE Heap Analysis - ENSM Address . . . . . . . . : 1BC02660
Storage Management Control Block (SMCB) Address : 1BC04C18
Thread Work Area (TWA) Address. . . . . . . . . : 19710478
Number Of Conditions (CIBs) . . . . . . . . . . : 0
*** Bottom of data.
|
Figure 11-19 LE debug output
4. Fault Analyzer options
Selecting option 4 from the CICS System Abend Interactive Reanalysis Report display results in the presentation of the Options in Effect display, of which an example is shown in Figure 11-20 on page 292.
|
SYSTEM=SCSCPAZ2 CODE=PI0001 ID=1/0001 SC54 2012/01/19 10:53:31
IBM Fault Analyzer Options in Effect:
{These are the options that were used to generate the current interactive
reanalysis report. To change any options, first return to the Fault Entry
List display and select "Interactive Reanalysis Options" from the "Options"
action-bar pull-down menu; then perform interactive reanalysis again.}
NoErrorHandler
FaultID(F01254)
Language(ENU)
NoLocale
NoPermitLangx
Data Sets:
{The following Fault Analyzer data set or path names were either
preallocated, specified via DataSets options, or provided as defaults.}
DDname Data Set or Path Name
IDIBOOKS IDI.SIDIBOOK
IDIDOC IDI.SIDIDOC1
IDIHIST WTSCPLX1.IDI.HIST
IDIMAPS IDI.SIDIMAPS
IDIVSENU WTSCPLX1.IDI.IDIVSENU
*** Bottom of data.
|
Figure 11-20 Fault Analyzer options
..................Content has been hidden....................
You can't read the all page of ebook, please click here login for view all page.