

IPCS tools and lab exercises
The interactive problem control system (IPCS) is a tool provided in MVS to aid in diagnosing software failures. IPCS provides formatting and analysis support for dumps and traces produced by MVS, other program products, and applications that run on MVS.
Dumps produced by MVS fall into two categories:
•Formatted dumps: SYSABEND and SYSUDUMP ABEND dumps and SNAP dumps. IPCS cannot be used with formatted dumps.
•Unformatted dumps: SVC dumps, SYSMDUMP ABEND dumps, and stand-alone dumps. IPCS formats and analyzes unformatted dumps.
When you submit unformatted dump data sets to IPCS, it simulates dynamic address translation (DAT) and other storage management functions to recreate the system environment at the time of the dump. IPCS reads the unformatted dump data and translates it into words. For example, IPCS can identify the following:
•Jobs with error return codes
•Resource contention in the system
•Control block overlays
•Processor usage
•IPL information
•Sysplex and I/O problems
The information here should guide you in how to use IPCS and get information from a dump. The dump can be downloaded.
A.1 IPCS lab exercise agenda
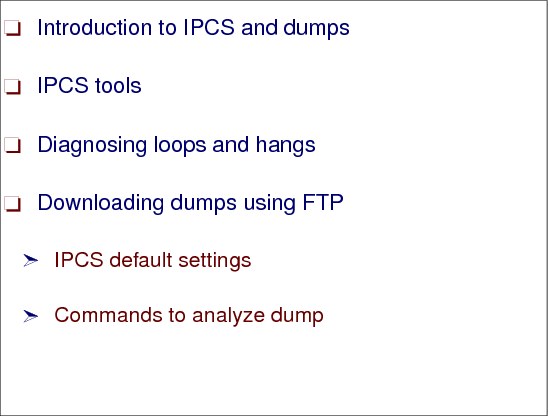
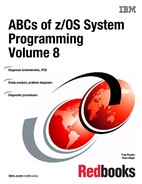
Figure A-1 IPCS and dump analysis
Introduction to IPCS and dumps
The following topics are described is this appendix:
•How the lab is presented
•How to get into IPCS and set up to view the first dump
•Other related sessions
IPCS commands
This appendix describes the use of the following IPCS commands:
•List Title/List SLIP trap
•Status worksheet
•Formatting the RTCT
•ST REGS
•SYSTRACE
•VERBX MTRACE
•Key fields in SUMMARY FORMAT
•ANALYZE RESOURCE
How to start with debugging
You can download the following dumps from the Redbooks site:
•Dump of a job using excessive processor time
•Dump of a hung TSO user
•Abend dumps (0C1, 0C4)
•Message slip dump
•Storage abend 878
•Dump of a hung job that is a contention problem
– Be warned there is a tremendous amount of material in this lab.
– The on-page title indicates exercises on that page.
– Each exercise details commands to be entered.
A flowchart available at the end of the presentation on diagnosing loops and hangs shows the methodology used to diagnose the dumps. Consider the following when using the dumps:
•Everybody develops their own method over time.
•Use them as a starting point in understanding how to look at dumps.
How to download dumps using FTP to locate the Web material
The Web material associated with this book is available in softcopy on the Internet from the IBM Redbooks Web server. The additional Web material that accompanies this book includes the following files:
File name Description
SG246988.zip Zipped DUMPs - (13 DUMPs)
|
Attention: The dump data sets you are going to download are in tersed format.
|
Point your Web browser to:
Alternatively, you can go to the IBM Redbooks Web site at:
Select Additional materials and open the directory that corresponds with the book form number, SG246988.
Text from the IBM Redbooks Web site
The directories on our FTP server contain additional materials such as code samples for specific Redbooks. If there is additional media, such as a diskette or CD-ROM included with the hardcopy book, it should be located in the directory with the same name as the IBM Redbooks form number (SG24xxxx). Just click the specific directory and you will find the text or binary files. Normally they are zipped to make file transfer faster and more reliable.
If your browser does not properly recognize the file extension, it may try to display the file rather than present a download window. If this happens, right click the file and select Save Link as or Save Target as, and your browser's normal download window will be presented.
Click here to get to the directory listing of additional materials to download.
(The save directory is one that you select.) The SG246988.zip file is now saved in a directory on your workstation.
How to use the downloaded material
Perform the following tasks:
1. Unzip the supplied SG246988.zip to a temporary directory. The dumps in this file are tersed.
The dump data set names are shown in Figure A-2.
|
Data sets Tracks
ITSO.ABCVOL8.AB0C4.TERSE
ITSO.ABCVOL8.ENQHANG.TERSE
ITSO.ABCVOL8.USERCPU.TERSE
ITSO.ABCVOL8.WAIT083.TERSE
ITSO.ABCVOL8.AB047.TERSE
ITSO.ABCVOL8.AB0C1.TERSE
ITSO.ABCVOL8.SECURUSS.TERSE
ITSO.ABCVOL8.AB878CSA.TERSE
ITSO.ABCVOL8.AB878.TERSE
ITSO.ABCVOL8.ABU4083.TERSE
|
Figure A-2 The dump data set names that are downloaded
2. Use the following commands, shown in Figure A-3 on page 297, from the PC to upload the dumps to your MVS system. In the following example, the c: emp directory is used. You need to specify where you saved the zip file if you did not use the c: emp directory.
|
cd c: emp
ftp ‘your MVS system IP address’
C: emp>ftp wtsc43.itso.ibm.com (our MVS system IP address)
Connected to wtsc43.itso.ibm.com.
220-FTP Server (user '[email protected]')
220 User (wtsc43.itso.ibm.com:(none)): ‘enter your MVS user ID
331 Send password please.
Password: ‘enter your password’
230-220-FTPMVS1 IBM FTP CS V1R7 at wtsc43.itso.ibm.com, 21:29:14 on 2007-02-26.
230-ROGERS is logged on. Working directory is "ROGERS.".
ftp> quote site blk=6144 lrecl=1024 recfm=fb tracks unit=sysallda primary=90
200 Site command was accepted
ftp> binary
200 Representation type is IMAGE.
ftp> put ITSO.ABCVOL8.AB0C4.TERSE
200 Port request OK.
125 Storing data set ITSO.
250 Transfer completed successfully.
ftp> quote site blk=6144 lrecl=1024 recfm=fb tracks unit=sysallda primary=xxx
ftp> put ITSO.ABCVOL8.AB0C4.TERSE
ftp> quote site blk=6144 lrecl=1024 recfm=fb tracks unit=sysallda primary=xxx
ftp> put ITSO.ABCVOL8.ENQHANG.TERSE
ftp> quote site blk=6144 lrecl=1024 recfm=fb tracks unit=sysallda primary=xxx
ftp> put ITSO.ABCVOL8.USERCPU.TERSE
ftp> quote site blk=6144 lrecl=1024 recfm=fb tracks unit=sysallda primary=xxx
ftp> put ITSO.ABCVOL8.WAIT083.TERSE
ftp> quote site blk=6144 lrecl=1024 recfm=fb tracks unit=sysallda primary=xxx
ftp> put ITSO.ABCVOL8.AB047.TERSE
ftp> quote site blk=6144 lrecl=1024 recfm=fb tracks unit=sysallda primary=xxx
ftp> put ITSO.ABCVOL8.AB0C1.TERSE
ftp> quote site blk=6144 lrecl=1024 recfm=fb tracks unit=sysallda primary=xxx
ftp> put ITSO.ABCVOL8.SECURUSS.TERSE
ftp> quote site blk=6144 lrecl=1024 recfm=fb tracks unit=sysallda primary=xxx
ftp> put ITSO.ABCVOL8.AB878CSA.TERSE
ftp> quote site blk=6144 lrecl=1024 recfm=fb tracks unit=sysallda primary=xxx
ftp> put ITSO.ABCVOL8.AB878.TERSE
ftp> quote site blk=6144 lrecl=1024 recfm=fb tracks unit=sysallda primary=xxx
ftp> put ITSO.ABCVOL8.ABU4083.TERSE
|
Figure A-3 Commands to FTP dumps to the MVS system
3. Once the dump data sets have been copied to the MVS system, they must be untersed. If you do not have the terse utility as part of your TSO environment, see the following note.
|
Note: Decompress all data sets using TRSMAIN, which can be downloaded from:
•ftp://ftp.software.ibm.com/s390/mvs/tools/packlib/
|
A.2 IPCS lab setup instructions
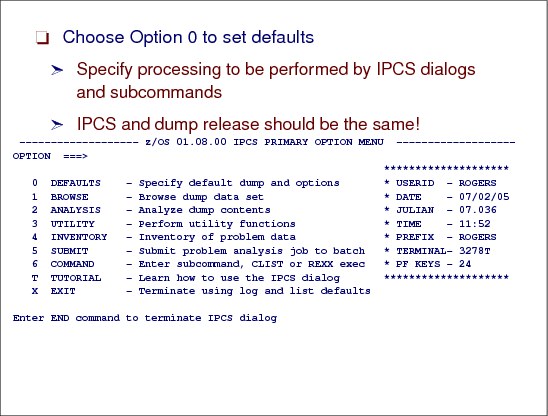
Figure A-4 IPCS PRIMARY OPTION MENU
IPCS primary options
At the IPCS primary options panel choose Option 0 for defaults, as shown in Figure A-4. When you press Enter, you receive the panel with the default settings. Add the dump data set name to the Source field to initialize the dump. Following are the IPCS default settings. Add your dump data set name and change Scope from local to both
Scope ==> LOCAL (LOCAL, GLOBAL, or BOTH)
Source ==> DSNAME('xxx.yyy.dump')
Address Space ==>
Message Routing ==> NOPRINT TERMINAL
Message Control ==> CONFIRM VERIFY FLAG(WARNING)
Display Content ==> NOMACHINE REMARK REQUEST NOSTORAGE SYMBOL
Press ENTER to update defaults.
Use the END command to exit without an update.
A.3 Commands to analyze dumps
Figure A-5 IPCS commands to analyze a dump
IP LIST TITLE
Use the IP LIST TITLE command to get a first guess as to what the dump represents. Look for the following kinds of information:
•System generated dumps typically have a COMPID= and other system-generated information, depending on the recovery routine that takes the dump.
•Console dumps have a title of whatever the user puts in COMM= as the dump title.
•Dumps taken as a result of a slip trap have a SLIP trap ID in them.
•Any program can issue an SDUMP macro and generate a title of its choosing. For IBM products a dump title directory can be found in Chapter 10 of z/OS MVS Diagnosis: Reference, GA22-7588.
The IP LIST TITLE command can be used to get the title of the dump, as follows:
IP LIST TITLE
TITLE
LIST 00000000 LITERAL LENGTH(X'58') CHARACTER
COMPON=BPX,COMPID=SCPX1,ISSUER=BPXMIPCE,MODULE=BPXFSCLS+16D6,ABEND=S00C4,REASON=00000004
Lab exercise #1
Analyzing a SLIP trap dump.
|
Lab exercise #1:
•Enter IPCS.
•Specify the dump by typing =0 (zero) on the IPCS command line.
•Change the DSNAME to ITSO.ABCVOL8.AB0C4.
•Press Enter and proceed back to IPCS Option 6 (commands) by typing =6 on the command line. Proceed with the exercise.
•If you would like to browse storage select =1 and press Enter twice.
•The Problem: Diagnose a SLIP trap dump.
|
Diagnosing the dump
Use the IPCS commands LIST TITLE and LIST SLIPTRAP to determine the type of dump being analyzed.
|
Questions:
1. Use the IP LIST TITLE command if you have reason to believe that a slip trap was used to produce the dump and you want to know what was set. _________________
If a SLIP trap was used you will see the following type of output:
TITLE
LIST 00. LITERAL LENGTH(X'11') CHARACTER
00000000 ! SLIP DUMP ID=PHIL
2. Based on the title of the dump you can make a guess as to what type of dump this is. Choose one of the following by putting a circle around it:
– STANDALONE DUMP
– A CONSOLE DUMP
– SLIP TRAP GENERATED DUMP
– PROGRAM GENERATED DUMP
3. The IP LIST SLIPTRAP command can be used to show the SLIP trap used to obtain any dump, if a SLIP trap was used.
– Was a SLIP trap used? YES / NO (circle one)
– If a SLIP trap was used what was it? ____________________________________
Answers to questions: See Appendix A.14, “LIST TITLE and LIST SLIPTRAP - Answers” on page 330.
|
IP ST Worksheet
This command displays the MVS Diagnostic Worksheet. During the initial use, it is possible you may have to reply Y to get the displayed information the first time you use this command.
Issue the command to determine the useful information available in the dump. You can shorten the command and enter IP ST W. Figure A-6 shows the information that is displayed, for example.
|
•Dump title
– Temptable: COMPON=BPX,COMPID=SCPX1,ISSUER=BPXMIPCE,....
•Date and time dump was taken:
– Date: 01/10/2002 Time: 21:23:40.675321 Local
•Original dump data set name (can be useful for reference with Systoles):
– Original dump data set: SYS0.DUMPSA6F.S00447
•System name (useful verification tool if more than one system exists)
– CVT SNAME (154) SA6F
•For SVCDUMPS the PSW and ASIDs in control at the time of the dump:
– HASID 0006 PASID 0006 SASID 0006 PSW 070C1000 82467428
•Number of CPUs and their numbers, which is useful for looking for loops:
– Alive CPU mask: C000 No. of active CPUs: 0002
• The mask shows CPU numbers 0-16 thus C=1100... or CPU0 and CPU1
|
Figure A-6 Display of initial information in the MVS Diagnostic Worksheet
|
MVS Diagnostic Worksheet
Dump Title: ECB WAIT
CPU Model 9672 Version 84 Serial no. 220A83 Address 02
Date: 07/22/2002 Time: 13:41:19.105252 Local
Original dump dataset: JJ.DUMP.PS01.D020722.T133948.S00007
Information at time of entry to SVCDUMP:
HASID 0089 PASID 0089 SASID 0089 PSW 070C1000 8BE3F9CC
CML ASCB address 00000000 Trace Table Control Header address 7F742000
Dump ID: 007
Error ID: N/A
SDWA address N/A
SYSTEM RELATED DATA
CVT SNAME (154) PS01 VERID (-18)
CUCB (64) 00FD00B0 PVTP (164) 00FF3548 GDA (230) 021C01A0
RTMCT (23C) 00F47448 ASMVT (2C0) 00FD6390 RCEP (490) 0167E468
CSD Available CPU mask: C000 Alive CPU mask: C000 No. of active CPUs: 0002
|
Figure A-7 IP ST WORKSHEET command example results
Questions: Using the IP ST WORKSHEET command, answer the following questions. Refer to the previous page for information about what this information looks like in the output.
1. What is the dump title? ______________________
2. Does this agree with the list title output you saw before? ____
3. How many CPs are online in this dump? _____
4. What is the original dump data set name? ________________________________________________
5. When was the dump taken? ____________________
6. What was the name of the system this dump was taken on? _____________________
7. What was the primary address space (PASID) in control at the time of the dump? It is important to know this due to we can only run our instructions in the primary address space. __________
8. When was the last IPL done? IP IPLDATA _____________
9. The IP SELECT ALL command provides a list of all the ASID numbers and the jobnames associated with them. Use this command to determine what the jobname is for the PASID found above _________________
Answers to questions: See Appendix A.15, “IP ST WORKSHEET - Answers” on page 330.
A.4 The RTCT control block
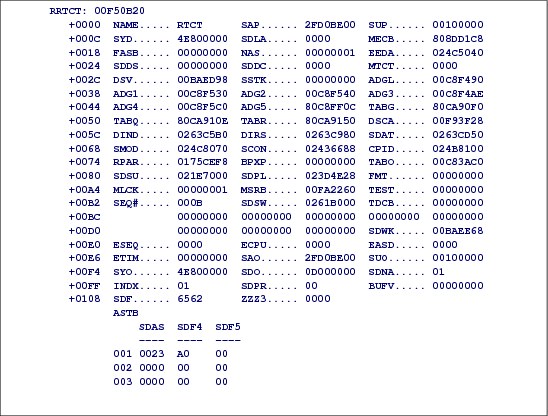
Figure A-8 RTCT control block example (top part)
RTCT control block
The recovery termination control table (RTCT) contains information about what can be expected to be found in the dump. The RTCT provides a communication area between the various functions associated with dumping facilities, for SYSABEND, SYSMDUMP, SYSUDUMP, and SVC dumps. It is used for coordination of the dump-related processes of task and system recovery, the memory termination controller, installation- and operator-defined dump requirements.
IP CBF command
The IP CBF RTCT command shows what ASIDs were requested under the SDAS heading, as shown in Figure A-8.
The IP CBF RTCT+9C? STR(SDUMP) VIEW(FLAGS) command shows what options were requested. This may be important to verify that the storage required to diagnose a problem was requested. Of the flags formatted, the most useful often is the SDUSDATA flag. For example, the output below would indicate that nucleus modules and LPA modules loaded at the time of the dump should be viewable.
|
SDUMP_PL: 00F40458
==> FLAGS SET IN SDUFLAG0:
DCB specified.
Dump 4K buffer.
HDR/HDRADR specified.
ECB specified.
BRANCH=YES specified.
==> FLAGS SET IN SDUFLAG1:
SVC dump request.
SYSMDUMP request.
TSO user extension is present.
48+ byte parameter list.
==> FLAGS SET IN SDUSDATA:
Dump all PSAs.
Dump current PSA.
Dump LPA mod. for RGN.
Dump trace data.
Dump CSA.
Dump SWA.
Dump summary dump data.
Dump all nucleus.
Dump all defaults.
|
Figure A-9 IP CBF RTCT+9C? STR(SDUMP) VIEW(FLAGS) command results
Questions: The IP CBF RTCT command formats the RTCT control block, which gives information such as what ASIDs where dumped (use the SDAS field).
1. Use the CBF RTCT command to find the ASID(s) included in this dump and list them here (you can see an example of what the output may look like in Figure A-8 on page 303). ______________________
Additionally, the RTCT contains information about what SDATA options were used. To format this information, use the IP CBF RTCT+9C? STR(SDUMP) VIEW(FLAGS) command. Try this command and determine:
2. Was LSQA requested on the dump? YES/NO (circle one).
3. Was RGN requested (shown as RGN-Private)? YES/NO (circle one).
The output will also indicate whether certain component exits receive control or not in the SDUEXIT flag.
4. Look at these flags to determine if GRSQ was specified. YES/NO (circle one).
Answers to questions: See Appendix A.16, “Using the RTCT control block - Answers” on page 330.
A.5 The IP ST REGS command

Figure A-10 IP ST REGS command example
The IP ST REGS command
This command indicates what the registers were at the time of the dump for the following kinds of dumps:
•For SLIP dumps - REGS at the time SLIP matched.
•For console dumps - typically all zeros.
•For abend dumps - they are theoretically the REGS at the time of the abend.
•For standalone dumps - use the IP CPU REGS command to get the REGS from each CPU.
ST REGS example
These examples simply skim the surface of the wealth of technical information available with the IP ST REGS output. See the example shown in Figure A-10.
The sample output in Figure A-10 shows that the address in the PSW is X'07850000 00000000 00000000 00007026', the ASID is X'0020', and an abend occurred (ABEND0C4+26 IN PRIVATE). You could also use the information about the registers to find out more about the error if the address in the PSW does not point to the failing instruction.
If the calling program is in AR mode, all addresses that it passes, whether they are in a GPR or in a parameter list, must be ALET-qualified. A parameter list can be in an address space other than the calling program's primary address space or in a data space, but it cannot be in the calling program's secondary address space.
|
Note: You can use the IP ST FAILDATA command instead as it formats the SDWA if it is present. Generally it will give you a better overall picture but it may not always be there and may not be the same as IP ST REGS due to recovery actions. In AR mode, as is the case here, the General Purpose Registers will be qualified by the access registers (ARs). So to look at the storage pointed to by a GPR, you need to also determine what address space it refers to. An AR value of 00000000 means the Primary ASID; 00000001 means secondary ASI, and 00000002 means home ASID. For example, in this dump the value in R9 = 15756F00 would be browsed in ASID(x'105'). To check in which mode we are running you can also have a look at PSW bits 16 and 17 ASC mode (Address Space Control).
|
Information from IP ST REGS
The following questions can all be answered with the IP ST REGS command.
Questions:
1. What ABEND did we get? ____
2. To get the exception information enter IP SYSTRACE and do a find for *RCVY. PGM preceding tis entry will show the pic value too. _______
3. Have a look at the MVS System Codes manual to get the exception information.
4. Enter IP ST W or IP ST REGS again. What was the failing PSW address? _________
5. What ASID is this failing code executing in? _________
6. What was the failing TCB address? ________
Now using the address portion of the PSW, you want to get more information about the module that was running. You also want to browse some of the register storage. Use IPCS browse, IPCS Option 1, as shown in Figure A-4 on page 298.
7. When you browse the PSW address and back up with PF7, what eyecatcher do you see? The first instruction preceding the eyecatcher is a 47F0C01C _________
8. Browsing the code 4 bytes before the PSW can you determine the reason for the ABEND0C4? The failing instruction is a STH (Store Halfword) If you are not so familiar with opcodes, you can use IP OPCODE command. In our case IP OPCODE 40404040 Which register do we use to execute the instruction? _____________________
9. ABEND0C4 pic 4 leads to accessing the page pointed to by register 4 using a wrong key. What key does our PSW show? ____________
10. Each storage is getmained using a key. To get the key from the page pointed to by register 4 enter the IP RSMDATA VIRTPAGE RANGE(7D1000). Does the key match with the one in PSW? _____
Answers to questions: See Appendix A.17, “Information from IP ST REGS - Answers” on page 331.
A.6 Browsing storage

Figure A-11 Browsing storage example
Browsing storage using IPCS Option 1 (Browse)
To browse storage, on the IPCS primary panel, shown in Figure A-4 on page 298, select Option 1 or use =1 on any IPCS command line to obtain the panel shown in Figure A-12 on page 308. Fill in the dump data set name and the source and when you press Enter, the top portion of the panel shown in Figure A-11 on page 307 is displayed. The bottom appears after the following in Figure A-11:
S0001 00000000 ASID(X'0020')
Browsing storage
According to the PSW at the time of the error you found in your IP ST REGS or IP ST W output, you need now to browse the storage in the correct address space shown in Figure A-10 on page 305.
|
------------------------- IPCS - ENTRY PANEL ---------------------------------
CURRENT DEFAULTS:
Source ==> DSNAME('ITSO.ABCVOL8.AB0C4')
Address space ==> ASID(X'0020')
OVERRIDE DEFAULTS: (defaults used for blank fields)
Source ==> DSNAME('ITSO.ABCVOL8.AB0C4')
Address space ==> ASID(X'0020')
Password ==>
POINTER:
Address ==> (blank to display pointer stack)
Remark ==> (optional text)
|
Figure A-12 IPCS panel to enter dump defaults
Browsing storage
Next, press Enter on the panel in Figure A-13 and Figure A-14 is displayed.
|
DSNAME('ITSO.ABCVOL8.AB0C4') POINTERS ----------------------------------------
Command ===> SCROLL ===> HALF
ASID(X'0020') is the default address space
PTR Address Address space Data type
S0001 00. ASID(X'0020') AREA
Remarks:
**************************** END OF POINTER STACK *****************************
|
Figure A-13 Panel displayed after an Enter on the previous panel
Select storage location
Use the S line command, as shown in Figure A-13, to choose a pointer from the address pointer stack on the pointer panel. It is possible to check storage from other address spaces which have been dumped and data spaces. IPCS then uses the pointer to display storage that is addressed by that pointer. The storage is then displayed is shown in Figure A-14. Notice that the storage selected in the example is at location 00000000.
|
ASID(X'0020') ADDRESS(00.) STORAGE --------------------------------------------
Command ===> SCROLL ===> HALF
00000000 000A0000 000130E1 00000000 00000000 | ................ |
00000010 00FDCA48 00000000 7FFFF000 7FFFF000 | ........".0.".0. |
00000020 7FFFF000 7FFFF000 7FFFF000 7FFFF000 | ".0.".0.".0.".0. |
00000030 00000000 00000000 7FFFF000 7FFFF000 | ........".0.".0. |
00000040 00000000 00000000 00000000 00FDCA48 | ................ |
00000050 00000000 00000000 000A0000 000140E1 | .............. . |
00000060 000A0000 000150E1 000A0000 000160E1 | ......&.......-. |
|
Figure A-14 Storage displayed when issuing the S command
Browse the PSW address
To browse the PSW address, issue the IP ST REGS command to obtain the PSW address, as shown in Figure A-15.
|
CPU STATUS:
PSW=07850000 00000000 00000000 00007026
(Running in PRIMARY, key 8, AMODE 24, DAT ON)
Disabled for PER
ASID(X'0020') 7026. AREA(Subpool251Key08)+26 IN PRIVATE
ASID(X'0020') 7026. ABEND0C4+26 IN PRIVATE
ASID(X'0020') 7026. AREA(Jobphilger1)+5026 IN PRIVATE
ASID(X'0020') 7026. AREA(Error)+5026 IN PRIVATE
ASID(X'0020') 7026. AREA(Current)+5026 IN PRIVATE
ASCB32 at FCAE80, JOB(PHILGER1), for the home ASID
ASXB32 at 7FDB60 and TCB32E at 7FF3A0 for the home ASID
HOME ASID: 0020 PRIMARY ASID: 0020 SECONDARY ASID: 0020
|
Questions:
1. What ABEND did we get? ____
2. To get the exception information, enter IP SYSTRACE and do a find for *RCVY. PGM preceding this entry will show the pic value too. _______
3. Have a look at the MVS System Codes manual to get the exception information.
4. Enter IP ST W or IP ST REGS again. What was the failing PSW address? _________
5. What ASID is this failing code executing in? _________
6. What was the failing TCB address? ________
Now using the address portion of the PSW, you want to get more information about the module that was running. You also want to browse some of the register storage. Use IPCS browse, IPCS Option 1, as shown in Figure A-4 on page 298.
7. When you browse the PSW address and back up with PF7, what eyecatcher do you see? The first instruction preceding the eyecatcher is a 47F0C01C _________
8. Browsing the code 4 bytes before the PSW, can you determine the reason for the ABEND0C4? The failing instruction is an STH (Store Halfword). If you are not so familiar with opcodes, you can use the IP OPCODE command; in our case, IP OPCODE 40404040. Which register do we use to execute the instruction? _____________________
9. ABEND0C4 pic 4 leads to accessing the page pointed to by register 4 using a wrong key. What key does our PSW show? ____________
10. Each storage is getmained using a key. To get the key from the page pointed to by register 4 enter the IP RSMDATA VIRTPAGE RANGE(7D1000). Does the key match the one in the PSW? _____
Answers to questions: See Appendix A.17, “Information from IP ST REGS - Answers” on page 331. essing enter.
|
ASID(X'0020') ADDRESS(7026.) STORAGE ------------------------------------------
Command ===> SCROLL ===> CSR
00007026 4040 404058F0 C02E50F0 ! .0ä.&0 !
00007030 C03605EF 70000000 7F000000 00000000 ! ä......."....... !
00007040.:7FFF.--All bytes contain X'00'
|
Figure A-15 Browse PSW storage
The preceding failing instruction could be 2, 4 or 6 bytes. The IP OPCODE command will translate the op code to a mnemonic, as follows:
IP OPCODE 40404040
Mnemonic for X'40404040' is STH
STH (Store Halfword)
To get the failing instruction or module name, press PF7 until you find a module start area. There may be modules where the names are not shown at the beginning of the module, such as (LE, JES).
|
00007000 90ECD00C 05C047F0 C01CC1C2 F0C3F440 ! ..ü..ä.0ä.AB0C4 !
00007010 4040F1F1 61F1F061 F1F14040 40404040 ! 11/10/11 !
00007020 40404040 40404040 404058F0 C02E50F0 ! .0ä.&0 !
00007030 C03605EF 70000000 7F000000 00000000 ! ä......."....... !
|
Figure A-16 Browse module name and failing instruction
A.7 IPCS VERBX LOGDATA subcommand

Figure A-17 The IP VREBX LOGDATA subcommand
IPCS VERBX LOGDATA subcommand
IPCS formats the software error records. You can use the IPCS VERBEXIT LOGDATA subcommand to format and print or view the logrec data set records in a dump. For more information about the subcommand, see z/OS MVS Interactive Problem Control System (IPCS) Commands, SA22-7594.
If a problem occurs and a dump is available, the IP VERBX LOGDATA subcommand will show preceding abends from hardware, as shown in Figure A-18 on page 312 and software, as shown in Figure A-19 on page 313.
It could be important due to the fact that the dump you are looking at may not show the root cause of the problem. If there are abends shown in the same address space where you get an abend, you need to take care of them. If there are abend entries showing the same time, even if they are not reflecting the same address space, check them also.
|
DEVICE NUMBER: 06002 REPORT: SLH EDIT DAY YEAR JOB IDENTITY: *MASTER*
SCP: VS 2 REL. 3 DATE: 216 11 5CD4C1E2E3C5D95C
DEVICE NED: 002107.900.IBM.75.0000000PD021.0002
DEVICE TYPE: 3390
CPU MODEL: 2817XA HH MM SS.TH
CHANNEL PATH ID: 48 LOGICAL CPU ID: 0157B6 TIME: 12 28 32.44
PHYSICAL CHAN ID: 05D0 PHYSICAL CPU ADDRESS: 02
CC CA FL CT
FAILING CCW 00 00000000 00 0000 VOLUME SERIAL SYSX12
SUBCHANNEL ID NUMBER 00011082
K FLAGS CA US SS CT ERROR TYPE OTHER
SCSW 04 824017 00000008 00 02 0000
|
Figure A-18 Hardware entry (partial output)
Software error entry
The detail edit report for a software record, shown in Figure A-19 on page 313, shows the complete contents of an error record for an abnormal end, including the system diagnostic work area (SDWA). The report is produced by EREP and, through the VERBEXIT LOGDATA subcommand, under IPCS.
You can use the detail edit report for a software record to determine the cause of an abend, and the recovery action that the system or application has either taken or not taken. This report enables you to locate where an error occurred, similar to the analysis of an SVC dump. Once you locate the error, you can develop a search argument to obtain a fix for the problem.
|
Reference: See Environmental Record Editing and Printing Program (EREP) User’s Guide, GC35-0151 for information about producing a detail edit report for an SDWA-type record.
Also see z/OS MVS Interactive Problem Control System (IPCS) Commands, SA22-7594 for information about the VERBEXIT LOGDATA subcommand.
|
|
TYPE: SOFTWARE RECORD REPORT: SOFTWARE EDIT REPORT DAY.YEAR
(SVC 13) REPORT DATE: 315.11
FORMATTED BY: IEAVTFDE HBB7703 ERROR DATE: 311.11
MODEL: 2094 HH:MM:SS.T
SERIAL: 06991E TIME: 23:58:49.6
JOBNAME: INIT SYSTEM NAME: SC64
ERRORID: SEQ=00377 CPU=0000 ASID=0020 TIME=23:58:49.6
SEARCH ARGUMENT ABSTRACT
PIDS/5752SC1B6 RIDS/IEFSD060#L RIDS/IEFSD060 AB/S0822 PRCS/00000014 REGS/0C4
RIDS/IEFIB620#R
SYMPTOM DESCRIPTION
------- -----------
PIDS/5752SC1B6 PROGRAM ID: 5752SC1B6
RIDS/IEFSD060#L LOAD MODULE NAME: IEFSD060
RIDS/IEFSD060 CSECT NAME: IEFSD060
AB/S0822 SYSTEM ABEND CODE: 0822
PRCS/00000014 ABEND REASON CODE: 00000014
PRCS/00000014 ABEND REASON CODE: 00000014
REGS/0C458 REGISTER/PSW DIFFERENCE FOR R0C: 458
RIDS/IEFIB620#R RECOVERY ROUTINE CSECT NAME: IEFIB620
OTHER SERVICEABILITY INFORMATION
RECOVERY ROUTINE LABEL: IEFIB620
DATE ASSEMBLED: 11070
MODULE LEVEL: HBB7780
SUBFUNCTION: INITIATOR JOB PROCESS
TIME OF ERROR INFORMATION
PSW: 07041000 80000000 00000000 0759F47A
INSTRUCTION LENGTH: 02 INTERRUPT CODE: 000D
FAILING INSTRUCTION TEXT: 00181610 0A0D5850 40005870
BREAKING EVENT ADDRESS: 00000000_00000000
AR/GR 0-1 007FF130/00000001_04000000 00000000/00000000_04822000
AR/GR 2-3 00000000/00000000_00000010 00000000/00000000_007D19E0
AR/GR 4-5 00000000/00000000_007D19B0 00000000/00000000_007FF130
AR/GR 6-7 00000000/00000000_007FC594 00000000/00000000_FD000000
AR/GR 8-9 00000000/00000000_007FCAC8 00000000/00000000_00000014
AR/GR 10-11 00000000/00000000_007FC204 00000000/00000000_007CD1B8
AR/GR 12-13 00000000/00000000_8759F022 00000000/00000000_007D1A18
AR/GR 14-15 00000000/00000000_007CD1B8 01000002/00000000_00000014
HOME ASID: 0020 PRIMARY ASID: 0020 SECONDARY ASID: 0020
PKM: 8040 AX: 0000 EAX: 0000
|
Figure A-19 Software error entry (partial output)
A.8 IPCS SYSTRACE subcommand

Figure A-20 SYSTRACE subcommand parameters
System trace
System trace writes trace data in system trace tables in the trace address space. System trace maintains a trace table for each processor. Obtain the trace data in a dump that included option SDATA=TRT.
SYSTRACE subcommand
Use the SYSTRACE subcommand to format system trace entries for all address spaces. This command is used to determine what else was happening in the system at the time of the dump.
•Options:
– IP SYSTRACE ALL - formats all active ASIDS at time of dump
– IP SYSTRACE TIME(LOCAL) - converts the time to local time (readable)
– IP SYSTRACE ASID(x'nn') - formats only trace records associated with the requested ASID
•If a WAIT entry is found in SYSTRACE, the system is not running 100% CPU.
•EXT 1005 entries for the same ASID may be indicative of a loop.
•The command only traces traceable events, for example, SVCs or PCs.
Chapter 8 of z/OS MVS Diagnosis: Tools and Service Aids, GA22-7589 has lots of details about system trace.
|
Note: For formatted dumps, system trace formats the system trace data and the system prints it directly.
For unformatted dumps, use the IPCS SYSTRACE subcommand to format and print or view the trace data in the dump.
|
SYSTRACE definitions
Figure A-21 shows the beginning columns of the system trace (SYSTRACE), shown in bold text. An SSRV trace entry represents entry to a system service. The service can be entered by a PC instruction or a branch.
|
Note: For every entry in the trace there are different mappings for the entry. Figure A-21 is only an example of what an entry can contain.
|
|
PR ASID WU-ADDR- IDENT CD/D PSW----- ADDRESS- UNIQUE-1 UNIQUE-2 UNIQUE-3
UNIQUE-4/UNIQUE-5/UNIQUE-6
01-0001 00000000 WAIT
01-0028 01F5F200 SRB 070C0000 80FE1CD8 00000028 062817AC 86281780
007FF510 00
01-0028 00000000 SSRV 78 80FE1E58 4060E552 00000058 007BEFA8
00280000
01-0028 00000000 SSRV 78 80FE1E78 0000FD02 00000098 007F0780
00280000
|
Figure A-21 First columns of the system trace
The remainder of the system trace columns are in Figure A-22.
|
PSACLHS- PSALOCAL PASD SASD TIMESTAMP-RECORD CP
PSACLHSE
BF65FF0E4BA5E728 28
00 0028 0028 BF65FF0E4EA51F68 28
Getmain BF65FF0E4EA58DE8 28
Getmain BF65FF0E4EA5A3E8 28
|
Figure A-22 Remaining columns of the system trace
The columns are as follows:
PR pr: Identifier of the processor that produced the TTE.
ASID home: Home address space identifier (ASID) associated with the TTE.
WU-ADDR wu-addr: Address of the task control block (TCB) for the current task or the work element block (WEB).
IDENT The TTE identifier, as follows:
•DSP - Task dispatch
•SRB - Initial service request dispatch
•SSRB - Suspended service request dispatch
•WAIT - Wait task dispatch
CD/D ssid
PSW-address Address of the PSW:
•dsp-new- psw: Program status word (PSW) to be dispatched
•srb-new- psw: PSW to receive control on the SRB dispatch
•ssrb-new- psw: PSW to receive control on the SSRB redispatch
UNIQUE-1-6 (6 values as follows:)
•gpr0----: General register 0
•gpr1----: General register 1
•psamodew: PSAMODEW field in the PSA
•safnasid: LCCASAFN field in the logical configuration communication area (LCCA) and the related ASID
•flg-srb: SRBFLGS field from the SRB
•purgetcb: TCB (located in address space of the scheduler of the SRB) that gets control if the SRB abends and percolates
PSACLHS One of the following:
•psaclhs-: String for the current lock held, from the PSACLHS field of the PSA.
•psaclhs4: PSACLHS4 field of the PSA
•srbhlhi-: SRBHLHI field in the SRB
This field contains descriptive text for some SVC, SSRV, and PC trace entries. The descriptive text does not appear in SNAP, SYSUDUMP, or SYSABEND output.
PSALOCAL psalocal: Locally locked address space indicator, from the PSALOCAL field of the PSA. This field will contain descriptive text for some SVC, SSRV, and PC trace entries. The descriptive text will not appear in SNAP, SYSUDUMP, or SYSABEND output.
PASD cpsd: Primary ASID (PASID) at trace entry. This field will contain descriptive text for some SVC, SSRV, and PC trace entries. The descriptive text will not appear in SNAP, SYSUDUMP, or SYSABEND output.
SASD sasd: Secondary ASID (SASID) at trace entry. This field will contain descriptive text for some SVC, SSRV, and PC trace entries. The descriptive text will not appear in SNAP, SYSUDUMP, or SYSABEND output.
TIMESTAMP timestamp-------: Time-of-day (TOD) clock value when system trace created the trace entry. The value is in the same format as the time stamp on logrec data set records.
CP The CP column contains 2 hex digits of the processor model-dependent information, which is intended to identify the physical CP that made the trace entry. CP is only provided when formatting SYSTRACE under IPCS. CP is not provided for SYSUDUMP, SYSABEND, or SNAP.
Questions:
1. By using IP SYSTRACE ASID(X’20’) TIME(LOCAL) and looking in the output for the PGM 004 entry, when did the abend occur? __________________
2. Does the time match with our IP ST W output?______
3. Do we call RTM (Recovery Termination Manager)? Look for *RCVY ____
4. Is there a FRR (Functional Recovery Routine) between *RCVY and *SVC? ___
5. Which module requested *SVC D to give control to RTM2? Browse the PSW from this entry in our address space storage. To get the module name you can either enter IP W X or IP W 14601C2. W is the short form for WHERE and X can be used when you did a locate PSW address before. ______________
6. What is the TCB that got the abend? ___________
7. What CPU number is shown? ___
8. Are we running in cross memory mode? See PASD SASD. If they show different address space numbers we are running in cross memory mode. ____
Answers to questions: See Appendix A.18, “IP SYSTRACE - Answers” on page 332.
A.9 IPCS VERBX MTRACE subcommand
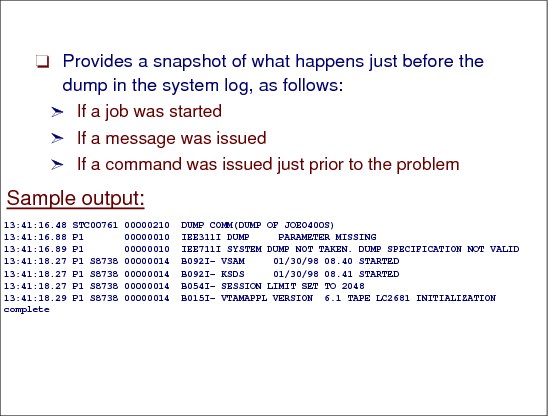
Figure A-23 VERBX MTRACE subcommand
VERBX MTRACE subcommand
This command displays the following:
•The master trace table entries for the dumped system. This table is a wraparound data area that holds the most recently issued console messages in a first-in, first-out order.
•The NIP hard-copy message buffer.
•The branch entry and NIP time messages on the delayed issue queue.
This trace gives you a snapshot of what is taking place just before the dump in the system log and is useful to see if a job was started, a message was issued or a command was issued just prior to the problem.
In the example, shown in Figure A-24 on page 319, the operator apparently was trying to capture a console dump and entered DUMP COMM(DUMP OF JOE0400S) instead of the correct syntax, which would have been DUMP COMM=(DUMP OF JOE0400S). Note also that this is a JES2 log. A JES3 log looks quite different.
|
13:41:16.48 STC00761 00000210 DUMP COMM(DUMP OF JOEO400S)
13:41:16.88 P1 00000010 IEE311I DUMP PARAMETER MISSING
13:41:16.89 P1 00000010 IEE711I SYSTEM DUMP NOT TAKEN. DUMP SPECIFICATION NOT VALID
13:41:18.27 P1 S8738 00000014 B092I- VSAM 01/30/98 08.40 STARTED
13:41:18.27 P1 S8738 00000014 B092I- KSDS 01/30/98 08.41 STARTED
13:41:18.27 P1 S8738 00000014 B054I- SESSION LIMIT SET TO 2048
13:41:18.29 P1 S8738 00000014 B015I- VTAMAPPL VERSION 6.1 TAPE LC2681 INITIALIZATION complete
|
Figure A-24 Sample MTRACE output
Questions:
1. Have a look at the IP VEBX MTRACE output. Are other abends reported? _____
2. Have dumps been taken? _____
3. Did we use slip processing? _________
4. User PHILGER submitted a job. Which step ended with an abend indication? Check for message IEF450I. ______
Answers to questions: See Appendix A.19, “IP VERBX MTRACE - Answers” on page 332.
A.10 IP SUMMARY FORMAT subcommand
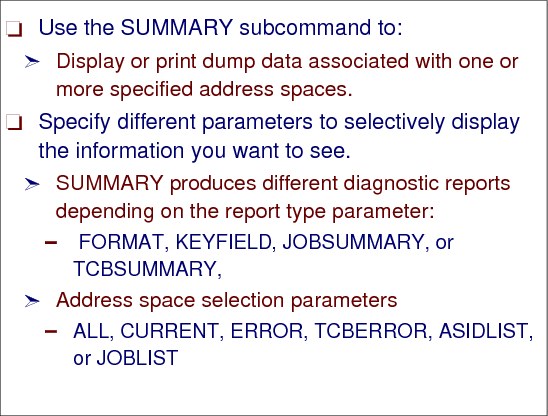
Figure A-25 SUMMARY subcommand and parameters
The SUMMARY subcommand
Use the SUMMARY subcommand to display or print dump data associated with one or more specified address spaces.
SUMMARY produces different diagnostic reports depending on the report type parameter, FORMAT, KEYFIELD, JOBSUMMARY, and TCBSUMMARY, and the address space selection parameters, ALL, CURRENT, ERROR, TCBERROR, ASIDLIST, and JOBLIST. Specify parameters to selectively display the information you want to see.
|
Question information: The IP SUMM FORMAT ASID(x’nn’) command will format lots of data about the specified address space. In this lab you are interested in the following control blocks and fields: failing TCB and CMP fields, RTM2 work area and RBs.
failing TCB At the end of the output all TCBs are named including the CMP field.
RTM2 WA Any time you see an RTM2 work area for a TCB, it means the error could not be recovered. RTM2 will show time of error information.
PRB,SVRB Request blocks which show the abend sequence.
|
The IP SUMMARY FORMAT ASID(x’20’) command provides the control block flow starting with the main address space control block ASCB. ASXB, ASSB followed by TCBs and RBs.
|
ASCB: 00FCAE80
+0000 ASCB..... ASCB FWDP..... 00FCAB80 BWDP..... 00FB8000
+000C LTCS..... 00000000 R010..... 00000000 00000000
+0018 IOSP..... 00000000 R01C..... 0000 WQID..... 0000
+0020 R020..... 00000000 ASID..... 0020 R026..... 00
+0027 SRMF..... 00 LL5...... 00 HLHI..... 01
+002A DPH...... 00F0 TCBE..... 00000000 LDA...... 7FF16E10
|
Figure A-26 Partial ASCB output
Figure A-27 is the result of issuing the command to get to the bottom (BOTTOM command and press F8).
|
Note: The TCB summary at the end of the output will show two TCBs’ CMP fields nonzero. As mentioned before, if an RTM2 WA is provided, we need to have a look at this abend. If no RTMWA is available, the error was recovered.
|
|
JOB PHILGER1 ASID 0020 ASCB 00FCAE80 FWDP 00FCAB80 BWDP 00FB8000 PAGE
00000006
TCB AT CMP NTC OTC LTC TCB BACK PAGE
007FE040 00000000 00000000 00000000 007FF890 007FD0C0 00000000 00000056
007FD0C0 00000000 00000000 007FE040 00000000 007FF890 007FE040 00000061
007FF890 00000000 007FD0C0 007FE040 007FF130 007FF130 007FD0C0 00000066
007FF130 04822000 00000000 007FF890 007FF3A0 007FF3A0 007FF890 00000073
007FF3A0 940C4000 00000000 007FF130 00000000 00000000 007FF130 00000083
|
Figure A-27 IP SUMM FORMAT command
SUMM FORMAT subcommand questions
Questions:
1. Use the IP SUMM FORMAT ASID(X'20') command to determine what TCBs have a nonzero CMP field. You may have a look at the z/OS V1R13.0 MVS System Codes manual to get the error explanation ________
2. Look at the control block flow from our TCB getting the ABEND0C4 error. Do a find for RTM2 and locate the SEQ#. If you have more than one RTM2 WA, you can use this information to determine which RTM was the first one we got. The one with the lowest number shows the first error. What does it show? ____
3. Have a look at RTM”WA SUMMARY. Do the PSW and registers match with our abend information in IP ST REGS? ____
4. Check the PRB. Which module is pointed to by OPSW? _________
5. The registers that belong to this OPSW are saved in the following SVRB. Do they show the same value like the registers in RTM2WA? _____
Answers to questions: See Appendix A.20, “SUMMARY FORMAT - Answers” on page 332.
A.11 The IP ANALYZE RESOURCE subcommand
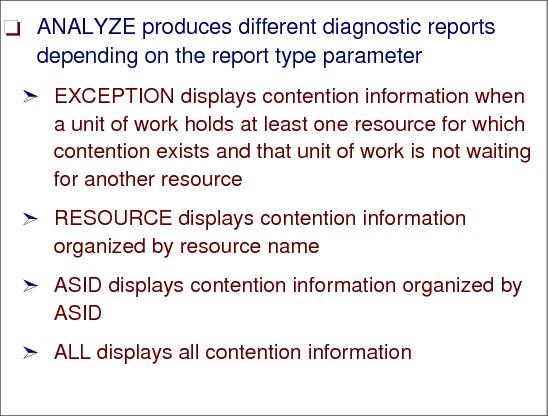
Figure A-28 IPCS ANALYZE subcommand
ANALYZE subcommand
Use the ANALYZE subcommand to gather contention information from component analysis exits and format the data to show where contention exists in the dump. ANALYZE obtains contention information for I/O, ENQs, suspend locks, allocatable devices, real frames, global resource serialization latches, and other resources.
The command is used to detect resource contention. Specifying GRSQ in the SDATA options makes the information more reliable. Generally the most useful information is found at the bottom of this report. The top is generally I/O device contention and isn't usually relevant. Figure A-29 on page 323 is an example of some contention, as follows:
•NAME=MAJOR=IGDCDSXS MINOR=SYSD.DFSMS.COMMDS is the resource name in contention.
•Note that the scope of the resource name is scope=systems.
Contention analysis
IPCS gathers contention information once for each dump. ANALYZE invokes each ANALYZE exit routine specified by parmlib members embedded in the BLSCECT parmlib member. When contention information has not been previously gathered, IPCS issues this message:
BLS01000I Contention data initialization is in progress
The amount of time required to gather contention information depends on the size of the dump, how many address spaces it contains, the number of I/O devices, and the amount of contention in the dump. IPCS recommends that you run the ANALYZE subcommand in the background as part of a preliminary screening report.
In the event that no contention information is detected, IPCS issues:
BLS01002I No resource contention detected. Undetected contention is possible.
|
RESOURCE #0011:
NAME=MAJOR=IGDCDSXS MINOR=SYSD.DFSMS.COMMDS SCOPE=SYSTEMS
RESOURCE #0011 IS HELD BY:
JOBNAME=SMS ASID=0025 TCB=009EB0F0 SYSNAME=CM01
RESOURCE #0011 IS REQUIRED BY:
JOBNAME=SMS ASID=0026 TCB=009EB0F0 SYSNAME=PR02
JOBNAME=SMS ASID=0026 TCB=009EB0F0 SYSNAME=PR03
JOBNAME=SMS ASID=0028 TCB=009EC660 SYSNAME=SP02
JOBNAME=SMS ASID=0027 TCB=009EB0F0 SYSNAME=TS01
|
Figure A-29 IP ANALYZE RESOURCE subcommand
|
Note: Holders and waiters are identified in the output. ASID and TCB (where appropriate) are provided and whether a scope=systems resource is the holding system name.
|
Lab exercise #1:
•Switch dumps by typing =0 (zero) on the IPCS command line.
•Change the DSNAME to ITSO.ABCVOL8.ENQHANG.
•Press Enter and proceed back to IPCS Option 6 (commands) by typing =6 on the command line. Proceed with the exercise.
•Customer reported job PHILGERB is not running. The problem we are looking at in dump ITSO.ABCVOL9.ENQHANG shows enqueue contention. Address space 20 jobname PHILGERA is holding a resource. PHILGERB needs this resource to continue the execution. Job PHILGERA is in a wait scenario.
Questions:
1. What is the dump title? __________________________________
2. What address spaces are dumped? ________________________
3. Due to jobname PHILGERB is not running, have a look at ASCB DPH value, which shows the dispatching priority for the job. Use IP SUMM FO ASID(X’1D’). What is the dispatching priority? _________
4. The dispatching priority is very high, so we need to concentrate on resource problems. Enter IP ANALYZE RESOURCE command and check whether we have an enqueue contention. Name the address space ids _________________
5. Get following information: MAJOR=_____ MINOR=_________ SCOPE=___________ The Scope information will show whether the enqueue is only on the local system or sysplex wide. A Scope name ending with an S means sysplex-wide enqueue.
6. Which job holds the resource? ________________What TCB? ______________
7. Which job is waiting? ______________ What TCB? ____________
8. Do you see any activities for these two address spaces in the systrace? _________
Have a look at the MTRACE whether an D GRS,C command was issued. If yes, does it show the same information? _______
|
Note: The next step would be to look at the TCB which helds the resource to get the information, why does this TCB not release the lock. Have a look at the PSW and what module had control last.
|
Additional hints
What to check if an address space is not running:
•Contention: Is there contention involving my address space?
– Check the ANALYZE RESOURCE report
– Check address space local lock status
•Address Space Dispatchability
– Check address space-level non-dispatchability bits
•Task Dispatchability
– Focus on the task(s) that should be driving the workload
– Check TCB-level non-dispatchability bits
– Examine TCB's RB chain, linkage stack
• a. Look for WAITs/SUSPENDs.
• b. Establish problem chronology.
•Errors preceding or accompanying hang
– Check LOGDATA, LOGREC
– Check MTRACE, SYSLOG
Recognizing resource contention
Resource contention can cause bottlenecks, as follows:
•Suspend locks
•ENQ resources
•Page faults
The IPCS ANALYZE RESOURCE processing does the following:
•Identifies bottlenecking units of work.
•Identifies resources, their owners, and their requesters; therefore look for the hung function as a requester.
A.12 Diagnosing excessive processor time
A high processor usage can influence the throughput on any system. To get the processor usage at the time of the dump, you can use L 10?+25C?+E4?+38 in IPCS when browsing the dump. Take the first 2 bytes from the output and divide by ten. Due to the fact that this is a hexa decimal value, convert it to decimal.
|
Browse the dump and enter L 10?+25C?+E4?+38
Let’s assume you get the following storage area lsited:
01AAB798 06400000 00000748
Take the first two bytes. In our case 0640
Devide it by 10
This hex value needs to be converted into decimal
x’064’ >>> dec 100
This shows, that our CPU is 100% busy
|
Figure A-30 How to calculate processor usage
Customer reported job PHILGER was looping.
|
Note: If a program is looping with an ABEND071 RC30 entry, this should be seen in the system log and in our case in the dump. An IP SYSTRACE shows the looping scenario and at least the mentioned abend. A RC30 means that, the system abnormally ended the program that was causing a system excessive spin-loop condition.
|
Lab exercise #2:
•Switch dumps by typing =0 (zero) on the IPCS command line.
•Change the DSNAME to ITSO.ABCVOL8.USERCPU.
•Press Enter and proceed back to IPCS Option 6 (commands) by typing =6 on the command line. Proceed with the exercise.
•The problem we are looking at in dump ITSO.ABCVOL8.USERCPU shows high CPU usage and a loop in address space 20. To get information who is eating up CPU, RMF MON ||| will show it. We will have a look at the looping asid.
Diagnosing the dump
To diagnose this dump, the questions that follow will walk you through the relevant questions that will lead you to the diagnosis.
Questions:
1. Check the total amount of CPU usage? ______
2. Get the address space id for jobname PHILGER1. Use IP SELECT ALL. What address space was the user running in? _____
3. Have a look at the systrace entries for asid number you found. Do you see a loop? _____
4. What TCB is running the loop? _________
5. Looking at the TCB using IP SUMM FO ASID(X’20’), does it show and abend indication? ____
6. Was the looping pgm ended by the system? ____
7. If the question 3 was answered with yes, which entry in the systrace leads to your opinion?
8. Get the module name where the loop takes place. Loops can be recognized by EXCP entries in the systrace. Get the PSW and locate it in the storage. Hit PF7 until you get the module name. _______________
9. Has the loop been interrupted? _____
10. If yes, which systrace entry shows the interrupt? _________
Answers to questions: See Appendix A.22, “Diagnosing excessive processor time - Answers” on page 333.
A.13 A standalone dump example
Lab exercise #5:
•Switch dumps by typing =0 (zero) on the IPCS command line.
•Change the DSNAME to ITSO.ABCVOL8.WAIT083. Use any ASID from (0 to 20).
•Press Enter and proceed back to IPCS Option 6 (commands) by typing =6 on the command line. Proceed with the exercise.
•The Problem: The system crashed, ending up in a non-restartable wait state. A standalone dump was taken.
IPCS command hints
A standalone dump provides huge amounts of data depending on the dump options. There may be additional trace or SVC dump information in the standalone dump.
Using the IP SYSTRACE TTCH(LIST) TIME(LOCAL) command you can check whether additional systraces are available. To make them readable, enter the IPCS SYSTRACE TTCH(x'xxxxxxxx') command, which will format the trace entries in this TTCH.
You may check for an SVC dump provided by the standalone dump. Enter the following IPCS command: IP COPYCAPD. You may get output as shown in Figure A-31.
|
Number Time stamp Title
------ ------------------- ----------------------------------------------
1 01/02/2003 22:45:42 SRM RECOVERY ENTERED, COMPON=SRM, COMPID=SC1CX,
ISSUER=IRARMER2
SYSDUMP.A004.D030102.T224540.#MASTER#.S00010
2 01/02/2003 22:45:48 COMPON=VSM-STORAGE,COMPID=SC1CH,ISSUER=IGVRSTOR
SYSDUMP.A004.D030102.T224545.CONSOLE.S00011
|
Figure A-31 COPYCAPD IPCS command output
To make the dumps ready for IPCS use, issue:
IP COPYCAPD 1 OUTDSN(MY.CAP.DUMP) COPYCAPD
This command will capture the dump number and output data set name and will cause the dump to be extracted.
Another useful IPCS command is provided to make an instruction flow that makes what you find in the dump readable. If you would like to get instruction formatting for the following instruction flow in the dump:
0108BD56 5810 90008910 000C5410
0108BD60 C570A51A 0400BFFF D9F40A0D 90E6D1D0
Use the following IPCS command to get the output shown in Example A-1 on page 327:
IP L 108BD56 L(x'1A') INSTR
Example: A-1 OP codes
LIST 0108BD56. ASID(X'002B') LENGTH(X'1A') INSTRUCTION
0108BD56 ! 5810 9000 ! L R1,X'0'(,R9)
0108BD5A ! 8910 000C ! SLL R1,X'C'
0108BD5E ! 5410 C570 ! N R1,X'570'(,R12)
0108BD62 ! A51A 0400 ! OILH R1,X'0400'
0108BD66 ! BFFF D9F4 ! ICM R15,X'F',X'9F4'(R13)
0108BD6A ! 0A0D ! SVC X'0D' ABEND, type 4, calls IEAVTRT2
0108BD6C ! 90E6 D1D0 ! STM R14,R6,X'1D0'(R13)
Standalone dump debug
To get a quick overview why this dump was taken and what were the last actions in the system, you may use the following commands:
•IP ST SYSTEM
– It shows information about dump taken time.
•IP ST WORKSHEET
– Information about why did we take this dump
– System name
– Available CPs
– zIIP and zAAP
– IP SYSTRACE ALL
– Which address spaces have been running last
•IP VERBX SADMPMSG
– Standalone dump request information
– Shows dumped date areas
•IP VERBX LODATA
– Look for any abend error indication preceding the standalone dump request.
Diagnosing the dump
To diagnose this dump, the questions that follow will walk you through the relevant questions that will lead you to the diagnosis.
Questions:
1. First issue IP ST WORKSHEET and note the title: _______________________________________
2. Get IEA020W message information___________
3. Get the wait state information from PSW at time of dump
4. If you look up the meaning of this wait state you will note that it means the FRR stack is corrupted. The FRR stacks are located at PSA+380. Since the PSA starts at virtual address 0 for each processor we can simply browse address 380 to see what's there. Note if there were more than one CPU we'd need to browse each PSA separately as they are processor dependent. So on the L (locate) command use the keyword CP(1). Browse the storage address 00000380, using the IPCS browse function and write down the eyecatcher that appears there: _________________________________________________
5. Try issuing the command L 380. cpu(0) while still looking at storage. What does this indicate? Do this for all CPs _______________________________________
The next step is to find out what caused the overlay you found above. To do that we can look in logdata, MTRACE or SYSTRACE in the hope that whatever overlaid the storage left some “footprints.” In this case let us start with IP VERBX MTRACE. Whatever did this overlay would have been one of the last things running before the wait state (the system would not survive long from an overlay of this magnitude).
6. What was the last entry in VERBX MTRACE? Which job started shortly before we get the problem? __________________________________
7. Use IP SELECT ALL to find the ASID of the item found above. _____________
8. Use IP SYSTRACE ALL. What was the last SVC issued? ________________________
SVC 8A is a pageser SVC that will allow a program to be in supervisor state, allowing it to write to locations such as PSA+380.
Browse the PSW shown in the SYSTRACE entry found above. Be aware to select the correct address space to look for the storage. The PSW address is 7230. Page back (and sometimes you may have to page forward and then page back to get the correct address, which is 7000) and record the eyecatcher found there: _____________________________________________________________________
Answers to questions: See Appendix A.23, “A standalone dump example - Answers” on page 333.
Conclusion
You have now completed the lab exercises. If you wish to go back and use any of the dumps to try some other IPCS items you may have learned, feel free to do so.
Remember that the dumps used are available via FTP for download as stated in the introduction.
The answers to the labs are on the following pages.
A.14 LIST TITLE and LIST SLIPTRAP - Answers
1. IP LIST TITLE can be used to get the title of the dump.
– Record the tile here:___ SLIP DUMP ID=PHIL_______
2. Based on the title of the dump you can make a guess as to what type of dump this is. Is this a (answers are highlighted):
– STANDALONE DUMP
– A CONSOLE DUMP
– SLIP TRAP GENERATED DUMP
– PROGRAM GENERATED DUMP
3. IP LIST SLIPTRAP can be used to show the slip trap used to obtain any dump, if a slip trap was used.
– Was a slip trap used? YES/ NO (circle one)
– If a slip trap was used, what was it?
• SLIP SET,C=0C4,ID=PHIL___________
A.15 IP ST WORKSHEET - Answers
Using the IP ST WORKSHEET command answer the following questions. Refer to the previous page for information on what this information looks like in the output.
1. What is the dump title? __SLIP DUMP ID=PHIL________
2. Does this agree with the list title output you saw before? _YES_
3. How many CPs are online in this dump? __6__
4. What is the original dump data set name?
__DUMP.D111110.H20.SC64.PHILGER1.S00022 ___
5. When was the dump taken? _ 15:26:13.270200 Local_____
|
Note: You could use the above information to prove that everyone in this lab session is using a copy of the same dump.
|
6. What was the name of the system this dump was taken on? SC64___
7. What was the primary address space (PASID) in control at the time of the dump?__20_
8. The IP SELECT ALL command provides a list of all the ASID numbers and the jobnames associated with them. Use this command to determine what the jobname is for the PASID found above __PHILGER1__
A.16 Using the RTCT control block - Answers
IP CBF RTCT formats the RTCT control block, which gives information such as what ASIDs where dumped.
1. Use the CBF RTCT command to find the ASID(s) included in this dump and list them here:
_____20_____
Additionally, the RTCT contains information on what SDATA options were used. To format this information, use the IP CBF RTCT+9C? STR(SDUMP) VIEW(FLAGS) command. Try this command and determine:
2. Was LSQA requested on the dump? YES
3. Was RGN requested (shown as RGN-Private)? YES
The output above will also indicate whether certain component exits receive control or not in the SDUEXIT flag.
4. Look at these flags to determine if GRSQ was specified. YES
A.17 Information from IP ST REGS - Answers
The following questions can all be answered by using the IP ST REGS command (as before, refer to the previous page for an example):
Questions:
1. What ABEND did we get? __0C4__
2. To get the exception information enter IP SYSTRACE and do a find for *RCVY. PGM preceding tis entry will show the pic value too. __PGM 004_____
3. Have a look at MVS System Codes manual to get the exception information. Protection Exception.
4. Enter IP ST W or IP ST REGS again. What was the failing PSW address? __PSW 07850000 00000000 00000000_00007026_______
5. What ASID is this failing code executing in? ____20_____
6. What was the failing TCB address? __7FF3A0______
Now using the address portion of the PSW, you want to get more information about the module that was running. You also want to browse some of the register storage. Use IPCS browse, IPCS Option 1, as shown in Figure A-4 on page 298.
7. When you browse the PSW address and back up with PF7, what eyecatcher do you see? The first instruction preceding the eyecatcher is a 47F0C01C ___AB0C4______
8. Browsing the code 4 bytes before the PSW can you determine the reason for the ABEND0C4? The failing instruction is a STH (Store Halfword) If you are not so familiar with opcodes, you can use IP OPCODE command. In our case IP OPCODE 40404040 Which register do we use to execute the instruction? __4__
9. ABEND0C4 pic 4 leads to accessing the page pointed to by register 4 using a wrong key. What key does our PSW show? ___key 8__
10. Each storage is getmained using a key. To get the key from the page pointed to by register 4 enter the IP RSMDATA VIRTPAGE RANGE(7D1000). Does the key match with the one in PSW? _NO key 1____
Answers to questions: See Appendix A.17, “Information from IP ST REGS - Answers” on page 331.
|
Note: The error occurred due to the storage where we expect an instruction shows blanks. (40404040) Due to this is a correct OP code, in our case STH, we try to execute it. But the reason for our abend 0C4 could in this case be an overlay or a bad branch.
|
A.18 IP SYSTRACE - Answers
1. By using IP SYSTRACE ASID(X’20’) TIME(LOCAL) and looking in the output for the PGM 004 entry, when did the abend occur? __15:26:12.8699____
2. Does the time match our IP ST W output?_ No because the dump was taken at systrace entry *SVC D_15:26:13.270200 Local.
3. Do we call RTM (Recovery Termination Manager)? Look for *RCVY _YES_
4. Is there an FRR (Functional Recovery Routine) between *RCVY and *SVC? _NO
5. Which module requested *SVC D to give control to RTM2? Browse the PSW from tis entry in our address space storage. To get the module name you can either enter IP W X or IP W 14601C2. W is the short form for WHERE and X can be used when you did a locate PSW address before. ___IEAVTRTM+261A_
6. What is the TCB that got the abend? __007FF3A0__
7. What processor number is shown? _3__
8. Are we running in cross memory mode? See PASD SASD. If they show different address space numbers we are running in cross memory mode. _NO. HOME,PRIMARY and SECONDARY show the same address space number_
A.19 IP VERBX MTRACE - Answers
The D GRS,C console command can be used to determine whether there is any resource contention on the active system. Looking at IP VERBX MTRACE output, determine if there were any GRS displays recently.
1. Have a look at the IP VEBX MTRACE output. Are other abends reported? __YES___
2. Have dumps been taken? __YES. Dump data sets have been allocated__
3. Did we use slip processing? __YES_
User PHILGER submitted a job. Which step ended with an abend indication? Check for message IEF450I. __GO__
A.20 SUMMARY FORMAT - Answers
1. Use the IP SUMM FORMAT ASID(X'20') command to determine which TCBs have a nonzero CMP field. You may have a look at the z/OS V1R13.0 MVS System Codes manual to get the error explanation ___ TCB 007FF130 and TCB 007FF3A0
2. Look at the control block flow from our TCB getting the ABEND0C4 error. Do a find for RTM2 and locate the SEQ#. If you have more than one RTM2 WA, you can use this information to determine which RTM was the first one we got. The one with the lowest number shows the first error. What does it show? _Completion code 840C4000___
3. Have a look at RTM”WA SUMMARY. Do the PSW and registers match our abend information in IP ST REGS? _YES_
4. Check the PRB. Which module is pointed to by OPSW? ___AB0C4___
5. The registers that belong to this OPSW are saved in the following SVRB. Do they show the same value like the registers in RTM2WA? __YES__
A.21 ANALYZE RESOURCE - Answers
1. What is the dump title? _____ENGHANG_____
2. What address spaces are dumped? ___0001, 001D, 0020, 001F, 0039, 001E, 0013 __
3. Because jobname PHILGERB is not running, have a look at ASCB DPH value, which shows the dispatching priority for the job. Use IP SUMM FO ASID(X’1D’). What is the dispatching priority? ___FE___
4. The dispatching priority is very high, so we need to concentrate on resource problems. Enter the IP ANALYZE RESOURCE command and check whether we have an enqueue contention. Name the address space ids __20, 1D____
5. Get the following information: MAJOR=_PAUL_ MINOR=_ROGERS__SCOPE=_SZSTEMS_ The Scope information will show whether the enqueue is only on the local system or sysplex wide. A Scope name ending with an S means sysplex-wide enqueue.
6. Which job holds the resource? __PHILGERA__What TCB? _007FF3A0_
7. Which job is waiting? _PHILGERB_ What TCB? __007FF3A0_
8. Do you see any activities for these two address spaces in the systrace? _YES. Asid 20 seems to be looping and asid 1D is in a WAIT scenario___
9. Have a look at the MTRACE whether an D GRS,C command was issued. If yes, does it show the same information? __YES__
A.22 Diagnosing excessive processor time - Answers
1. Check the total amount of processor usage? _x 4B dec 75%_____
2. Get the address space ID for jobname PHILGER1. Use IP SELECT ALL. What address space was the user running in? _20___
3. Have a look at the systrace entries for the asid number you found. Do you see a loop? _YES_
4. What TCB is running the loop? _007FE040_
5. Looking at the TCB using IP SUMM FO ASID(X’20’), does it show an abend indication? _YES_071
6. Was the looping pgm ended by the system? _YES___
7. If the question 3 was answered with yes, which entry in the systrace leads to your opinion? EXPL entries.
8. Get the module name where the loop takes place. Loops can be recognized by EXCP entries in the systrace. Get the PSW and locate it in the storage. Hit PF7 until you get the module name. _IGC079 _
9. Has the loop been interrupted? _YES__
10. If yes, which systrace entry shows the interrupt? _DSP and EXPL entries show this__
A.23 A standalone dump example - Answers
A.24 Diagnosing loops and hangs
Questions:
1. First issue IP ST WORKSHEET and note the title: ___SADUMP FOR WAIT083__
2. Get IEA020W message information __AN FRR STACK POINTER FOR CPU 02 IS DAMAGED____
3. Get the wait state information from PSW at time of dump 00004084
4. If you look up the meaning of this wait state you will note that it means the FRR stack is corrupted. The FRR stacks are located at PSA+380. Since the PSA starts at virtual address 0 for each processor we can simply browse address 380 to see what's there. Note if there were more than one CPU we'd need to browse each PSA separately as they are processor dependent. So on the L (locate) command use the keyword CP(1). Browse the storage address 00000380, using the IPCS browse function and write down the eyecatcher that appears there: __02A64A80__
5. Try issuing the command L 380. cpu(2) while still looking at storage. What does this indicate? Do this for all CPs __NG NG NG NG__
The next step is to find out what caused the overlay you found above. To do that we can look in logdata, MTRACE or SYSTRACE in the hope that whatever overlaid the storage left some “footprints.” In this case let us start with IP VERBX MTRACE. Whatever did this overlay would have been one of the last things running before the wait state (the system would not survive long from an overlay of this magnitude).
6. What was the last entry in VERBX MTRACE? Which job started shortly before we get the problem? ___PHILGER1 STARTED___
7. Use IP SELECT ALL to find the ASID of the item found above. __20__
8. Use IP SYSTRACE ALL. What was the last SVC issued? ___8A______
SVC 8A is a pageser SVC that will allow a program to be in supervisor state, allowing it to write to locations such as PSA+380.
Browse the PSW shown in the SYSTRACE entry found above. Be aware to select the correct address space to look for the storage. The PSW address is 7230. Page back (and sometimes you may have to page forward and then page back to get the correct address, which is 7000) and record the eyecatcher found there: _____________________________________________________________________
Answers to questions: See Appendix A.23, “A standalone dump example - Answers” on page 333.
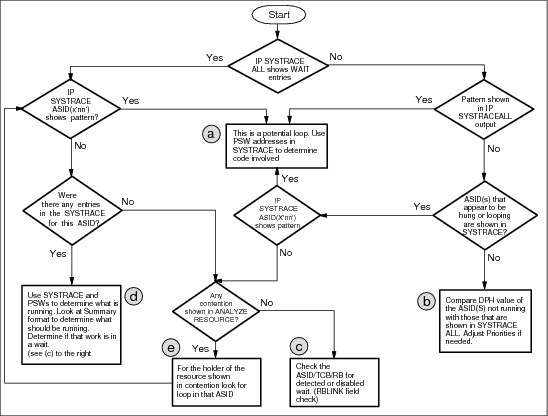
Figure A-32 Flowchart for loops and hangs
Loops and hangs
The flowchart shown in Figure A-32 can be used to diagnose possible loops and system hangs that may occur during processing.
•Step a
To get to this point a pattern of entries has been found in SYSTRACE. Use the PSW address in the SYSTRACE entries to determine what modules may be involved in the potential loop that has been found. If EXT 1005 entries have been found, this indicates that the code running is not executing traceable events. Even a couple of these entries can be significant if the PSW is in the same area of code on each entry.
•Step b
At this point a dispatching priority problem should be suspected. While this is not the only possible reason for the ASIDs being hung, it should be checked. Pick a couple of the ASIDs that occur frequently in the SYSTRACE ALL and look at the DPH values. Compare this to the DPH value of the job that should be running. If the DPH values in SYSTRACE ALL are higher, then suspect that perhaps the job or ASID simply cannot get the processor. If this does not work out, analyze resource for contention and look to see if the job that should be running is in a detected wait. (See steps c and e.)
•Step c
In A.10, “IP SUMMARY FORMAT subcommand” on page 320, some of the key fields in the SUMMARY FORMAT were described. To check to see if the address space is in a detected wait, the RBLINK field of the TCB that should be running (assume this is the last TCB unless there is a specific reason to believe that another TCB may be involved). Also, the ASCBENST field can be used to check the last time this ASID went into a wait (compare with time stamps in system trace).
•Step d
If the ASID in question is running in SYSTRACE then the goal is to determine what is supposed to be running in the address space that is not. To accomplish this requires some knowledge of the address space, looking at SUMMARY FORMAT with all individual TCBs to be examined, to determine what ones should be running. If these TCBs are not in detected waits then SYSTRACE ASID(x'nn') can be checked to see if those tasks are looping.
•Step e
If contention is noted in the ANALYZE RESOURCE command (more than a couple tasks waiting for a resource), then the goal becomes finding out why the task holding the resource is not releasing it. This can be treated as though the resource holder is a hung address space, which means going back to look for patterns in IP SYSTRACE ASID(x'nn') where nn is the ASID number holding the resource.
..................Content has been hidden....................
You can't read the all page of ebook, please click here login for view all page.