

Problem resolution steps
As a system programmer the important part of your job is to keep your system running and avoid application slowdowns or outages. If an error or problem occurs you should be able to collect all necessary information and documentation to fix it or to ask for assistance providing the collected documentation. If you need IBM support you should provide also a severity indication depending on the system impact. You should be able to find a search argument according to the error information to check for known problems or calling IBM support center.
The following problem resolution steps provide a debug guideline:
•Identifying and document the problem
•Prioritize the problem
•Analyze the problem and ask for assistance if necessary
•Implement the resolution and close the problem
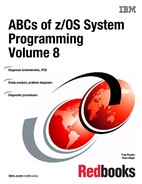
2.1 Identifying a problem
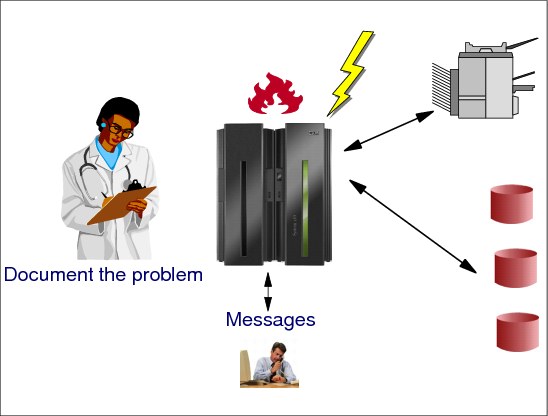
Figure 2-1 Identifying a problem
What caused the problem
Depending on the system or application impact in case of an error, the most important questions you must ask include:
•Is the process that is causing the problem a new procedure, or has it worked successfully before?
•If it was an existing procedure that was previously successful, what has changed?
•What messages are being generated that could indicate what the problem is? These could be presented on the terminal if the process is conversational, or in the batch or subsystem job log, or in the system log (SYSLOG).
|
Note: Review the z/OS MVS System Messages, SA22-763x and z/OS MVS Systems Codes, SA22-7626 manuals.
|
•Can the failure be reproduced, and if so what steps are being performed?
•Has the failing process generated a dump?
All of these questions will enable you to develop an appropriate plan of action to aid with the resolution. You can never be criticized for providing too much diagnostic data, but too little information only delays the solving of the problem.
Document the problem
Documentation of the problem and the analysis steps taken can assist with not only initial resolution, but will also assist if the problem occurs again. For larger more complex problems regular documentation during the analysis process can highlight areas that will become more crucial as the investigation progresses. This will enable you to develop a flow chart and reference point listing that can be referred to throughout your analysis. Document the final resolution for future reference.
Identifying the problem
A system problem can be described as any problem on your system that causes work to be stopped or degraded. The steps involved in diagnosing these problems are different for each type of problem.
Before you can begin to diagnose a system problem, however, you have to know what kind of problem you have. To identify a system problem, look at the following:
•System processing witnessed by the operator.
•The dump, in which the system records information about the system problem. It is important to remember that the error triggering a dump might be a symptom itself, and the information needed to diagnose the root cause might not be captured in that dump. Depending on what type of dump the system or the operator takes, you can determine the type of system problem you need to diagnose and whether you will need to collect additional data.
•The logrec data set, which contains a history of the errors encountered by the system.
•The console log.
•Operlog
2.2 Prioritize problem resolution
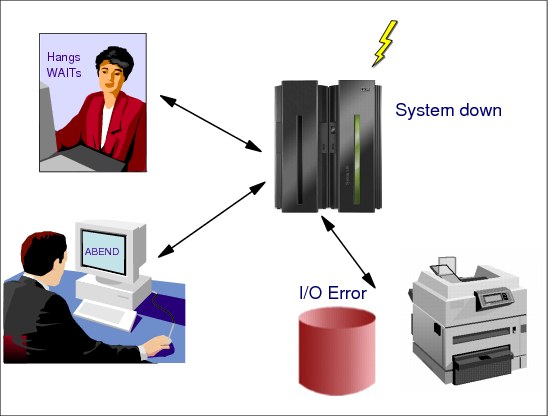
Figure 2-2 Prioritize problem resolution
Prioritize problem resolution
Your prime objective as a system programmer is to ensure system availability, and in the event of a major subsystem failure, for example, a Customer Information Control System (CICS) failure, or worse still the whole z/OS system, your focus will be on the speedy restoration of the system.
Subsystem failures will often generate their own diagnostic data, and the recovery process is often fairly straightforward. These systems will generally perform cleanup processes during recovery and thereby restore system availability. If the subsystem fails during recovery, then immediate problem analysis and resolution will be required.
System down
The worst-case scenario is that your complete z/OS system is down. Swift system recovery is required, but a decision must be made to determine whether the currently preserved main storage should be dumped via a stand-alone dump routine prior to the recovery Initial Program Load (IPL). The IPL process clears main storage; therefore, any failure information will be lost. The stand-alone dump process will take some time but could be extremely valuable should the problem reoccur.
System programmer actions
Depending on the nature of the problem, system programmers can take actions related to the type of problem that has occurred.
Abend Review the dump to determine if further diagnosis is required.
Review system messages to determine the abend's impact on the installation.
Hang or WAIT Use the DUMP command to obtain an SVC dump. If the SVC dump does not provide the necessary information, ask the operator to take a stand-alone dump.
l/O error Have the operator check to see whether the system console is responsive. If it is not, take a stand-alone dump. If it is, take an SVC dump of the user's address space.
LOOP Depending on what loop we got, enabled or disabled, Console or SA dump should be looked at.
High CPU If you recognize TSO user eating up CPU more than expected, you may cancel him
2.3 Problem severity

Figure 2-3 Reporting the severity of a problem to the IBM Support Center
Report problems to IBM
When you need to report a problem to the IBM Support Center, you will be asked what the severity of the problem is. We set severity from SEV-1 (highest severity, meaning worst problems) to SEV-4 (lowest severity, meaning least important problems). It's important to be realistic when reporting the severity of an issue, so we can prioritize it properly.
Severity 1 (SEV 1)
Production system down, critical business impact, unable to use the product in a production environment, no workaround is available.
Severity 2 (SEV 2)
Serious problem that has a significant business impact; use of the product is severely limited, but no production system is continuously down. SEV-2 problems include situations where customers are forced to restart processes frequently, and performance problems that cause significant degradation of service but do not render the product totally unusable. In general, a very serious problem for which there is an unattractive but functional workaround would be SEV-2, not SEV-1.
Severity 3 (SEV 3)
Problems that cause some business impact but that can be reasonably circumvented; situations where there is a problem but the product is still usable. For example, short-lived problems or problems with components that have failed and then recovered and are back in normal operation at the time the problem is being reported. The default severity of new problem reports should be SEV-3.
Severity 4 (SEV 4)
This severity is for minor problems that have minimal business impact. While we are all aware of the pressure that customers and management place on the speedy resolution of their problems, the correct problem severity enables all involved support teams to react to and manage the problems according to the “real” severity of the problem. While a “customer is unhappy SEV1” is in many cases valid for business reasons, it does not preclude the fact that a customer with a “production system down SEV1” is more important.
2.4 Analyze a problem - ask for assistance
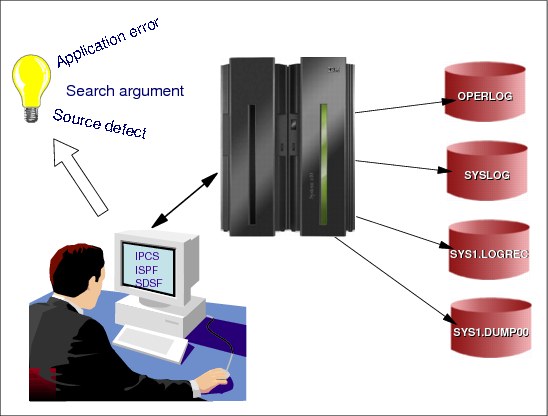
Figure 2-4 Analyze a problem
Analyze the problem
Before you start the process of what could be described as the more complex analysis procedures, you should review all of the data you currently have that may solve your problem. Have you:
1. Looked in the system log for any relevant messages or abend information?
2. Looked in the job log for any relevant messages or abend information?
3. Reviewed the meanings of any messages or codes in the relevant manuals?
4. Reviewed the system error log, SYS1.LOGREC, which contains information about hardware and software failures?
Problem analysis
Problem analysis is, like any process, a skill that develops the more you use it. Of course, problems vary in their complexity and frequency, and it is possible that tasks requiring this type of review may be infrequent in your environment. The ultimate aim is to have little need to perform complex problem diagnosis. This is why a sound methodology is necessary to assist with your analysis.
It is necessary to retain a focus during the analysis process and be aware that there are often alternative ways to approach a problem. To ask for assistance with a problem is not a sign of failure, but an indication you are aware that another person's views could speed up the resolution. A fresh idea can often stimulate and enhance your thought processes.
Solving a problem
Solving a problem is a combination of:
1. Your ability to understand the problem.
2. The quality of the diagnostic data you can review.
3. Your ability to use the diagnostic tools at your disposal.
Ask for assistance
You will hopefully be aware that some assistance may be required when you are making little progress with your diagnosis. What you and your manager are seeking is a speedy resolution, and it is far more professional to use all the facilities and technical expertise available. The IBM Support Center is there to assist you with your problems and the diagnostic data you have collected, and the analysis steps you have already performed will be of great help to the Support Center when they review the problem.
2.5 Gather Messages and Logrec
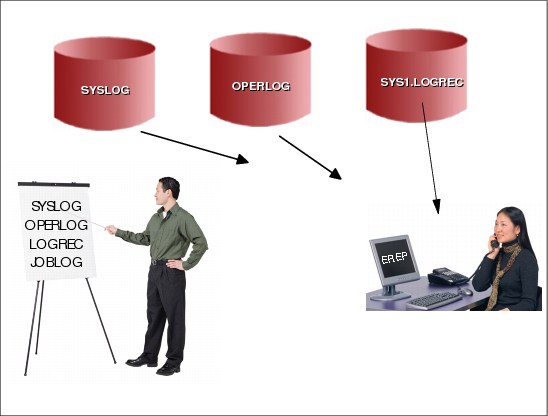
Figure 2-5 Gather messages and logrec
Gathering information
Often, the most readily available source of data identifies the key piece of information that will resolve the problem, and often, this source of data is overlooked. The first places to look when reviewing a problem are:
•The console log
•The system log
•An error log related to a specific product
•The whole system
While a system dump or a trace is often required, the logs may provide enough detail to solve the problem. The location of the relevant logs varies from product to product, and system to system.
Collect and analyze messages and logrec records about the problem. Look at any messages or software, symptom, and hardware records for logrec around the time of the problem.
Diagnostic data sources
The main sources of diagnostic data are contained in the messages provided by the system in the following logs:
•Console log
Messages sent to a console with master authority are intended for the operators. The system writes in the hard-copy log all messages sent to a console, regardless of whether the message is displayed.
•SYSLOG
The SYSLOG is a SYSOUT data set provided by the job entry subsystem (either JES2 or JES3). SYSOUT data sets are output spool data sets on direct access storage devices (DASD). An installation should print the SYSLOG periodically to check for problems. The SYSLOG consists of the following:
– All messages issued through WTL macros
– All messages entered by LOG operator commands
– Usually, the hard-copy log
– Any messages routed to the SYSLOG from any system component or program
•Job log
Messages sent to the job log are intended for the programmer who submitted a job. Specify the system output class for the job log in the MSGCLASS parameter of the JCL JOB statement.
•OPERLOG
Operations log (OPERLOG) is an MVS system logger application that records and merges messages about programs and system functions (the hardcopy message set) from each system in a sysplex that activates OPERLOG. Use OPERLOG rather than the system log (SYSLOG) as your hardcopy medium when you need a permanent log about operating conditions and maintenance for all systems in a sysplex.
•Hard-copy log
The hard-copy log is a record of all system message traffic:
– Messages to and from all consoles
– Commands and replies entered by the operator
In a dump, these messages appear in the master trace. With JES3, the hard-copy log is always written to the SYSLOG. With JES2, the hard-copy log is usually written to the SYSLOG but can be written to a console printer, if the installation chooses.
•Logrec
Logrec log stream is an MVS System Logger application that records hardware failures, selected software errors, and selected system conditions across the sysplex. Using a logrec log stream rather than a logrec data set for each system can streamline logrec error recording.
2.6 SYSLOG processing
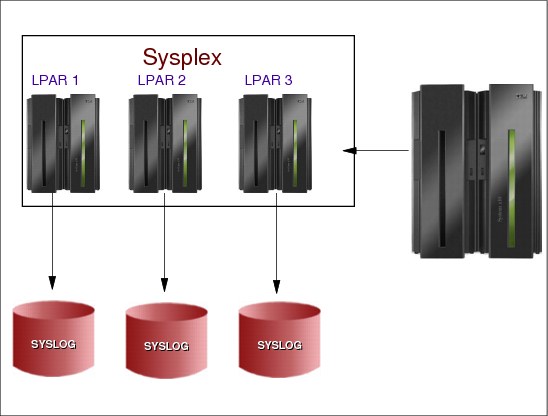
Figure 2-6 SYSLOG processing
SYSLOG processing
The system log (SYSLOG) is a direct access data set that stores messages and commands. It resides in the primary job entry subsystem's spool space. It can be used by application and system programmers (through the WTL macro) to record communications about programs and system functions. You can use the LOG command to add an entry to the system log.
Several kinds of information can appear in the system log:
•Job time, step time, and data from the JOB and EXEC statements of completed jobs entered by user-written routines
•Operating data entered by programs using a write to log (WTL) macro instruction
•Descriptions of unusual events that you enter using the LOG command
•The hardcopy message set
On z/OS, the SYSLOG can be viewed via the Spool Display and Search Facility (SDSF) using the LOG option. A small amount of the SYSLOG is also stored in memory and is included when an address space is dumped. This is referred to as master trace (MTRACE) data and can be accessed via the IPCS using the VERBX MTRACE command.
2.7 SYSLOG messages

Figure 2-7 Examples of SYSLOG messages
SYSLOG messages
Figure 2-7 shows an example of the ZOS SYSLOG. The time stamps that would normally be seen to the left of the data shown in the bottom half of the figure are shown in the top part of the figure.
Message description
The system log (SYSLOG) is a data set residing in the primary job entry subsystem's spool space. It can be used by application and system programmers to record communications about problem programs and system functions. The operator can use the LOG command to add an entry to the system log.
|
Note: You can change the SYSLOG data set characteristics dynamically through the dynamic allocation installation exit. See z/OS MVS Installation Exits, SA22-7593.
|
SYSLOG is queued for printing when the number of messages recorded reaches a threshold specified at system initialization. The operator can force the system log data set to be queued for printing before the threshold is reached by issuing the WRITELOG command.
Message IEC070I
When the IEC070I message is displayed, a description of the first message follows the messages:
IEC070I 203-204,RMFGAT,RMFGAT,SYS00753,3E14,SBOX01,RMF3.SC70.B, 808
IEC070I RMF3.SC70.B.DATA,UCAT.VSBOX01
------------------Message description---------------------------
IEC070I rc[(sfi)]- ccc,jjj,sss,ddname,dev,volser,xxx,dsname,cat
IEC070I message description
Explanation: An error occurred during EOV (end-of-volume) processing for a VSAM data set.
In the message text:
•203 is the return code (rc). This field indicates the specific cause of the error. For an explanation of this return code, see message IEC161I.
– sfi is the subfunction information (error information returned by another subsystem or component). This field appears only for certain return codes, and its format is shown with those codes to which it applies. When a catalog LOCATE request fails, this field appears for return code 032 or 034.
•204 is a problem-determination function (PDF) code. The PDF code is for use by the IBM Support Center if further problem determination is required. If the PDF code has meaning for the user, it is documented with the corresponding reason code (rc).
•RMFGAT (ccc) is the job name.
•RMFGAT (sss) is the step name. If the step is part of a procedure, this field contains an eight-character procedure step name, with trailing blanks, followed by the name of the job step that called the procedure, without trailing blanks. The two names are not separated by a comma.
•SYS00753 (ddname) is the data definition (DD) name.
•3E14 (dev) is the device number, if the error is related to a specific device.
•SBOX01(volser) is the volume serial number, if the error is related to a specific volume.
•RMF3.SC70.B (xxx) is the name of the cluster that contained the data set being processed when the error was detected, or when not available, the data set name specified in the DD statement indicated in the access method control block (ACB).
•RMF3.SC70.B.DATA (dsname) is the name of the data set being processed when the error was detected.
•UCAT.VSBOX01 (cat) is the catalog name.
System programmer response
If the error recurs and the program is not in error, look at the messages in the job log for more information. Search problem reporting databases for a fix for the problem. If no fix exists, contact the IBM Support Center. Provide all printed output and output data sets related to the problem.
2.8 OPERLOG (operations log)

Figure 2-8 OPERLOG processing
OPERLOG
The operations log (OPERLOG) is a log stream that uses the system logger to record and merge communications about programs and system functions from each system in a sysplex. The operations log is operationally independent of the system log. An installation can choose to run with either or both of the logs. If you choose to use the operations log as a replacement for SYSLOG, you can prevent the future use of SYSLOG.
You can use the operations log (OPERLOG) to record messages and commands from all the systems in a sysplex. The operations log centralizes log data in a sysplex. The OPERLOG panel displays the data from a log stream, a collection of log data used by the MVS System Logger to provide the merged, sysplex-wide log.
OPERLOG message
Following is a message from the OPERLOG, the same message described in Figure 2-7 on page 41.
|
M 0020000 SC70 2005185 19:40:01.33 RMFGAT 00000090
E 808 00000090
-----------------------------------------------------------------------
IEC070I 203-204,RMFGAT,RMFGAT,SYS00753,3E14,SBOX01,RMF3.SC70.B
IEC070I RMF3.SC70.B.DATA,UCAT.VSBOX01
|
2.9 Job error logs

Figure 2-9 Display of CICS SYSOUT data sets obtained with the SDSF DA operand
Job error log data sets
Each individual product has its own log file on the z/OS platform that may contain data that may be valuable when diagnosing a problem. It is particularly important to look for events that precede that actual failure, because the problem, in many cases, will have been caused by a previous action. Figure 2-9 shows the SYSOUT data sets that might be associated with a CICS address space.
The key SYSOUT data sets to review that may provide problem determination data are:
JESMSGLG and MSGUSR
The following data sets will contain Language Environment (LE) problem data usually associated with application problems:
CEEMSG and CEEOUT
MSGUSR data set
Figure 2-10 on page 45 shows an example of some transaction abend data included in the MSGUSR SYSOUT data set.
|
DFHIR3783 04/11/2005 01:25:50 SCSCPTA2 Transaction SX2 termid E39 -
Connected transaction abended with message DFHAC2206 01:25:50 SCSCPAA4 Transaction SX2
failed with abend AFCV. Updates to local recoverable resources backed out.
DFHAC2236 04/11/2005 01:25:50 SCSCPTA2 Transaction SX2 abend AZI6 in program *UNKNOWN
term PB09. Updates to local recoverable resources will be backed out.
DFHAC2262 04/11/2005 01:25 (sense code 0824089E).
DFHAC2206 01:25:50 SCSCPAA4 Transaction SX2 failed with abend AFCV.
Updates to local recoverable resources backed out.
|
Figure 2-10 CICS MSGUSR SYSOUT data set sample data
JESMSGLG data set
The CICS JESMSGLG SYSOUT data set includes information related to CICS startup and errors related to system problems, not specifically transaction related. Figure 2-11 is a sample taken from the CICS JES Message Log (JESMSGLG).
|
+DFHTR0103 TRACE TABLE SIZE IS 64K
+DFHSM0122I SCSCPTA2 Limit of DSA storage below 16MB is 5,120K.
+DFHSM0123I SCSCPTA2 Limit of DSA storage above 16MB is 60M.
+DFHSM0113I SCSCPTA2 Storage protection is not active.
+DFHSM0126I SCSCPTA2 Transaction isolation is not active.
+DFHSM0120I SCSCPTA2 Reentrant programs will not be loaded into read-only storage
+DFHDM0101I SCSCPTA2 CICS is initializing.
+DFHXS1100I SCSCPTA2 Security initialization has started.
+DFHWB0109I SCSCPTA2 Web domain initialization has started.
+DFHSO0100I SCSCPTA2 Sockets domain initialization has started.
+DFHRX0100I SCSCPTA2 RX domain initialization has started.
+DFHRX0101I SCSCPTA2 RX domain initialization has ended.
+DFHLG0101I SCSCPTA2 Log manager domain initialization has started.
+DFHEJ0101 SCSCPTA2 291
Enterprise Java domain initialization has started. Java is a
trademark of Sun Microsystems, Inc.
+DFHDH0100I SCSCPTA2 Document domain initialization has started.
.
+DFHLG0103I SCSCPTA2 System log (DFHLOG) initialization has started.
+DFHLG0104I SCSCPTA2 340
System log (DFHLOG) initialization has ended. Log stream
************************** is connected to structure
****************.
+DFHSI1519I SCSCPTA2 The interregion communication session was successfully started
+DFHWB1007 SCSCPTA2 Initializing CICS Web environment.
+DFHWB1008 SCSCPTA2 CICS Web environment initialization is complete.
+DFHSI8430I SCSCPTA2 About to link to PLT programs during the third stage of initialization
+EYUNX0001I SCSCPTA2 LMAS PLTPI program starting
+EYUXL0003I SCSCPTA2 CPSM Version 220 LMAS startup in progress
+EYUXL0103E SCSCPTA2 CICSPlex SM subsystem (EYUX) not active
+EYUXL0024I SCSCPTA2 Waiting for CICSPlex SM subsystem activation
|
Figure 2-11 CICS JESMSGLG output
2.10 Logrec data set
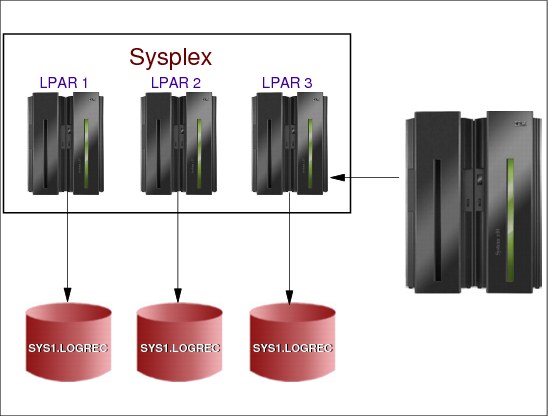
Figure 2-12 SYS1.LOGREC data sets
Logrec data set
The z/OS error log contains data related to hardware and software errors. This data is written to the SYS1.LOGREC data set and is also written to internal storage that is included in a dump. The SYS1.LOGREC data set can be interrogated using the ICFEREP1 program, or if the abend has triggered a dump, the EREP data can be reviewed using the IPCS VERBX LOGDATA command.
Figure 2-13 on page 48 shows the last error record contained in the error log generated when the VERBX LOGDATA command was issued for a dump being reviewed using IPCS. Generally, the error log entries at the end of the display, if they have an influence on the problem being reviewed, will have time stamps that relate to (or immediately precede) the actual abend.
|
JOBNAME: ITSOCI0I SYSTEM NAME: SC48
ERRORID: SEQ=05462 CPU=0042 ASID=00CE TIME=15:03:28.1
SEARCH ARGUMENT ABSTRACT
PIDS/5740XYR00 RIDS/DSNXGRDS#L RIDS/DSNXRIVB AB/S00C7 PRCS/00000000 REGS/0CB2C
REGS/B6B67 RIDS/DSNTFRCV#R
SYMPTOM DESCRIPTION
------- -----------
PIDS/5740XYR00 PROGRAM ID: 5740XYR00
RIDS/DSNXGRDS#L LOAD MODULE NAME: DSNXGRDS
RIDS/DSNXRIVB CSECT NAME: DSNXRIVB
AB/S00C7 SYSTEM ABEND CODE: 00C7
PRCS/00000000 ABEND REASON CODE: 00000000
REGS/0CB2C REGISTER/PSW DIFFERENCE FOR R0C: B2C
REGS/B6B67 REGISTER/PSW DIFFERENCE FOR R0B:-6B67
RIDS/DSNTFRCV#R RECOVERY ROUTINE CSECT NAME: DSNTFRCV
OTHER SERVICEABILITY INFORMATION
DATE ASSEMBLED: 01/29/04
MODULE LEVEL: UQ84577
SUBFUNCTION: RDS SQL DIAGNOSE
SERVICEABILITY INFORMATION NOT PROVIDED BY THE RECOVERY ROUTINE
RECOVERY ROUTINE LABEL
TIME OF ERROR INFORMATION
PSW: 077C1000 9E43EDFC INSTRUCTION LENGTH: 04 INTERRUPT CODE: 0007
FAILING INSTRUCTION TEXT: D5244420 B0219680 D5245820
|
Figure 2-13 Final record in logrec data from IPCS VERBX LOGDATA
|
Note: Do not ignore the valuable data that is written to the log files.
|
2.11 Analyzing EREP reports

Figure 2-14 Gather messages and logrec
Environmental Record Editing and Printing Program (EREP)
The Environmental Record Editing and Printing Program (EREP) is a diagnostic application program that runs under the MVS, VM, and VSE operating systems.The purpose of EREP is to help IBM service representatives maintain your data processing installation. EREP edits and prints reports from the records placed in the error recording data set (ERDS) by the error recovery program (ERP) of your operating system. Some of these records are the result of device or system errors, while others are informational or statistical data. The service representative analyzes information in the EREP reports to determine whether a problem exists, what the problem is, and where the problem is located.
What EREP does
EREP processes the error records from your operating system to produce formatted reports. These EREP reports can show the status of the entire installation, an I/O subsystem, or an individual device, depending upon which report you request.
|
Important: EREP is a service tool that shows statistical data that helps your IBM service representative determine whether a problem is media related or hardware related.
1. EREP edits and prints records that already exist; it does not create the error records.
2. EREP is not designed to automate media maintenance or library management.
|
2.12 Using EREP

Figure 2-15 Establishing an EREP environment
EREP report types
EREP reports vary in format depending on types shown in Table 2-1.
Table 2-1 EREP report types
|
Report Type
|
Format
|
|
System summary
|
Error data in summary form
|
|
Trends
|
Error data by daily totals
|
|
Event history
|
Error data in a time sequence by occurrence
|
|
System exception
|
The system exception series is a series of reports that list software and hardware error data in a variety of ways to help you identify problems within your subsystems.
|
|
Threshold summary
|
The threshold summary report shows all the permanent read/write errors, temporary read/write errors, and media statistics for each volume mounted.
|
|
Detail edit and summary
|
The detail edit and summary reports provide environmental information, hexadecimal dumps and summaries of errors to determine their nature and causes.
|
EREP records
Your operating system with its hardware and software captures statistical and error data, such as:
•A read error on a direct access device or tape volume
•A machine check on a processor
•An IPL of the operating system
Processing EREP data records
The system procedure executing EREP issues commands to write the buffered statistical data from the system-attached devices to the ERDS (error recording data set). The system ERP (error recovery program/processing) builds the records in the stages shown in Table 2-2.
Table 2-2 EREP processing stages
|
Stage
|
Action
|
|
1
|
The devices attached to the operating system generate sense data for the events encountered during the day. The sense data can be informational, error-related, or statistical.
|
|
2
|
The ERP of the operating system looks at the sense data. If the sense data indicates that a record should be built, the ERP takes the sense data and places it after the standard header information. The combination of the header information and the sense data becomes the error record.
|
|
3
|
The operating system ERP writes the records onto the system ERDS.
|
Setting up and running EREP
See Environmental Record Editing and Printing Program (EREP) User’s Guide GC35-0151 for the general guidelines for invoking and running EREP.
2.13 EREP reports
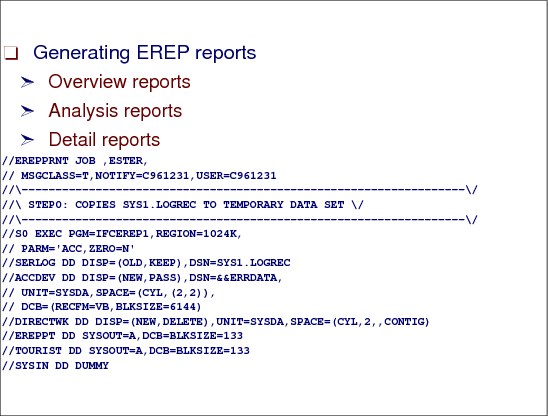
Figure 2-16 Generating EREP reports
EREP reports
EREP reports are designed to give you a variety of views of the data being processed. EREP produces:
Overview reports From which you can determine if there are problems
Analysis reports From which you can determine where there are problems
Detail reports From which you can determine what the problems are
Generating an EREP report
MVS systems require system controls that create the interface between EREP and the operating system. The following is an example of job control language (JCL) to execute a series of EREP reports as it would appear in a file without the annotation of the more detailed example provided in Environmental Record Editing and Printing Program (EREP) User’s Guide, GC35-0151.
You run EREP by executing a procedure containing the operating system EREP command and its associated parameter and control statements. You can only request one type of report each time you execute the EREP command for your system. You may produce any number of different type reports by issuing additional EREP commands with the associated parameters and control statements.
Create MVS JCL
Define the input and output data sets using JCL DD statements. The JCL submits the job as a batch job or interactively via TSO. Put the IFCEREP1 program in the JCL EXEC statement. Include the EREP parameters on the EXEC statement or as part of SYSIN in-stream data with the EREP control statements, as shown in Figure 2-17.
|
//EREPPRNT JOB ,ESTER,
// MSGCLASS=T,NOTIFY=C961231,USER=C961231
//------------------------------------------------------------------/
// STEP0: COPIES SYS1.LOGREC TO TEMPORARY DATA SET /
//------------------------------------------------------------------/
//S0 EXEC PGM=IFCEREP1,REGION=1024K,
// PARM='ACC,ZERO=N'
//SERLOG DD DISP=(OLD,KEEP),DSN=SYS1.LOGREC
//ACCDEV DD DISP=(NEW,PASS),DSN=&&ERRDATA,
// UNIT=SYSDA,SPACE=(CYL,(2,2)),
// DCB=(RECFM=VB,BLKSIZE=6144)
//DIRECTWK DD DISP=(NEW,DELETE),UNIT=SYSDA,SPACE=(CYL,2,,CONTIG)
//EREPPT DD SYSOUT=A,DCB=BLKSIZE=133
//TOURIST DD SYSOUT=A,DCB=BLKSIZE=133
//SYSIN DD DUMMY
//
//------------------------------------------------------------------/
// STEP1: PRINTS SYSTEM SUMMARY REPORT /
//------------------------------------------------------------------/
//S1 EXEC PGM=IFCEREP1,REGION=1024K,
// PARM='HIST,ACC=N,SYSUM'
//ACCIN DD DISP=(OLD,PASS),DSN=&&ERRDATA
//DIRECTWK DD DISP=(NEW,DELETE),UNIT=SYSDA,SPACE=(CYL,2,,CONTIG)
//EREPPT DD SYSOUT=A,DCB=BLKSIZE=133
//TOURIST DD SYSOUT=A,DCB=BLKSIZE=133
//SYSIN DD DUMMY
//
//------------------------------------------------------------------/
// STEP2: PRINTS SYSTEM EXCEPTION REPORTS /
//------------------------------------------------------------------/
//S2 EXEC PGM=IFCEREP1,REGION=1024K,
// PARM='HIST,ACC=N,SYSEXN,TABSIZE=128K'
//ACCIN DD DISP=(OLD,PASS),DSN=&&ERRDATA
//DIRECTWK DD DISP=(NEW,DELETE),UNIT=SYSDA,SPACE=(CYL,2,,CONTIG)
//EREPPT DD SYSOUT=A,DCB=BLKSIZE=133
//TOURIST DD SYSOUT=A,DCB=BLKSIZE=133
//SYSIN DD DUMMY
//
//------------------------------------------------------------------
|
Figure 2-17 EREP save and report JCL example
2.14 EREP parameter and control statements
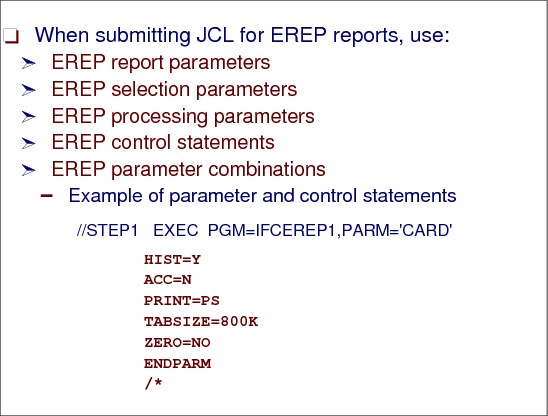
Figure 2-18 Parameter and control statements for EREP reports
Using parameter and control statements
The parameters and control statements can be grouped according to the type of information they convey to the EREP program, as shown in Figure 2-19 on page 55 and Figure 2-20 on page 55.
These parameter and control statements determine the following:
•Which report to produce
•Which records to select for the requested report
•How to control the processing of error records and report output
•How to direct EREP processing and supply more information about the system's configuration
This provides organization to the requested reports.
Using PARM=CARD
In the JCL, specify PARM='CARD' and enter the parameters and control statements on the SYSIN statement, as follows:
//STEP1 EXEC PGM=IFCEREP1,PARM='CARD'
EREP summary report
The system summary report, using the SYSUM parameter, provides an overview of errors for each of your installation's principal parts, or subsystems. SYSUM produces a condensed two-part system summary report of all errors for the principal system elements, such as CPU, channels, storage, SCP, and the I/O subsystem.
|
//HILG1A JOB (7904),MSGLEVEL=(1,1),MSGCLASS=K,REGION=6000K,
// NOTIFY=HILG,CLASS=A
//STEP1 EXEC PGM=IFCEREP1,PARM='CARD'
//SERLOG DD DSN=SYS1.LOGREC,DISP=SHR
//ACCIN DD DSN=VSA1.EREP.RECCRW,DISP=SHR
//DIRECTWK DD UNIT=SYSDA,SPACE=(CYL,5,,CONTIG)
//EREPPT DD SYSOUT=*
//TOURIST DD SYSOUT=*
//SYSIN DD *
HIST=Y
ACC=N
SYSUM
TABSIZE=800K
ZERO=NO
ENDPARM
/*
|
Figure 2-19 EREP summary report
EREP SYSEXN report
The SYSEXN parameter produces a system exception report series covering processors, channels, DASD, optical, and tape subsystems.
|
//HILG1A JOB (7904),MSGLEVEL=(1,1),MSGCLASS=K,REGION=6000K,
// NOTIFY=HILG,CLASS=A
//STEP1 EXEC PGM=IFCEREP1,PARM='CARD'
//SERLOG DD DSN=SYS1.LOGREC,DISP=SHR
//ACCIN DD DSN=VSA1.EREP.RECCRW,DISP=SHR
//DIRECTWK DD UNIT=SYSDA,SPACE=(CYL,5,,CONTIG)
//EREPPT DD SYSOUT=*
//TOURIST DD SYSOUT=*
//SYSIN DD *
HIST=Y
ACC=N
SYSEXN
TABSIZE=800K
ZERO=NO
ENDPARM
/*
|
Figure 2-20 EREP exception report
2.15 Copy logs to tape
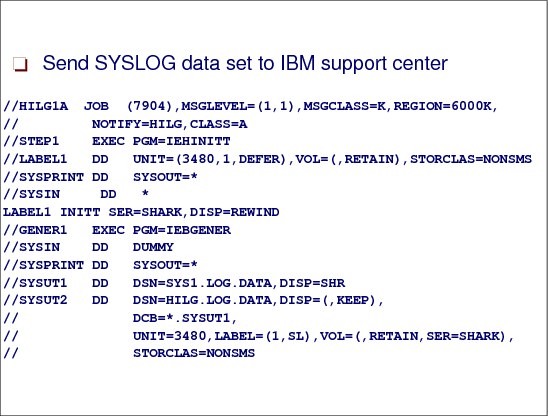
Figure 2-21 JCL to create SYSLOG on tape
SYSLOG to support center
Sometimes it might be necessary to copy log data sets to a tape and send them to IBM or any other support center. The following JCL can be used to label the tape and copy data:
To send data to IBM you don’t need the data on a tape. You can send the data using FTP to a server. Ask your support center for the address.
2.16 Implement a resolution
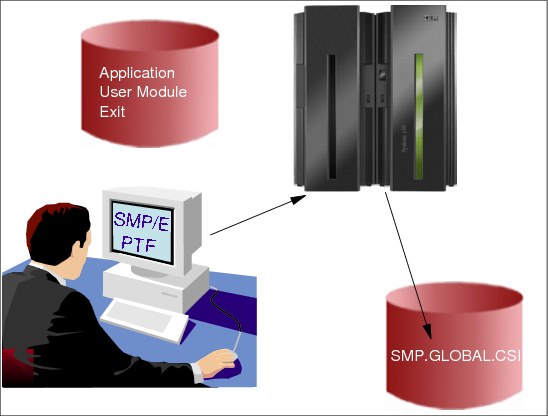
Figure 2-22 Implement a resolution
Implement the resolution
Successful diagnosis of the problem will result in a number of possible resolutions:
•User Error
This will require you to correct your procedure to ensure a satisfactory resolution is implemented. If your procedure is impacting other users, then prompt action is encouraged.
•Software implementation error
You must ensure that all installation procedures have been correctly executed and any required customization has been performed correctly. Until you can be sure of a successful implementation, it is advisable to remove this software, or regress to a previous level of the software until more extensive testing can be done in an environment that will not impact production workloads.
•Software product fault
If the fault is identified as a failure in software a fix might already have been developed to solve this problem. This fix is identified as a Program Temporary Fix (PTF) and will need to be installed into your system. If the problem is causing a major impact, it is suggested that you expedite your normal migration process and promote the fix to the problem system to hopefully stabilize that environment.
If the problem has not been previously reported, an authorized program analysis report (APAR) will be created and a PTF will be generated.
•Hardware fault
This is the resolution that will be controlled by the hardware service representative, but may require some reconfiguration tasks, depending on the nature of the problem. Consultation with the hardware vendor's service representative will clarify the requirements.
Close the problem
When you have tested and implemented the problem resolution, ensure that all parties involved with this problem are informed of the closure of this issue.
It should be noted that during your career you will experience some problems that occur only once, and even with the best diagnostic data, cannot be recreated or solved, by anyone. When this happens there is a point in time where you must accept the fact that this anomaly was in fact just that, an anomaly.
..................Content has been hidden....................
You can't read the all page of ebook, please click here login for view all page.