


Common problem types
z/OS can process large amounts of work efficiently because it keeps track of storage in a way that makes its storage capacity seem greater than it is. It’s a complex system made up of many components, similar to the human body. And, like the human body, z/OS can experience problems that need to be diagnosed and corrected.
The following are examples of problems you might encounter while running z/OS:
•An abnormal end occurs in processing, known as an abend.
– Application program abends
– System program abends
•A job remains hung in the system.
– System, subsystem and application hang.
•The system or process repetitively loops through a series of instructions.
– System, subsystem and application loop
•I/O errors.
•System wait states.
•Processing slows down.
For system problems, z/OS displays symptoms that will help you with your diagnosis. Problem source identification, called PSI, is the determination of what caused the error. Why was an abend issued? What program is using so much of system storage? What component caused the hang? Which program is looping?
3.1 Common problem types
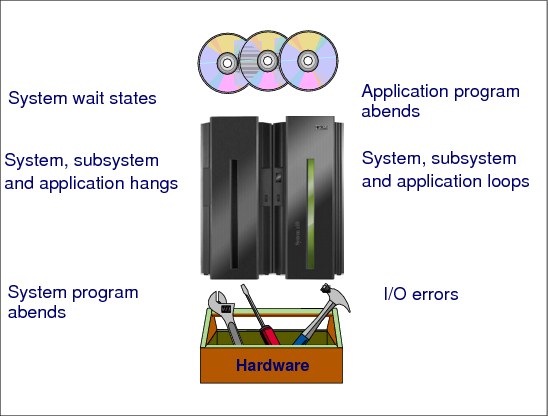
Figure 3-1 Common problem types
Application program abends
Application program abends are always accompanied by messages in the system log (SYSLOG) and the job log indicating the abend code and usually a reason code. Many abends also generate a symptom dump in the SYSLOG and job log. A symptom dump is a system message, either message IEA995I or a numberless message, which provides some basic diagnostic information for diagnosing an abend. Often the symptom dump information can provide enough information to diagnose a problem.
For a system-detected problem, the system abnormally ends a task or address space when it determines that the task or address space cannot continue processing and produce valid results.
System program abends
Like application program abends, system program abends are usually accompanied by messages in the system log (SYSLOG), and if there is a SYS1.DUMPxx data set available or dynamic dump data set allocation at the time of the abend, and this dump code was not suppressed by the dump analysis and elimination (DAE) facility, then an SVC dump will be taken. SVC dumps will be discussed later in this chapter.
I/O errors
I/O errors are most likely caused by a hardware failure or malfunction. The visible symptom will be an abend, accompanied by messages in the SYSLOG that include reason codes, which can identify the type of error, and sense data, which will offer more detailed, hardware-specific information.
I/O errors can also be the result of software conditions that create a situation where subsequent operations will appear as I/O errors. This could be the result of a corruption in a data set, or data set directory, and the rectification process may be as simple as redefining the data set.
System wait states
The basic summation of a wait state is: the "machine is dead and will not IPL". You will usually experience this condition during the IPL process, and the disabled wait state code will indicate the problem. The cause is often as simple as the system not being able to find some data that is crucial to the IPL process on the IPL volume. Wait codes are documented in z/OS MVS System Codes, SA22-7626.
The types of waits are:
•Disabled wait with a wait state code - The system issues a wait state code and stops. The operator can see the wait state code on the system console. This wait is called a coded wait state or a disabled wait. There are two types of disabled wait state codes, restartable and non-restartable.
For a non-restartable wait state code, the operator must reIPL the system. For a restartable wait state code, the operator may restart the system.
•Enabled wait - The system stops processing without issuing a wait state code when the dispatcher did not find any work to be dispatched.
The operator sees a WAIT indicator on the system console, followed by a burst of activity caused by system resources manager (SRM) processing, followed by the WAIT indicator, followed by a burst of activity, and so on. An indication of an enabled wait is a PSW of X'07xxxxxx xxxxxxxx'.
A special type of enabled wait is called a no work wait or a dummy wait.
System hangs and loops
The operator usually takes a standalone dump for one of the following types of problems:
•Disabled wait
•Enabled wait
•Loop
•Partial system hang
3.2 standalone dumps
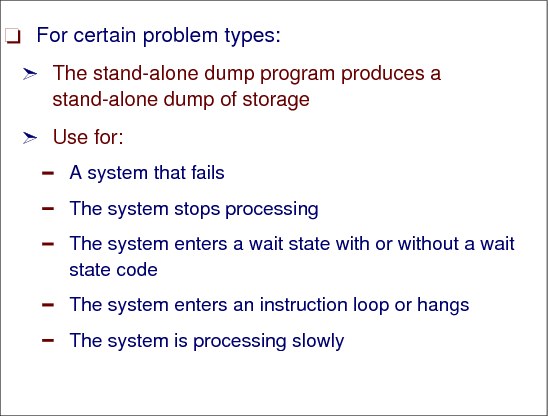
Figure 3-2 Conditions for taking standalone dumps
standalone dumps
The standalone dump program (SADMP) produces a standalone dump of storage that is occupied by one of the following:
•A system that failed.
•A standalone dump program that failed.
Either the standalone dump program dumped itself — a self-dump —, or the operator loaded another standalone dump program to dump the failed standalone dump program.
The standalone dump program and the standalone dump together form what is known as the standalone dump service aid. The term standalone means that the dump is performed separately from normal system operations and does not require the system to be in a condition for normal operation.
The standalone dump program produces a high-speed, unformatted dump of central storage and parts of paged-out virtual storage on a tape device or a direct access storage device (DASD). The standalone dump program, which you create, must reside on a storage device that can be used to IPL.
When an operator takes a standalone dump, it is important to determine the conditions of the system at the time the dump was taken. Because a standalone dump can be requested for various problem types, the collection of problem data is imperative for determining the cause of the error.
The objectives for analyzing the output of a standalone dump are:
•Gather symptom data
•Determine the state of the system
•Analyze preceding system activity
•Find the failing module and component
Determine symptoms
Operational conditions should be determined to understand the exact circumstances that caused the dump to be taken, as follows:
•Was the system put into a wait state?
•Were the consoles hung or locked up?
•Were commands being accepted on the master console without a reply?
•Was a critical job or address space hung?
3.3 Symptom dump output
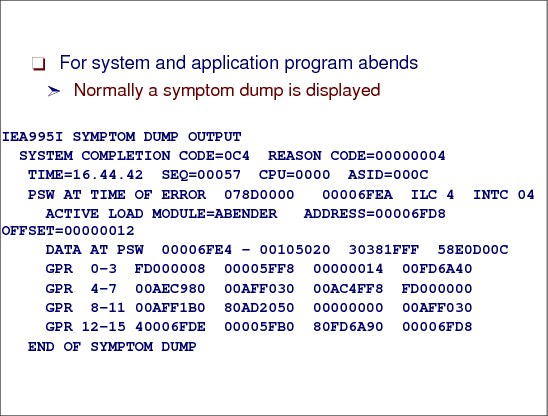
Figure 3-3 SYMPTOM dump data as shown in the MVS SYSLOG and related job log
Symptom dumps
A symptom dump is a system message, either message IEA995I or a numberless message, that provides some basic diagnostic information for diagnosing an abend. Often the symptom dump information can provide enough data to diagnose a problem.
Symptom dumps appear in the following places:
•For SYSUDUMP and SYSABEND ABEND dumps: in message IEA995I, which is routed to the job log.
•For a SYSMDUMP ABEND dump: in message IEA995I in the job log and in the dump header record.
•For an SVC dump: in the dump header record.
•For any dump in a Time Sharing Option/Extensions (TSO/E) environment: displayed on the terminal when requested by the TSO/E PROFILE command with the WTPMSG option.
•In response to a DISPLAY DUMP,ERRDATA operator command, which displays information from SYS1.DUMPxx data sets on direct access.
Symptom dump output
Figure 3-3 shows the symptom dump for an abend X' 0C4' with reason code X'4'. This symptom dump shows that:
•Active load module ABENDER is located at address X'00006FD8'.
•The failing instruction was at offset X'12' in load module ABENDER.
•The address space identifier (ASID) for the failing task was X' 000C'.
If the information in a symptom dump is insufficient, you can capture additional dump data by including specific DD statements, as discussed in the following section.
|
Note: Abend codes starting with U are user abends, and are not issued by z/OS. Any program can issue a user abend. Its meaning is determined by the program. Language Environment (LE) shows these kinds of abends according to the LE option settings because z/OS will not handle them.
|
3.4 Waits, hangs, and loops

Figure 3-4 Wait scenarios
System, subsystem, and application hangs
"Hangs" are usually caused by a task, or tasks, waiting for an event that will either never happen, or an event that is taking an excessive amount of time to occur. If one of the waiting tasks is a fundamental system task, or is holding control of a resource, for example a data set, then other tasks will queue up and wait for the required resource to become available. As more tasks enter the system they will also join the queue until the system eventually stops, or the task causing the contention is cancelled. Unfortunately, by the time the system grinds to a halt, the operating system will no longer process any operator commands, so an IPL will be the only alternative. A system hang is more specifically known as an enabled wait state.
Hangs and loops
One of the difficult things to determine is whether a system or subsystem is in a hung or looping state. While the symptoms in many cases are similar, for example, the inability to process other units of work, or transactions; or the inability to get the system or subsystem to accept commands—the key difference is whether there is CPU and EXCP activity that indicates the system is still performing work.
If no other tasks can be dispatched within a subsystem, and the CPU activity is high, often 100%, this is generally a symptom that you have a loop condition. Loops can usually be categorized as either enabled, disabled or a spin loops.
Loops are caused by a program, application, or subsystem attempting to execute the same instructions over and over again. The most severe loop condition causes the task experiencing the condition to use all available CPU resources, and subsequently no other task is allowed to gain control. The only way to alleviate the problem is to cancel the problem task, or if this is unsuccessful, an IPL is necessary. The three types of loop conditions are:
Enabled Enabled loops are usually caused by a programming error, but do not impact other jobs in the system, unless the looping task is a subsystem, which will generally impact the whole system.
Disabled Disabled loops will not allow an interrupt to be processed, and are generally identified by continuous 100 percent CPU utilization.
Spin Spin loops occur when one processor in a multiple-processor environment is unable to communicate with another processor, or is unable to access a resource being held by another processor.
A CPU entering a disabled loop will often be presented to the operators as a spin loop, where the system will cycle (or spin) through the available CPUs.
There are many tools that can be used to assist with hang or loop problem diagnosis, and many of the system monitoring tools will enable you to interrogate at the transaction or thread level and to cancel or purge the individual unit of work or task associated with the loop.
It is important to remember that the monitoring tools should have a high dispatching priority to enable them to get control when required.
It is good to remember that trace data can be used to assist with loop and hang diagnosis, and even 20 seconds of trace data can help identify a looping sequence and often the associated unit of work or transaction. For example, the CICS Auxtrace facility or CICS internal tracing with all CICS components traced at level 1 and a dump of the suspected problem regions can show via a quick IPCS review the type of problem you are experiencing.
An indication of a dummy wait or no work wait is a PSW of X'070E0000 00000000' and GPRs containing all zeroes. Diagnosis is required for this type of wait only when the system does not resume processing.
Processing slows down
In case of system processing slows—central processor at 100% utilization or a job using a high percentage of central processor storage—use an online monitor such as RMF to determine where the problem originates.
3.5 SLIP command

Figure 3-5 Using SLIP commands
Types of SLIP commands
The SLIP command controls SLIP (serviceability level indication processing). It is a diagnostic aid that intercepts or traps certain system events and specifies what action to take. Using the SLIP command, you can set, modify, and delete SLIP traps. You must specify SET, MOD, or DEL immediately following SLIP, as shown in Figure 3-5.
SLIP command examples
SLIP SET[,options],END - Command for an error event trap (non-PER)
SLIP SET,IF[,options],END - Command for an instruction fetch PER trap
SLIP SET,SBT[,options],END - Command for a successful branch PER trap
SLIP SET,SA|SAS[,options],END - Commands for a storage alteration PER trap
SLIP MOD[,options] - Command to modify an existing trap
SLIP DEL[,options] - Command to delete an existing trap
|
Note: If you specify IF, SBT, SA, or SAS, they must immediately follow SET. Specify END at the end of all SLIP SET commands.
|
Using SLIP commands
Use a SLIP command only at the direction of the system programmer. You can enter a SLIP command as follows:
•On a console with MVS master authority
•On a TSO terminal in OPERATOR mode
•In a TSO CLIST
In the CLIST, use the line continuation character at the end of each line and the END parameter at the end of the last line.
•In an IEACMD00, COMMNDxx, or IEASLPxx parmlib member
While you can enter a SLIP command in any of these members, IBM recommends that you place your SLIP commands in IEASLPxx and enter a SET SLIP=xx command to activate the member. IEACMD00 and COMMNDxx require that a command be on a single line. Also, SLIP may process commands in IEACMD00 and COMMNDxx in any order, but processes commands in IEASLPxx in the order in which they appear.
For a sysplex containing similar systems, certain problems might require identical SLIP traps on those similar systems. To set up these traps, do the following:
•Assign similar names to identical jobs on different systems. The names should form a pattern, such as JOB1, JOB2, JOB3, and so on.
•Create one IEASLPxx member containing the trap you need for the problem.
•Place the member in the shared parmlib data set or in the parmlib data set for each of the similar systems.
•In systems using JES2 or JES3, activate the member or members with the following command entered on one of the systems:
ROUTE *ALL,SET SLIP=xx
3.6 Storage overlays
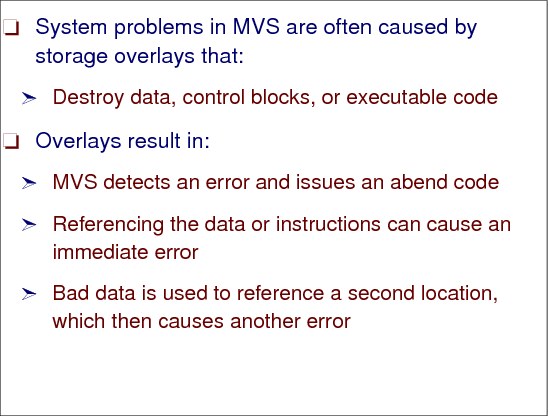
Figure 3-6 Problems with storage overlays
Storage overlays
Storage overlays can affect your system during IPL and during production lifetime. The system can crash if any of the system-related control blocks have been overlaid. Data overlay may be recoverable but you still need to determine why you get the overlay and who is storing data to an area not owned or where data has already been located.
If the data that causes the overlay is still stored at the same storage address, you can use a storage alteration SLIP (SA) to locate the culprit. If the data is stored randomly in a storage area, it’s quite difficult to find the responsible module or program.
If you know what the overlaid storage area should look like in a clean environment, you can use an SA slip to get a dump and to replace the overlaid area by the expected value.
Assuming the storage is overlaid pointed to by the address located at CVT offset 1234, which shows JUNK but it should show GOOD. The following slip will take a dump when the area is overlaid but will also remove the JUNK and add GOOD at the storage area pointed to by the CVT+1234 address.
|
SL SET,SA,ASIDSA=SA,RANGE=(10?+1234?), DATA=(10?+1234?,EQ,D1E4D5D2), A=(REFAFTER,SVCD), REFAFTER=(10?+1234?,EQ,C7D6D6C4),END
|
Figure 3-7 Get a dump and restore correct storage value
System problems
Always be aware of the possibility of a storage overlay when analyzing a dump. System problems in MVS are often caused by storage overlays that destroy data, control blocks, or executable code. The results of such an overlay vary. For example:
•The system detects an error and issues an abend code, yet the error can be isolated to an address space. Isolating the error is important in discovering whether the overlay is in global or local storage.
•Referencing the data or instructions can cause an immediate error such as a specification exception (abend X'0C4') or operation code exception (abend X'0C1').
•The bad data is used to reference a second location, which then causes another error.
When you recognize that the contents of a storage location are not valid and subsequently recognize the bit pattern as a certain control block or piece of data, you generally can identify the erroneous process or component and start a detailed analysis.
Analyzing the damaged area
Once you determine that storage is bad or overlaid, try to identify the culprit. First, determine the extent of the bad data. Look for EBCDIC data or module addresses in storage to identify the owner. Any type of pattern in storage can indicate an error and identify the program that is using the damaged storage. Look at the data on both sides of the obviously bad areas. See if the length of the bad area is familiar; that is, can you relate the length to a known control block length, data size, MVC length? If so, check various offsets to determine their contents and, if you recognize some, try to determine the exact control block.
Common bad addresses
The following are commonly known bad addresses. If you recognize these in the code you are diagnosing, focus your problem source identification on these areas:
•X'000C0000', X'040C0000', or X'070C0000', and one of these addresses plus some offset. These are generally the result of some code using 0 as the base register for a control block and subsequently loading a pointer from 0 plus an offset, thereby picking up the first half of a PSW in the PSA.
Look for storage overlays in code pointed to by an old PSW. These overlays result when 0 plus an offset cause the second half of a PSW to be used as a pointer.
•X'C00', X'D00', X'D20', X'D28', X'D40', and other pointers to fields in the normal functional recovery routine (FRR) stack. Routines often lose the contents of a register during a SETFRR macro expansion and incorrectly use the address of the 24-byte work area returned from the expansion.
•Register save areas. Storage might be overlaid by code doing a store multiple (STM) instruction with a bad register save area address. In this case, the registers saved are often useful in determining the component or module at fault.
3.7 Storage overlay during IPL

Figure 3-8 Analyzing storage overlays
Storage overlays during IPL
When you recognize that the contents of a storage location are not valid and subsequently recognize the bit pattern as a certain control block or piece of data, you can generally identify the erroneous process or component and start a detailed analysis.
WAIT 014
A WAIT 014 is usually the result of an overlay of a critical control block such as the PSA, ASCB, SGTE, or PGTE. Typically the last program running on the CP caused the overlay of the PSA or related control blocks. The system enters a non-restartable wait state.
Dump to analyze overlay
To determine the control block that has been overlaid and the module that did the overlay ask the system programmer to provide a standalone dump. Use IPCS to format the dump and start with the debug.
Identify the failing processor
Enter IP ST WORKSHEET and examine the common system data area (CSD) CPU online mask. There is one bit for each processor online. To determine which processor was taken offline look at:
CSD Available CPU mask: FC00 Alive CPU mask: 7C00 No. of active CPUs: 0005
Where:
FC00 shows the available CPU mask. Bits 0 to 5 are set to one.
7C00 shows the alive CPU mask. Bits 1 to 5 are set to one
This means that CPUs 1 to 5 are active and CPU 0 is the failing processor.
In addition, the IPCS command ST WORKSHEET also shows the automatic CPU recovery (ACR) pair leading to failing and recovery processors.
Identify the failing module and overlaid control block
Examine the last program interrupt on the failing processor:
Program old PSW at PSA+x’28’ identifies the failing module
ILIC (Instruction Length Interrupt Counter) is at PSA+x’8C’
Use the PSW address and the ILC to determine the offset in the failing module. Examine that code to obtain the control block field that was being referenced. This is typically a PSA field. If possible, use known/valid control block values to determine the extent of the overlay. For detailed control block information see the volumes on z/OS MVS Data Areas, as follows:
•z/OS MVS Data Areas, Volume 1 (ABEP - DALT), GA22-7581
•z/OS MVS Data Areas, Volume 2 (DCCB - ITZYRETC), GA22-7582
•z/OS MVS Data Areas, Volume 3 (IVT - RCWK), GA22-7583
•z/OS MVS Data Areas, Volume 4 (RD - SRRA), GA22-7584
•z/OS MVS Data Areas, Volume 5 (SSAG - XTLST), GA22-7585
Provide a trap to catch the overlayer
A storage alteration (SA) trap could be supplied to catch the overlayer.
|
Note: The trap should only be set on a field that is not ordinarily updated.
|
Create a SLIP trap to wait when the PSA+x’200’ is overlaid, as follows:
SLIP SET,SA,ASA=SA,A=WAIT,RA=(200,203),END
ASA=SA prevents the trap from hitting on a data space update.
Diagnosing the cause
From the SA dump of the WAIT 014, determine the Window of Error by:
•Examining the system trace to identify the last program that successfully ran on the failing CP.
•Identify the failing instruction address via LCCAPPSW, LCCA+x’88’.
These two events define the Window of Error, and the code that executed in the Window probably caused the error.
3.8 Storage overlay in a production system
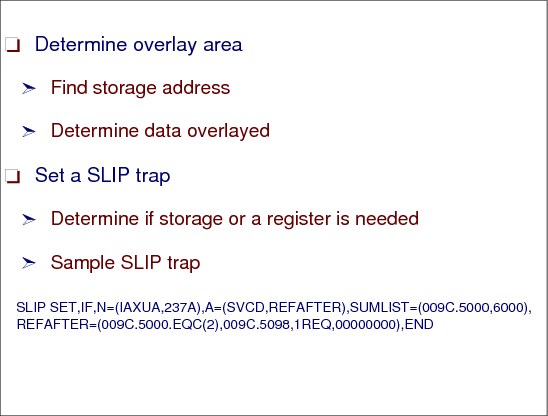
Figure 3-9 Setting a SLIP trap for an overlay
Storage overlay SLIP trap
A dump contains information about an error that can help you identify a problem type. Using interactive problem control system (IPCS), the information about the error is formatted to provide a quick and effective method of retrieval. Sometimes system problems in MVS are caused by storage overlays that destroy data, control blocks, or executable code.
Depending on the overlaid area, it could be possible to repair the overlaid control block or storage information. To fix the overlay you need to know the storage address and the data that has been overlaid. The SLIP definition provides the possibility to check the control block using the indirect pointing.
Use a powerful option where SLIP will modify the storage or register as part of the action taken when the PER trap hits.
Use with caution and ensure accuracy. This will allow correction of an overlay or improperly specified register or storage, but if the target is not correct, or the refresh data is incorrect, further potential damage may occur.
The following SLIP shows an example of how to get a dump and repair the overlaid area. The SLIP indicates the module name is located in ASID X’9C’ at offset x’5000’, and refreshes the first two bytes to zeroes and sets R1=0.
SLIP SET,IF,N=(IAXUA,237A),A=(SVCD,REFAFTER),SUMLIST=(009C.5000,6000),
REFAFTER=(009C.5000.EQC(2),009C.5098,1REQ,00000000),END
3.9 SLIP to catch the overlayer
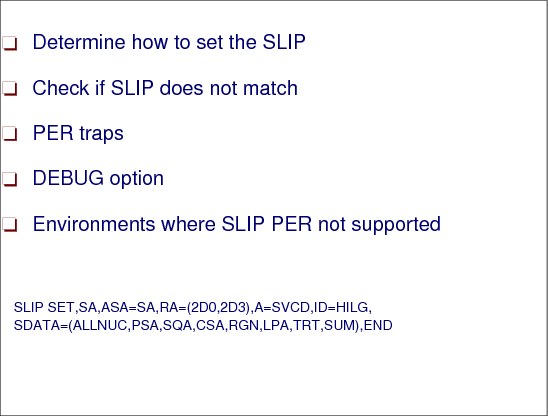
Figure 3-10 Setting SLIP traps
Sample SLIP trap
The following SLIP is an example how to catch the program overlaying the storage area on offset x’2D0’ length 4 bytes.
SLIP SET,SA,ASA=SA,RA=(2D0,2D3),A=SVCD,ID=HILG,
SDATA=(ALLNUC,PSA,SQA,CSA,RGN,LPA,TRT,SUM),END
Determining if SLIP matches
Check the following to see whether the SLIP is not matching:
•Issue a D SLIP=XXXX (where XXXX is the trap id) to verify that the trap was set as intended.
•With the LPAMOD or PVTMOD keywords, verify that it specifies the load module name, not the CSECT name.
•Be sure that MODE=HOME,JOBNAME= or ASID is specified with PVTMOD for a module that is loaded into private storage.
•PER traps:
– Check the PSA+X'98' for the residual PER address stored by the hardware when the PER interrupt is presented. The PER trap is not active if 0 or the PER bit is not on in the PSW.
– Check control registers 9, 10, and 11 to determine whether they are set correctly. These registers are the STATUS REGS, as follows:
• CR 9 - PER EVENT TYPE
• CR 10 - BEGIN RANGE
• CR 11 - END RANGE
|
Note: Any SLIP trap affects system performance, but PER traps can have a measurable effect on performance. Therefore, use conditions to filter the events being checked for matches, especially for PER traps. Improper use of PER traps can cause severe performance problems.
|
•Use the DEBUG option with A=TRACE to see which keyword is not matching on the SLIP trap. With DEBUG a GTF record will be cut regardless of whether the trap matches, and will contain a key indicating which keyword did not match.
For a SLIP SET trap, the DEBUG option allows you to determine why a trap is not working as you expected by indicating which of the conditions you established is not being met. DEBUG provides trap information each time the trap is tested rather than just when it matches.
The generalized trace facility (GTF) and its trace option for SLIP records must be active. Each DEBUG trace record contains SLIP information plus two bytes: the first byte contains a value indicating the failing parameter and the second byte contains zero.
•With PVTMOD, A=IGNORE, traps will not match if the local lock is not available at the time the PER interrupt is presented and SLIP module IEAVTSL2 is checking for a match. See DOC APAR OY37341.
SLIP has a default match limit of 1 on all traps that specify, or default to, ACTION=SVCD. The match limit can be changed by the MATCHLIM parameter when setting the SLIP trap. You can further qualify the SLIP trap by using other parameters, such as DATA and PVTMOD.
SLIP PER environment
SLIP PER is not active or is not supported in the following environments:
•Program check, machine check, and restart FLIHs
•Some RSM modules
•Dispatcher
•Lock manager (cannot SLIP on lock words)
•DAT-OFF code (SLIP only supports virtual addresses)
•Any code that turns the PER bit off in the PSW
If any of the above cases apply, use the CP address compare hardware function or a software detection trap.
..................Content has been hidden....................
You can't read the all page of ebook, please click here login for view all page.