

z/OS trace processing
Another useful source of diagnostic data is the trace. Tracing collects information that identifies ongoing events that occur over a period of time. Some traces are running all the time so that trace data will be available in the event of a failure. Other traces must be explicitly started to trace a defined event.
In this chapter, the following trace activity is described:
•GTF trace
•Component trace
•Master trace
•GFS trace
•System trace
•SMS tracing
5.1 z/OS trace facilities
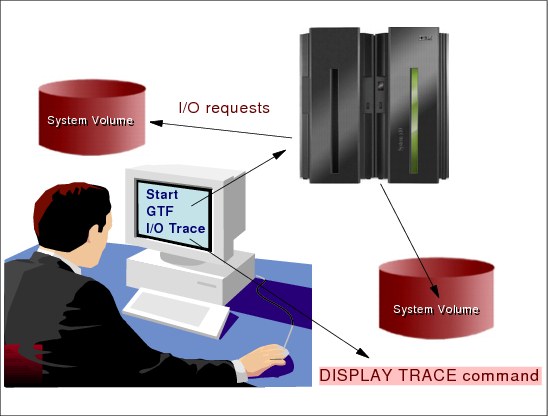
Figure 5-1 z/OS trace facilities
GTF trace facility
The generalized trace facility (GTF) is a service aid you can use to record and diagnose system and program problems. GTF is part of the MVS system product, and you must explicitly activate it by entering a START GTF command.
Use GTF to record a variety of system events and program events on all of the processors in your installation. If you use the IBM-supplied defaults, GTF lists many of the events that system trace lists, showing minimal data about them. However, because GTF uses more resources and processor time than system trace, IBM recommends that you use GTF when you experience a problem, selecting one or two events that you think might point to the source of your problem. This will give you detailed information that can help you diagnose the problem. You can trace combinations of events, specific incidences of one type of event, or user-defined program events that the GTRACE macro generates. For example, you can trace:
•Channel programs and associated data for start and resume subchannel operations, in combination with I/O interruptions
•I/O interruptions on one particular device
•System recovery routine operations
|
Note: The events that GTF traces are specified as options in a parmlib member. You can use the IBM supplied parmlib member or provide your own. Details of GTF operation, which include storage that is needed, where output goes, and recovery for GTF are defined in a cataloged procedure in SYS1.PROCLIB.
|
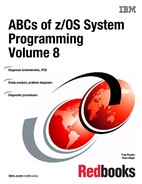
I/O trace
GTF builds an I/O record when an I/O interruption occurs and TRACE=SYSM, TRACE=SYS, TRACE=IO, or TRACE=IOP are the GTF options in effect. To trace PCI I/O interruptions, TRACE=PCI must also be in effect.
SYS1.TRACE
When you start GTF, a trace output data set is created and has the name SYS1.TRACE. The data set resides on a DASD that is large enough for the data set to contain 20 physical blocks. After completely filling the 20 physical blocks, GTF will overlay previously written records with new trace records, starting at the beginning of the output data set.
I/O requests
When you start GTF, one of the options is to trace I/O requests. GTF then requests recording of all nonprogram-controlled I/O interruptions. Unless you also specify the PCI trace option, GTF does not record program-controlled interruptions.
Using the DISPLAY TRACE command
To display the current trace option in effect issue the MVS D TRACE command. Figure 5-2 shows an example of the output generated by the D TRACE command. It shows that we have system trace (ST) enabled, with 256K allocated for the system trace table on each processor and 3584K allocated to the system trace table buffers. Address space (AS) tracing is ON and branch tracing is OFF, as is explicit software tracing. Master tracing is ON with a master trace table size of 24K. This also displays the status of component and sub-component traces.
|
IEE843I 19.30.33 TRACE DISPLAY 177
SYSTEM STATUS INFORMATION
ST=(ON,0256K,03584K) AS=ON BR=OFF EX=ON MT=(ON,024K)
COMPONENT MODE COMPONENT MODE COMPONENT MODE COMPONENT MODE
--------------------------------------------------------------
SYSGRS MIN SYSTCPRT OFF SYSJES2 OFF SYSANT00 MIN
SYSANT01 MIN SYSRRS MIN SYSSPI OFF SYSJES OFF
SYSSMS OFF SYSOPS ON SYSXCF ON SYSLLA MIN
SYSXES ON SYSTTRC OFF SYSTCPDA OFF SYSRSM OFF
SYSAOM OFF SYSVLF MIN IRLM OFF SYSTCPIP OFF
SYSLOGR ON SYSOMVS ON SYSWLM MIN SYSTCPIS OFF
SYSTCPRE OFF SYSIOS MIN JRLM OFF SYSIEFAL ON
|
Figure 5-2 Display trace command output
Issue D TRACE,COMP=SYSOMVS, and the output is shown in (Figure 5-3).
|
IEE843I 19.36.21 TRACE DISPLAY 490
SYSTEM STATUS INFORMATION
ST=(ON,0256K,03584K) AS=ON BR=OFF EX=ON MT=(ON,024K)
COMPONENT MODE BUFFER HEAD SUBS
--------------------------------------------------------------
SYSOMVS ON 0004M
ASIDS *NONE*
JOBNAMES *NONE*
OPTIONS ALL
WRITER *NONE*
|
Figure 5-3 Display trace,comp=tracename output
5.2 GTF trace definitions

Figure 5-4 GTF processing
Start GTF trace
Use a GTF trace to show system processing through events occurring in the system over time. The installation controls which events are traced. GTF tracing uses more resources and processor time than a system trace. Use GTF when you are familiar enough with the problem to pinpoint the one or two events required to diagnose your system problem. GTF can be run to an external data set as well as a buffer.
GTF procedure
When you activate GTF, it operates as a system task, in its own address space. The only way to activate GTF is to enter a START GTF command from a console with master authority. Using this command, the operator selects either the IBM or your cataloged procedure for GTF. The cataloged procedure defines GTF operation; you can accept the defaults that the procedure establishes, or change the defaults by having the operator specify certain parameters on the START GTF command.
Because GTF sends messages to a console with master authority, enter the command only on a console that is eligible to be a console with master authority. Otherwise, you cannot view the messages from GTF that verify trace options and other operating information.
IBM supplies the GTF cataloged procedure, which resides in SYS1.PROCLIB. This procedure defines GTF operation, including storage needed, where output is to go, recovery for GTF, and the trace output data sets. Figure 5-5 on page 119 shows the format of the IBM-supplied GTF procedure.
|
//GTF PROC MEMBER=GTFPARM
//IEFPROC EXEC PGM=AHLGTF,PARM=’MODE=EXT,DEBUG=NO,TIME=YES’,
// TIME=1440,REGION=2880K
//IEFRDER DD DSNAME=SYS1.TRACE,UNIT=SYSDA,SPACE=(TRK,20),
// DISP=(NEW,KEEP)
//SYSLIB DD DSN=SYS1.PARMLIB(&MEMBER),DISP=SHR
|
Figure 5-5 GTF procedure
SYS1.PARMLIB member for GTF
GTFPARM provides default or installation-defined trace options to control the generalized trace facility (GTF). The member is read only when the operator (or an automatic command) issues START GTF. GTFPARM is not used during system initialization.
The member name on the START GTF command can be the same as the IBM-supplied cataloged procedure, GTF. The PROC statement of that procedure identifies GTFPARM as the member from which GTF will get its trace parameters. If the installation wants to place the GTFPARM member in a data set other than SYS1.PARMLIB, specify the alternate data set in the SYSLIB DD statement and then specify a member from that PDS using the MEMBER keyword, as shown in Figure 5-4 on page 118. If the installation wants to substitute another member in place of GTFPARM, as shown in the figure, the operator may enter the replacement member name on the START command with the MEMBER keyword.
Trace data to external devices
The two primary locations that are used to store GTF trace data are as follows:
•A data set on DASD
•Internal storage
The benefit of writing to internal storage is that if the trace is being taken to be reviewed in conjunction with a dump, the GTF in-storage buffers will be dumped along with the address space. You will have trace and dump data taken at the same time, and this can be reviewed using IPCS.
|
Note: If you need to trace for an extended period of time, then writing to an external device is advisable.
|
5.3 Implementing GTF trace
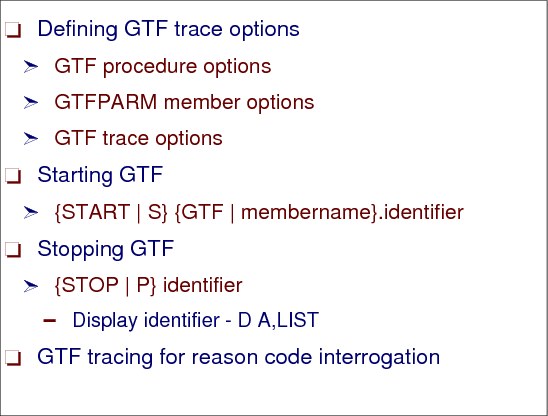
Figure 5-6 Implementing GTF tracing
Defining the GTF trace options
Some GTF trace options also require keywords. If you specify options requiring keywords in the member or data set containing the predefined options, it must also contain the associated keywords. The GTF options can be specified through either system prompting in response to the START GTF command or in a predefined parmlib member or data set member. However, GTF will not use certain combinations of options. Figure 5-7 shows the GTF trace option meanings.
|
SYSM Selected system events
USR User data that the GTRACE macro passes to GTF
TRC Trace events associated with GTF itself
DSP Dispatchable units of work
PCI Program-controlled I/O interruptions
SRM Trace data associated with the system resource manager (RSM)
|
Figure 5-7 GTF trace options
|
Note: For these combinations, and regarding other GTF options, see z/OS MVS Diagnosis: Tools and Service Aids, SY28-1085.
|
GTF procedure options
We recommend that GTF be started with the following parameters, which are specified in the GTF procedure in SYS1.PROCLIB:
PARM=’MODE(INT)’ and REGION=2880K
Options specified on the PARM parameter specify where GTF writes trace data and the amount of storage needed for GTF to collect and save trace data in various dump types (Figure 5-8).
|
MODE={INT|EXT|DEFER}
SADMP={nnnnnnK|nnnnnnM|40K}
SDUMP={nnnnnnK|nnnnnnM|40K}
NOPROMPT
ABDUMP={nnnnnnK|nnnnnnM|0K}
BLOK={nnnnn|nnnnnK|nnnnnM|40K}
SIZE = {nnnnnnK|nnnnnnM|1024K}
TIME=YES
DEBUG={YES|NO}
|
Figure 5-8 GTF parameters on the PARM= in the GTF procedure
The GTF parameters SADMP, SDUMP, ABDUMP and BLOK parameters should all be set to at least 10 MB.
GTFPARM member
Figure 5-7 on page 120 shows the IBM-supplied GTFPARM parmlib member, which contains the GTF trace options, as follows:
TRACE=SYSM,USR,TRC,DSP,PCI,SRM
|
Note: The member containing predefined trace options does not have to reside in the parmlib member. GTF will accept any data set specified in the SYSLIB DD statement of the cataloged procedure, or in the START command, as long as that data set's attributes are compatible with those of SYS1.PARMLIB.
|
Starting GTF
To invoke GTF, the operator issues the following START command:
{START|S}{GTF|membername}.identifier
After the operator enters the START command, GTF issues message AHL100A or AHL125A to allow the operator either to specify or to change trace options. If the cataloged procedure or START command did not contain a member of predefined options, GTF issues message AHL100A so the operator may enter the trace options you want GTF to use. If the procedure or command did include a member of predefined options, GTF identifies those options by issuing the console messages AHL121I and AHL103I. Then you can either accept these options, or reject them and have the operator respecify new options. Figure 5-9 on page 122 shows the sequence of messages that appear on the console when starting GTF.
|
START GTF.EXAMPLE1
AHL121I TRACE OPTION INPUT INDICATED FROM MEMBER GTFPARM OF PDS SYS1.PARMLIB
TRACE=SYSM,USR,TRC,DSP,PCI,SRM
AHL103I TRACE OPTIONS SELECTED--SYSM,USR,TRC,DSP,PCI,SRM
*451 AHL125A RESPECIFY TRACE OPTIONS OR REPLY U
REPLY 451,U
AHL031I GTF INITIALIZATION COMPLETE
|
Figure 5-9 GTF start-up messages
Stopping GTF
The operator can enter the STOP command at any time during GTF processing. The amount of time you let GTF run depends on your installation and the problem you are trying to capture, but a common time is between 15 and 30 minutes.
To stop GTF processing, have the operator enter the STOP command. This command must include either the GTF identifier specified on the START command, or the device number of the GTF trace data set if you specified MODE=EXT or MODE=DEFER to direct output to a data set.
If you are not sure of the identifier, or the device number of the trace data set, ask the operator to enter the DISPLAY A,LIST command. Figure 5-10 shows the result of this command and the GTF identifier displayed is EVENT1.
|
DISPLAY A,LIST
IEE114I 14.51.49 2005.181 ACTIVITY FRAME LAST F E SYS=SY1
JOBS M/S TS USERS SYSAS INITS ACTIVE/MAX VTAM OAS
00000 00003 00000 00016 00000 00000/00000 00000
LLA LLA LLA NSW S VLF VLF VLF NSW S
JES2 JES2 IEFPROC NSW S
GTF EVENT1 IEFPROC NSW S
.....................
|
Figure 5-10 D A,LIST command
The operator must enter the STOP command at a console with master authority. The general format of the command is:
{STOP|P} identifier
When the STOP command takes effect, the system issues message AHL006I. If the system does not issue this message, then GTF tracing continues, remaining active until a STOP command takes effect, or until the next initial program load (IPL). When this happens, you will not be able to restart GTF tracing. In this case, you can use the FORCE ARM command to stop GTF. If there were several functions started with the same identifier on the START command, using the same identifier on the STOP command will stop all those functions.
GTF tracing for reason code interrogation
In some instances your software support provider may ask you to capture a GTF trace that will contain all the reason codes issued by a particular job. This is more likely if the reason code is not reported externally. If you choose to look at such a GTF trace, be aware that many reason codes are issued validly and do not represent real errors (that is, reason codes that indicate file not found are usually quite valid).
Prior to setting the slip below you would need to start GTF with options TRACE=SLIP. The slip that would be set is:
SLIP SET,IF,A=TRACE,RANGE=(10?+8C?+F0?+1f4?),TRDATA=(13R??+B0,+B3),END
After recreating the problem, stop GTF and format the output using the IPCS command GTFTRACE.
Another way to stop GTF is provided by our slip processing as follows:
SL SET,IF,L=(IGC0003E,0), A=(SVCD,STOPGTF), DATA=(10%+64%+22C,EQ,00000000), END
This slip will take a dump when we enter module IGC0003E at offset 0 and the compare statement in the DATA option is fulfilled. In addition it will stop the GTF process. If you have more than one GTF active you need to provide the GTF process name
If we have a problem in our system which is not related to only one component, it is important to get the docs for all components in question. Have a look at Figure 5-11 on page 124, which shows how to gather documentation for a TCPIP and USS related problem.
|
1. TURN ON CTRACE for TCPIP
TRACE CT,ON,COMP=SYSTCPIP,SUB=(tcpipprocname)
R XX,OPTIONS=(PFS,TCP,SOCKET,SOCKAPI,INTERNET),END
2. TURN ON PACKET TRACE
TRACE CT,ON,COMP=SYSTCPDA,SUB=(tcpipprocname, tsouserid)
Reply to the following message:
ITT006A SPECIFY OPERAND(S) FOR TRACE CT COMMAND
r xx,end
V TCPIP,tcpipprocname,PKT,ON,IP=xx.xx.xx.xx
3. TURN ON OMVS CTRACE
TRACE CT,64M,COMP=SYSOMVS
R xx,OPTIONS=(ALL),END
4. Setup Dump of TSOUSerid, TCPIP,OMVS and their dataspaces:
DUMP COMM=(Dump Title)
R xx,SDATA=(ALLNUC,CSA,LPA,LSQA,RGN,SWA,SQA,TRT),CONT
R xx,JOBNAME=(tcpproc,tsouserid,OMVS),CONT
R xx,DSPNAME=('OMVS'.*,'tcpproc'.TCPIPDS1),CONT
this will leave an outstanding WTOR that we will reply to
take the dump
5. recreate problem.
6. Immediately reply to take the dump
R xx,END
7. TURN OFF PACKET TRACE
V TCPIP,tcpipprocname,PKT,OFF,IP=xx.xx.xx.xx
TRACE CT,OFF,COMP=SYSTCPDA,SUB=(tcpipprocname)
8. Stop Ctrace comp(SYSTCPIP):
TRACE CT,OFF,COMP=SYSTCPIP,SUB=(tcpipprocname)
9. Stop OMVS CTRACE
TRACE CT,OFF,COMP=SYSOMVS
|
Figure 5-11 TCPIP and USS documentation collection
5.4 Component trace (CTRACE)

Figure 5-12 Implementing component trace (CTRACE)
Component trace
The component trace service provides a way for MVS components to collect problem data about events. Each component that uses the component trace service has set up its trace in a way that provides the unique data needed for the component.
A component trace provides data about events that occur in the component. The trace data is intended for the IBM Support Center, which can use the trace to:
•Diagnose problems in the component
•See how the component is running
If the IBM Support Center requests a trace, the Center might specify the options, if the component trace uses an OPTIONS parameter in its parmlib member or REPLY for the TRACE CT command. Several options are:
SYSAPPC SYSDLF SYSDSOM SYSGRS SYSIEFA SYSIOS SYSJES SYSjes2 SYSLLA SYSLOGR SYSOMVS SYSOPS SYSRRS SYSRSM SYSTTRC SYSSPI SYSVLF SYSWLM SYSXCF SYSXES
You will typically use component trace while recreating a problem. The installation, with advice from the IBM Support Center, controls which events are traced for a system component. GTF does not have to be active to run a component trace.
External writer for tracing
Transaction trace supports the use of an external writer for processing transaction trace records. An external writer can be specified on the initial command that activates transaction trace, or specified standalone while transaction trace is active. Transaction trace uses the MVS TRACE command with the TT keyword to start an external writer. For example:
trace tt,wtr=prt1
Component trace messages are issued in response to this command. Transaction trace writes trace data in a transaction trace data space in the trace address space. If an external writer has been defined, the record is also written to the external writer. IPCS is used to view the transaction trace records.
Transaction trace external writer processing can be stopped with the use of the WTR=OFF keyword. For example:
trace tt,wtr=off
Component trace messages are issued in response to this command.
The transaction trace TRACE TT command allows the transaction trace data space size to be changed. The data space can be from 16 K to 999 K or 1 MB to 32 MB. For example:
trace tt,bufsiz=2m
The following message is issued:
ITZ002I 'BUFSIZ' IS SET TO 0002M
|
Note: In the example in Figure 5-12 on page 125, the operator is requesting a component trace for SYSOMVS and the external writer writes the data to a DASD data set named OMVS.TRACE
|
5.5 Implementing component trace
Figure 5-13 Options for implementing component trace
Parmlib member definitions
The CTncccx parmlib member specifies component trace options. There is a table in z/OS MVS Diagnosis: Tools and Service Aids, SY28-1085, that shows whether a component has a parmlib member. It indicates whether the member is a default member needed at system or component initialization, and whether the component has default tracing. Some components run default tracing at all times when the component is running; default tracing is usually minimal and covers only unexpected events. Other components run traces only when requested. When preparing your production SYS1.PARMLIB system library, do the following:
•Make sure the parmlib contains all default members identified in the table. If the parmlib does not contain the default members at initialization, the system issues messages. The table contains the following members:
SYSAPPC SYSDLF SYSDSOM SYSGRS SYSIEFA SYSIOS SYSJES SYSjes2 SYSLLA SYSLOGR SYSOMVS SYSOPS SYSRRS SYSRSM SYSTTRC SYSSPI SYSVLF SYSWLM SYSXCF SYSXES
•Make sure that the IBM-supplied CTIITT00 member is in the parmlib. PARM=CTIITT00 can be specified on a TRACE CT command for a component trace that does not have a parmlib member; CTIITT00 prevents the system from prompting for a REPLY after the TRACE CT command. In a sysplex, CTIITT00 is useful to prevent each system from requesting a reply.
Trace options for support center
If the IBM Support Center requests a trace, the Center might specify the options, if the component trace uses an OPTIONS parameter in its parmlib member, or REPLY for the TRACE CT command. You must specify all options you would like to have in effect when you start a trace. Options specified for a previous trace of the same component do not continue to be in effect when the trace is started again. If the component has default tracing started at initialization by a parmlib member without an OPTIONS parameter, you can return to the default by doing one of the following:
•Stop the tracing with a TRACE CT,OFF command.
•Specify OPTIONS() in the REPLY for the TRACE CT command or in the CTncccxx member.
Collecting trace records
Depending on the component, the potential locations of the trace data are:
•In address-space buffers, which are obtained in a dump
•In data-space buffers, which are obtained in a dump
•In a trace data set or sets, if supported by the component trace
If the trace records of the trace you want to run can be placed in more than one location, you need to select the location. For a component that supports trace data sets, you should choose trace data sets for the following reasons:
•Because you expect a large number of trace records
•To avoid interrupting processing with a dump of the trace data
•To keep the buffer size from limiting the amount of trace data
•To avoid increasing the buffer size
Starting component trace
Select how the operator is to request the trace. The component trace is started by either of the following:
•A TRACE CT operator command without a PARM parameter, followed by a reply containing the options
•A TRACE CT operator command with a PARM parameter that specifies a CTncccxx parmlib member containing the options
To start a component trace, the operator enters a TRACE operator command on the console with MVS master authority. The operator replies with the options that you specified. Instead of using ON on the START command you can provide a trace buffer size, depending on the component you would like to start the trace, as follows:
trace ct,on,comp=sysxcf
* 21 ITT006A ....
r 21,options=(serial,status),end
* 21 ITT006A ....
r 21,options=(serial,status),end
This example requests the same trace using parmlib member CTWXCF03. When TRACE CT specifies a parmlib member, the system does not issue message ITT006A.
trace ct,on,comp=sysxcf,parm=ctwxcf03
It is possible to provide the CTRACE buffer size request on the start command. The following shows the START TRACE command for USS requesting 64 MB:
trace ct,64M,comp=sysomvs
5.6 Component trace for System Logger
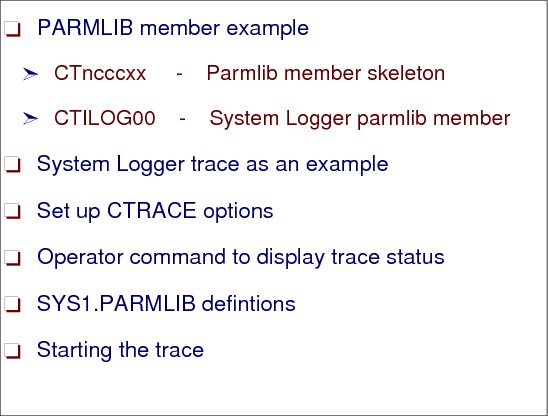
Figure 5-14 Setting up component trace for System Logger
Parmlib member example
Use a CTnLOGxx parmlib member to specify the Logger ctrace options and create the CTnLOGxx parmlib member on each system in the plex. Use the SAME NAME parmlib member on each system.
An example for a parmlib definition for System Logger follows:
Start the SYSLOGR trace:
TRACE CT,ON,COMP=SYSLOGR,PARM=CTnLOGxx
Where:
LOG is the ccc, 00 is the xx, and L is the n. For some components, you need to identify the component's CTncccxx member in another parmlib member. See the parmlib member listed in the default member column in the table in z/OS MVS Diagnosis: Tools and Service Aids, SY28-1085.
Tracing System Logger
More subsystems are now using the z/OS System Logger for logging activity that can be used during unit-of-recovery processing. This data was previously managed by the subsystems, such as CICS, DB2, and MQ, but now the System Logger address space (IXGLOGR) manages the system and subsystem log data. This can reside in a Coupling Facility, or on DASD.
CTRACE options
Problems with Logger process will often require some additional trace data, which can be collected by setting up the CTRACE for System Logger data as follows:
•Issue the following command to display the current SYSLOGR trace status:
D TRACE,COMP=SYSLOGR
•To update the CTRACE component for the z/OS System Logger, edit the SYS1.PARMLIB member CTILOGxx. CTILOG00 is the supplied Logger CTRACE member.
•Recommended Logger CTRACE options:
•TRACEOPTS ON
•BUFSIZE(256M)
•OPTIONS('CONNECT','DATASET','SERIAL','STORAGE',
•'LOGSTRM',MISC','RECOVERY','LOCBUFF')
Parmlib definitions
Figure 5-15 shows the CTILOGxx parmlib member and the specified options.
|
TRACEOPTS ON
BUFSIZE(8M)
OPTIONS('CONNECT','DATASET','SERIAL','STORAGE',
'LOGSTRM','MISC','RECOVERY','LOCBUFF')
|
Figure 5-15 CTILOGxx parmlib member
For CTRACE, we recommend a 10 MB buffer size. The default is 2 MB.
Operator command to display status
Figure 5-16 shows the results of the DISPLAY TRACE command for component SYSLOGR.
|
IEE843I 01.11.36 TRACE DISPLAY 967
SYSTEM STATUS INFORMATION
ST=(ON,0064K,00128K) AS=ON BR=OFF EX=ON MT=(ON,024K)
COMPONENT MODE BUFFER HEAD SUBS
--------------------------------------------------------------
SYSLOGR MIN 0002M
ASIDS *NONE*
JOBNAMES *NOT SUPPORTED*
OPTIONS MINIMAL TRACING ONLY
WRITER *NONE*
|
Figure 5-16 DISPLAY TRACE,COMP=SYSLOGR output
Take a dump
Often times, a dump of the Logger address space is required to diagnose a hang or other non-abend conditions. Logger provides sample IEADMCxx members that can be copied over to SYS1.PARMLIB for dumping Logger and other associated address spaces:
– IEADMCLC - Suspected problem area in Logger/CICS
– IEADMCLG - Suspected problem area in Logger/GRS
– IEADMCLS - General Logger problem
– IEADMCLX - Suspected problem area in Logger/XCF
Starting the trace
This parmlib member will be used when you issue the following command:
TRACE CT,COMP=SYSLOGR,PARM=CTILOGxx
There is minimal overhead with the MVS Logger CTRACE.
To start the CTRACE for the z/OS Logger and change the trace parameters or buffer size, you can issue:
TRACE CT,8M,COMP=SYSLOGR
R xx,OPTIONS=(ALL),END
Taking a dump
SYS1.SAMPLIB(IEADMCLC)
TITLE=(DUMP OF LOGGER, RLS AND CICS),
JOBNAME=(IXGLOGR,PCAUTH,SMSVSAM,IYOT*,XCFAS),
DSPNAME=('SMSVSAM'.*,'IXGLOGR'.*,'XCFAS'.*),
SDATA=(COUPLE,ALLNUC,LPA,LSQA,PSA,SWA,RGN,SQA,
TRT,CSA,GRSQ,XESDATA,SUM)
to get dumps from remote systems
TITLE=(DUMP OF LOGGER AND GRS ACROSS SYSPLEX),
JOBNAME=(IXGLOGR,XCFAS,GRS),
DSPNAME=('IXGLOGR'.*,'XCFAS'.*,'GRS'.*),
SDATA=(COUPLE,ALLNUC,LPA,LSQA,PSA,SWA,RGN,SQA,
TRT,CSA,GRSQ,XESDATA,SUM),
REMOTE=(SYSLIST=*('IXGLOGR','XCFAS','GRS'),DSPNAME,SDATA)
5.7 Master trace

Figure 5-17 Master trace
Master trace
Master trace maintains a table of the system messages that are routed to the hardcopy log. This creates a log of external system activity, while the other traces log internal system activity. Master trace is activated automatically at system initialization, but you can turn it on or off using the TRACE command.
Master trace can help you diagnose a problem by providing a log of the most recently issued system messages. For example, master trace output in a dump contains system messages that may be more pertinent to your problem than the usual component messages issued with a dump.
Use the master trace to show the messages to and from the master console. Master trace is useful because it provides a log of the most recently-issued messages. These can be more pertinent to your problem than the messages accompanying the dump itself. Master tracing is usually activated at IPL time and the data can be reviewed with IPCS and is saved when an SVC dump or stand-alone dump is taken.
Parmlib definitions
At initialization, the master scheduler sets up a master trace table of 24 kilobytes. A 24-kilobyte table holds about 336 messages, assuming an average length of 40 characters.You can change the size of the master trace table or specify that no trace table be used by changing the parameters in the SCHEDxx member in SYS1.PARMLIB.
Starting the master trace
You can change the size of the master trace table using the TRACE command. For example, to change the trace table size to 500 kilobytes, enter:
TRACE MT,500K
Start, change, or stop master tracing by entering a TRACE operator command from a console with master authority. For example, to start the master tracing:
TRACE MT
To stop master tracing:
TRACE MT,OFF
You can also use the TRACE command to obtain the current status of the master trace. The system displays the status in message IEE839I. For example, to ask for the status of the trace, enter:
TRACE STATUS
Master trace table output
The following shows a sample of the master trace table. This is an in-storage copy of the system log (SYSLOG) and the amount of data contained in the table is dependant on the size of the table. Figure 5-18 shows a sample of the data contained in the Master Trace (MTRACE).
|
2003062 03:48:04.21 STC08076 00000090 ITSO10 SYS 1: READY FOR COMMUNICATION
2003062 03:48:33.24 STC04022 00000094 >+CSQX500I =MQU1 CSQXRCTL Channel MQM1.ITSO810 started
2003062 03:49:03.39 STC04022 00000094 >+CSQX202E =MQU1 CSQXRCTL Connection or remote listener
152 00000094 > channel MQM1.ITSO810,
152 00000094 > connection 9.9.9.90,
152 00000094 > TRPTYPE=TCP RC=00000468
2003062 03:49:03.42 STC04022 00000094 >+CSQX599E =MQM1 CSQXRCTL Channel MQM1.ITSO810 ended
2003062 03:50:01.85 ZZ4NM002 00000294 $RALL,R=*,D=W91A.*,Q=789
2003062 03:50:01.89 ZZ4NM002 00000084 $HASP683 NO JOBS OR DATA SETS REROUTED
|
Figure 5-18 IPCS MTRACE output
5.8 GFS trace
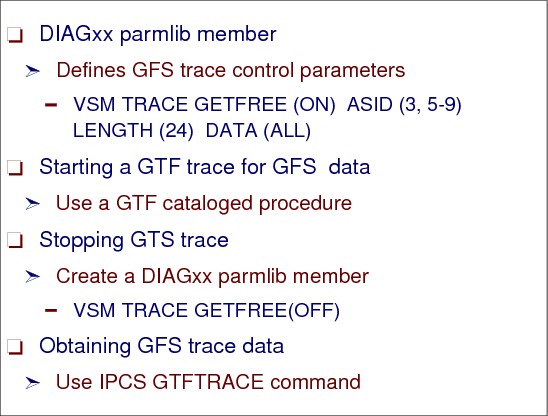
Figure 5-19 GFS trace
GFS trace
GFS trace is a diagnostic tool that collects information about the use of the GETMAIN, FREEMAIN, or STORAGE macro. You can use GFS trace to analyze the allocation of virtual storage and identify users of large amounts of virtual storage. Use the generalized trace facility (GTF) to get the GFS trace data output.
DIAGxx parmlib member
The DIAGxx parmlib member syntax is shown in Appendix C.1.1, “DIAGxx parmlib member syntax” on page 362.
IBM provides the following parmlib members:
DIAG00 (default) Sets storage tracking on and GFS trace off.
DIAG01 Sets storage tracking on but does not change GFS trace settings.
DIAG02 Sets storage tracking off but does not change GFS trace settings.
The following procedure explains how to request a GFS trace:
1. In the DIAGxx parmlib member, set the VSM TRACE GETFREE parameter to ON and define the GFS trace control data.
a. The following DIAGxx parmlib member starts GFS trace and limits the trace output to requests to obtain or release virtual storage that is 24 bytes long and resides in address spaces 3, 5, 6, 7, 8, and 9, as follows:
VSM TRACE GETFREE (ON) ASID (3, 5-9) LENGTH (24) DATA (ALL)
|
Note: If you want the IPCS GTFTRACE output to be formatted, you must include the TYPE and FLAGS data items on the DATA keyword specification of the DIAGxx parmlib member.
|
You will need another DIAGxx parmlib member defined to stop GFS tracing specifying:
VSM TRACE GETFREE (OFF)
2. Ask the operator to enter the SET DIAG=xx command to activate GFS trace using the definitions in the DIAGxx parmlib member.
3. Start a GTF trace (ask the operator to enter a START membername command on the master console). The membername is the name of the member that contains the source JCL (either a cataloged procedure or a job). Tell the operator to specify a user event identifier X'F65' to trace GTF user trace records.
Starting a GTF trace for GFS data
The operator starts GTF tracing with cataloged procedure GTFPROC to get GFS data in the GTF trace output. The contents of cataloged procedure GTFPROC are shown in Figure 5-20.
The operator then replies to messages AHL100A with the USRP option. When message AHL101A prompts the operator for the keywords for option USRP, the operator replies with USR=(F65) to get the GFS user trace records in the GTF trace output.
|
//GTF PROC MEMBER=GTFPROC
//* Starts GTF
//IEFPROC EXEC PGM=AHLGTF,REGION=32M,TIME=YES,
// PARM='MODE=EXT,DEBUG=NO,TIME=YES,BLOK=40K,SD=0K,SA=40K'
//IEFRDER DD DSN=MY.GTF.TRACE,
// DISP=SHR,UNIT=3390,VOL=SER=VOL001
|
Figure 5-20 GTF procedure for GFS trace
Stopping GTF trace
To stop the GTF trace, ask the operator to enter a STOP procname command on the master console. To stop GFS trace, create a DIAGxx parmlib member with:
VSM TRACE GETFREE(OFF)
The operator then enters the SET DIAG=xx command, where xx points to the created DIAGxx parmlib member.
Obtaining GFS trace data
GTF places the GFS trace data in a user trace record with event identifier X' F65'. To obtain GFS trace data, do one of the following:
1. When GTF writes the trace data to a data set, format and print the trace data with the IPCS GTFTRACE subcommand.
2. When GTF writes trace data only in the GTF address space, use IPCS to see the data in an SVC dump. Request the GTF trace data in the dump through the SDATA=TRT dump option.
3. Issue the IPCS GTFTRACE subcommand to format and see the trace in an unformatted dump. See the output in Appendix C.1.2, “GFS trace data” on page 362.
5.9 System trace

Figure 5-21 System trace
System trace
System trace provides an ongoing record of hardware and software events occurring during system initialization and operation. The system activates system tracing at initialization and the tracing runs continuously, unless your installation has changed the IBM-supplied system tracing. After system initialization, you can use the TRACE operator command on a console with master authority to customize system tracing.
Because system trace usually runs all the time, it is very useful for problem determination. While system trace and the general trace facility (GTF) list many of the same system events, system trace also lists events occurring during system initialization, before GTF tracing can be started. System trace also traces branches and cross-memory instructions, which GTF cannot do.
System trace writes trace data in system trace tables in the trace address space. It maintains a trace table for each processor. You can obtain the trace data in a dump that includes option SDATA=TRT.
Using system trace
Use system trace to see system processing through events occurring in the system over time. System tracing is activated at initialization and, typically, runs continuously. It records many system events, with minimal detail about each. The events traced are predetermined, except for branch tracing. This trace uses fewer resources and is faster than a GTF trace.
System trace tables reside in fixed storage on each processor. The default trace table size is 64 kilobytes per processor, but you can change it using the TRACE ST command. We do not recommend running with trace tables smaller than the default 64 kilobytes.
Controlling trace table size
You might, however, want to increase the size of the system trace table from the default 64 kilobytes. Issue the following command to increase the system trace table size to 256K:
TRACE ST,2M
Tracing branch instructions
System tracing allows you the option of tracing branch instructions, such as BALR, BASR, BASSM, and BAKR, along with other system events. If you want to trace branch instructions, use the BR=ON option on the TRACE ST command when you start tracing, as follows:
TRACE ST,BR=ON
|
Note: With branch tracing on, this can affect your system performance and use very large amounts of storage. Do not use branch tracing as the default for system tracing on your system. You should only use it for short periods of time to solve a specific problem. The default system tracing does not include branch instructions.
|
Problem determination
Because system trace usually runs all the time, it is very useful for problem determination. While system trace and the general trace facility (GTF) lists many of the same system events, system trace also lists events occurring during system initialization, before GTF tracing can be started. System trace also traces branches and cross-memory instructions, which GTF cannot do.
System tracing will be captured in all dump situations by default, except during a SNAP dump where SDATA=TRT must be specified. Figure 5-22 trace table shows a program check occurring in an environment where no FRRs (Functional Recovery Routine) are defined. RTM1 passes control on to RTM2 via an SVC D.
no FRRs are defined. RTM1 passes control to RTM2 via an SVC D.
|
01 000A 00AEF430 SVCR 7B 070C0000 868985D2 00000000 00000000 04379238
01 000A 00AEF430 PGM 011 070C2000 868985F2 00040011 12004000
01 000A 00AEF430 *RCVY PROG 940C4000 00000011 00000000
01 000A 00AEF430 SSRV 12D 813DE814 00AEF430 000C8000 FF3A0000
00000000
01 000A 00AEF430 SSRV 12D 813DE830 00AEF430 000B8000 00000000
00000000
01 000A 00AEF430 DSP 070C2000 812FADEA 00000000 00FD0E20 12004780
01 000A 00AEF430 *SVC D 070C2000 812FADEC 00000000 00FD0E20 12004780
01 000A 00AEF430 SSRV 78 86A0A4AE 0000FF50 000000C8 00AFB5D8
|
Figure 5-22 IPCS SYSTRACE output
The *SVC D entries shows RTM1 sets up PSW to point to an SVC D instruction in order to force entry into RTM2
5.10 SMS tracing

Figure 5-23 SMS tracing
SMS tracing
If you need to trace the interaction between a data set allocation and SMS, collecting SMS trace data may be of assistance. The procedures to collect and review SMS trace data are as follows. To start and stop SMS tracing, use:
SETSMS TRACE (ON or OFF)
Control size of SMS trace table
The SIZE parameter specifies the size of the trace table in kilobytes. If you omit K or M, the default unit is K. The default value is 128K. The maximum is 255000K or 255M. This value is rounded up to the nearest 4K. Issue the following MVS command:
SETSMS SIZE(255M)
Select SMS tracing by jobname
You can select tracing by jobname and this limits SMS to tracing to the specified address space. If you enter jobname(*), all address spaces are traced. If you specify ASID, omit jobname. Issue the following MVS command:
SETSMS TRACE(ON),TYPE(ALL),SIZE(1M),DESELECT(ALL),SELECT(ALL),JOBNAME(SMS)
Diagnosing SMS problems
Take a dump of the SMS address space. For example:
DUMP COMM=(any dump title you desire)
R #,JOBNAME=SMS,CONT
R #,SDATA=(LPA,CSA,ALLNUC,GRSQ,LSQA,SWA,PSA,SQA,TRT, RGN,SUM)
Using IPCS for SMS
The SMS IPCS verb exit (SMSDATA) is intended for the use of diagnostic programmers who are working with the IBM Support Center to resolve an SMS-related problem. Invoke IPCS and review the SMS trace by issuing the following IPCS command:
VERBX SMSDATA 'TRACE'
The SMSDATA verb exit performs the following functions:
•Validates control block chains in the SMS address space.
•Formats the control blocks in the SMS address space.
•Formats the trace table in the SMS address space.
•Formats the control blocks associated with the SMS automatic data areas.
5.11 Trace data using an external writer
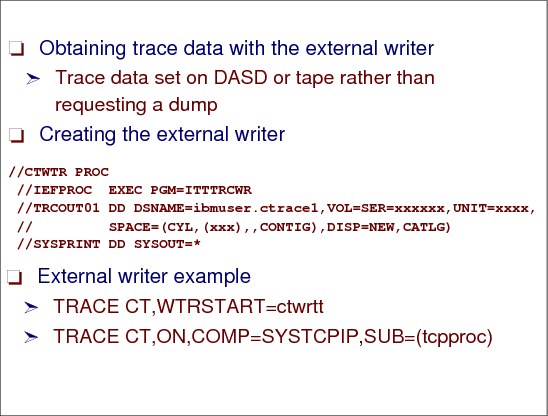
Figure 5-24 Collecting trace data with an external writer
Obtaining trace data with the external writer
By using the external writer, you can write application trace buffers directly to a trace data set on DASD or tape rather than requesting a dump. While you might still view your trace buffers by requesting a dump, the advantages of using the external writer are:
•You do not need to code a component trace buffer find exit routine for IPCS processing.
•Depending on the size of the trace data set, you can capture more trace data without using valuable system resources such as central or auxiliary storage.
|
Note: While component trace runs under the master scheduler address space, you need to verify that the priority of the external writer is at least equal to, and preferably greater than the priority of the component being traced. For example, if you are tracing COMP(SYSXES) for JOBNAME(IRLMA), the dispatching priority of the external writer should be equal to or greater than that assigned to IRLMA.
|
Creating the external writer
Create source JCL to invoke an external writer, which will send the component trace output to one or more trace data sets. Add a procedure to the SYS1.PROCLIB system library or a job as a member of the data set in the IEFJOBS or IEFPDSI concatenation.
An external writer is not specific for a component but can be used by any application. So you can use the same source JCL, shown in Figure 5-25 on page 141, again for other tracing later, if needed.
|
//CTWTR PROC
//IEFPROC EXEC PGM=ITTTRCWR
//TRCOUT01 DD DSNAME=ibmuser.ctrace1,VOL=SER=xxxxxx,UNIT=xxxx,
// SPACE=(CYL,(xxx),,CONTIG),DISP=NEW,CATLG)
//SYSPRINT DD SYSOUT=*
|
Figure 5-25 External writer procedure
External writer example
The following shows an example for TCPIP CTRACE to an external writer:
•Start the writer for TCPIP CTRACE where ctwrtt is a writer for CTRACE
TRACE CT,WTRSTART=ctwrtt
•Start CTRACE
TRACE CT,ON,COMP=SYSTCPIP,SUB=(tcpproc)
R xx,JOBNAME=(tcpproc,otherappljobname),options=(validoptions),WTR=ctwrtt,END
|
Note: Where validoptions=(PFS,TCP,SOCKET,ENGINE,SOCKAPI) for z/OS systems.
|
..................Content has been hidden....................
You can't read the all page of ebook, please click here login for view all page.