Chapter 9: Monitoring APIs with Postman
I remember taking a class on time management. One of the topics we discussed in that course was how to manage your email. As students, we shared how we each approached our email. I can still distinctly remember one of my fellow students being completely shocked and almost bewildered that I didn't empty my email inbox every day. For me, all email stays in my inbox. If it is unread, I still need to deal with it, and if it is marked as read, I don't need to look at it again, but I don't bother to archive it or put it into another folder. This student thought it was totally bonkers that I wouldn't archive and label everything. And then there is the other side of the spectrum. I know people who have literally thousands of unread emails in their inbox. If they get an email that they don't want to read, they just leave it.
When I see an inbox like that, I become kind of like the student in the time management class. I can't even understand how anyone can work like that. But somehow, they do. We all have different approaches to how we think about and handle our email, and sometimes, seeing how someone else does it can be a bit shocking to us. It's hard not to think of our way as the one that everyone uses. The reality, though, is that even with something as simple as email, there are many different ways of using the tool.
This is one of the great challenges of testing. It is really hard to think of ways of doing things that are different from the way you do it. To use the phrase popularized by Donald Rumsfeld, there are known unknowns. We know that people will use the system in unknown ways but don't know what those ways are. There are techniques we can use as testers to come up with new ideas and reduce the uncertainty, but with any significant user base, we will never be able to predict all of the ways that clients will use our system. As the saying goes, if users can do it, at least one of them will. I have seen that played out again and again in my years as a software tester.
You design a system to work in a certain way, but a client wants to do something the system doesn't allow for yet, so they figure out some way to get it to do what they want even if that means using a feature in a way that you never intended. Of course, then later on, when you change that feature, you end up breaking things for your client. As testers, we want to prevent that, but how do we go about predicting all of the ways that our customer will use our system? The truth is, we can't. No matter how good we get at figuring out the unknowns, we will never be able to understand and predict everything those that interact with our software will do.
This is why software developers and testers have increasingly turned to monitoring to help them out. Monitoring allows you to see some details of what your customers are doing with your product and hence allows you to respond to issues that they hit quickly and effectively. It also allows you to better understand usage patterns before making changes to the system.
In this chapter, I will show you how to use monitoring in Postman. We will cover the following topics:
- Setting up monitors in Postman
- Viewing monitor results
Technical requirements
The code used in this chapter can be found at https://github.com/PacktPublishing/API-Testing-and-Development-with-Postman/tree/master/Chapter09.
Setting up a monitor in Postman
Monitoring in Postman allows you to stay up to date with how your API is working. Normally, when you create tests in Postman, you will run them against a local build or perhaps as part of a continuous integration build. With monitors, you can run tests using staging or even production builds to make sure that certain aspects of your API are working as expected.
In this section, I will show you how to get started with creating monitors in Postman and I'll explain some of the different options that you have and when you should use them. This section will also show you how to add tests to a monitor so that you can check for exactly what you are interested in.
Creating a monitor
To create a monitor in Postman, click on the New button and then select the Monitor option on the wizard. You can then set up the monitor with the following steps:
- For the first step of the process, you can choose to either add new requests to a collection and monitor those, or you can pick an existing collection to monitor. For now, let's just create a new collection explicitly designed for monitoring:

Figure 9.1 – Monitor a new collection
- In the Request URL field, enter https://swapi.dev/api/people.
- Ensure that the Check Status Code field has a value of 200 and that the Check Response Time field has a value of 400.
- Click on the Next button to go to the configuration page. On that page, you can create a name for the monitor and choose which environment to use if the collection needs one. In this case, name the monitor SWAPI Test Monitor and leave the environment unspecified.
The configuration page also has options to specify the frequency with which you want to run the monitor. Note that a free Postman account, at the time of writing this, only has 1,000 monitoring calls per month. You will want to keep that in mind when setting up the frequency of your monitor. Also, in this case, we will just be doing this for demonstration purposes, and so you should delete the monitor after working through this example. We don't want to be unnecessarily running requests against a service.
- By default, Postman will automatically select which region to run the monitor from, but if you have specific regions that you want to run from (for example, if you wanted to see the latency from a region), you can manually select one from the list. For now, leave the Automatically Select Region option selected.
- There are also additional preferences that you could set. Click on Show additional preferences to see them. Postman will automatically send email notifications to the email address you used to log in to your Postman account, but if you want to add additional email addresses to receive notifications, you can do so here. You can also specify options such as whether you want it to retry when it fails, or if you want to set a timeout or a delay between requests. For this example, just leave all of the options unchecked. At this point, the configuration page should look like this:
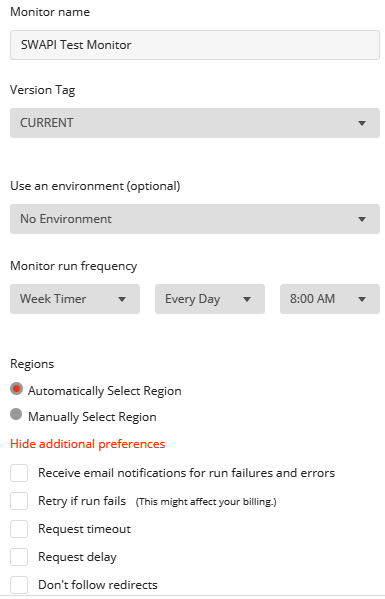
Figure 9.2 – Monitor configuration
- Click on the Create button to create the monitor. After a few seconds, the monitor will be created.
Monitors that you have set up can be viewed by clicking on the Monitors tab to the left of the navigation pane. If you go there and click on the monitor, you will see that you can manually kick off a run of the monitor if you want. You can also make changes to the monitor by going to the View more actions menu at the top-right of the page and choosing the Edit option:

Figure 9.3 – Edit a monitor
Click on the Run button to run the monitor and you will see a report of the run, showing whether any of the tests failed and how long it took to run the monitors. If you go to the Collections tab, you will see that a new collection called SWAPI Test Monitor has been added to the collection list. The request in that collection will call the endpoint you specified and has a test that checks that the status code is 200 and the response time is below 400 milliseconds.
These steps will get you started with creating a monitor, but there are several other options that we didn't use. When initially setting up the monitor, we left most of the additional preferences blank. These options are available for a reason though, and so I want to take a moment to look at what they do and why they are there.
Using additional monitor settings
You can see the additional monitor settings if you edit the monitor and expand the Additional Preferences section. There are different settings here as you can see in the following screenshot:
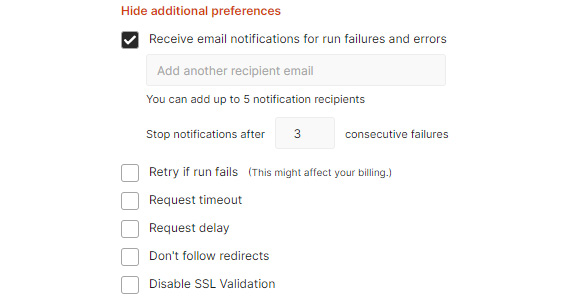
Figure 9.4 – Additional preferences for monitors
Let's look at each of them in turn.
Receiving email notifications
The email notification setting is pretty self-explanatory. Whichever email addresses you specify will get notified of any monitor failures. By default, Postman will have the email address associated with your account in there, but you can easily add more.
You can also control how much Postman will bug you about this. If you have a monitor that is running quite frequently and it starts to fail, you might get an email every 10 minutes about this failure. If you are already investigating the failure, you might find this annoying. Postman allows you to control this by specifying how many times you want to be notified about a failure that is happening every time. By default, it will stop notifying you once the same monitor has failed three times in a row, but you can change that number to be higher or lower based on your workflows.
Retry on failure
Sometimes, there are minor glitches in our systems that we can't do anything about. If you are monitoring a part of the system where you might occasionally get this kind of glitch, you might not want to have to investigate every single one. In that case, you can use the Retry if run fails option. If this option is specified and a run fails, Postman will immediately run it again before notifying you of the failure. You can specify how many times it will retry (either once or twice). However, if the previous time the monitor was run, it failed, Postman will assume that this current failure is legitimate, and it will not try to re-run it for you.
Since the number of monitor calls is limited depending on which plan you are using, you will want to be aware of how this option could affect that. Automatically rerunning a monitor in this way will count against your monitor limit.
Request timeout
The request timeout option is used to determine how long Postman will wait for a request to return data before moving on to the next request. By default, it does not specify any timeout value. Postman does limit the total time that a monitor can run for to 5 minutes, but if you had a monitor with a few requests and one of them was hanging, it could prevent the other requests from running. To avoid this, you can use the request timeout option. When you choose that option, you will need to specify how long Postman should wait before it considers the request to have timed out. Of course, the amount of time that you specify here cannot exceed 5 minutes as, at that point, the total run time available for the monitor will be exceeded.
Delay between requests
Some services need a short pause between requests to allow data to be fully synchronized. If you need to do something like this in a monitor, you can use the Delay between requests option to specify the time in milliseconds that you want to Postman wait after a request has finished before sending a new one.
The maximum amount of time a monitor can run for is 5 minutes, so be aware that adding delays between requests contributes to this. If you make the delay too long, you won't be able to run very many requests in your monitor.
Don't follow redirects
Some API responses return a redirect response. These are responses that have a status code starting with 3. They tell the browser that it should immediately load a new URL, which is provided in the location header of the initial response. You may want to have a monitor that checks that an API endpoint is giving back the correct redirect but not want the monitor to actually follow that redirect. If this is the case, you can use the Don't follow redirects option to tell Postman that you do not want it to load the redirect URL.
Disable SSL validation
During development of a new API, it may not make sense to purchase a signed SSL certificate. However, if your server does not have one yet, monitors that you run against it will probably error. To work around this situation, you can specify the Disable SSL validation. This will tell Postman that you do not want to check for an SSL security certificate and so will prevent your monitors from failing due to missing certificates.
Although there certainly are times when you would need to use this option, if you are monitoring a production server, I would recommend against using this option. I have seen it happen where a company forgets to update its security certificate and this ends up causing errors for end users. The point of monitors is that you will know whether your end users are seeing errors and so, generally speaking, you want your monitors to fail for SSL validation errors.
Understanding these options will help you to choose the settings that will allow you to create monitors that do what you need them to. However, another very important aspect of a good monitor is ensuring that you have tests in place that check the things that matter.
Adding tests to a monitor
When you created the monitor, it automatically added a request for you, but what if you want to check some additional stuff? To add additional checks to your monitors, go to the collection in the Postman app and add a new request to that collection. Let's monitor a second endpoint in this API. Set the endpoint of the new request to https://swapi.dev/api/films and then go to the Tests tab.
You can add a check to this request that checks for a 200 response with the following code:
pm.test('check status code', function () {
pm.response.to.have.status(200);
})
Another check you might want to add to a monitor is to check the size of the request. You could just add a check that verifies the data, but then, every time even just a minor thing changes in the request, you would need to update your monitor. Instead, you could use a check directly against the size of the request. You can check that the size of the request is bigger than a given value as a rough estimate of it still working correctly with the following code:
pm.test('check response time', function() {
pm.expect(pm.response.responseSize).to.be.above(18000);
})
You can of course add any other checks you want to your monitors in the same way you would add a test to a request normally. However, it is a good idea with monitors to make the checks more generic. Usually, a monitor is meant to be a quick check indicator that something might be going wrong. You want to get that feedback without running all of the detailed regression checks that you would usually run and so you will want to design the monitors to be quite simple.
Any monitor failures should be pretty good indicators that something has gone wrong with the system in production. That can come from code changes although, hopefully, issues introduced in that way would be caught by tests run in your build pipeline. Often, monitors will catch things that went wrong with a deployment or perhaps with some hardware or software breaking in the production environment itself. You want to be able to trust your monitors and so you should make them fairly generic so that you can be sure that if they report a failure, it is something important to follow up on.
If you have monitors that fail for minor things, it is easy to end up with alert fatigue. In that case, you get so many alerts about failures that aren't really failures at all, and you end up ignoring the failures. You remember the story of the boy who cried wolf? He thought it was funny to say there was a wolf when there wasn't and after a while, the villagers started to ignore him. They assumed that he was just trying to trick them again and when a real wolf came, they didn't respond to his cries for help. The same thing can happen with monitors. If they fail too often, you will stop trusting them. Think carefully about how you set them up.
As with all automated tests, I think it is important to "test the tests." You don't want your tests to fail unnecessarily, but you do need to make sure that they actually will fail if something goes wrong. Let's set the expected response size to 19000 instead and then send the request. You should see a failure in the test results as shown in the following screenshot:

Figure 9.5 – Failed check
You could modify the other check as well to be sure and then put them back to the correct values. Postman will now run the two requests in this collection on the schedule you have set up.
We've seen how to create monitors in Postman. I've also shown you how to set up a monitor so that it does what you need it to. You've learned about the various settings that are available and seen how to add tests to monitors. With all of that under your belt, it is now time to look at how to view the results of monitor runs.
Viewing monitor results
Once you have created your monitors, they will run on the schedule you specified. In this section, I will show you how to view and understand the results of these runs. I'll also show you how to delete a monitor that you no longer need.
If a monitor fails, Postman will send you an email letting you know that there is a problem. This email will let you know about the failure and give you a link that will take you to the monitor. Postman will also send you a weekly summary of your monitors so that you can see how they are doing overall.
Although monitors usually run on the specified schedule, you don't have to wait for the scheduled run time. If you suspect there might be an issue, or you just want to check something out, you can manually run your monitor outside the specified schedule.
To see the monitor results, you will need to go to the Monitors tab and select you monitor from the list.
If your monitor has not yet run, you will see a notification to that effect, and you can click on the Run button to kick off a run. Once the monitor has run, you will see a chart showing some information about that monitor. The chart is split into two parts. The bottom of the chart (labeled 1 in the following screenshot) shows you how many of the checks have failed:

Figure 9.6 – Monitor chart
In the example shown in this screenshot, there are no failures so everything is at 0, but if some of the checks had failed, you would see that displayed here.
The top part of the chart (labeled 2 in the figure) shows how long the requests took to resolve. This can be a good indicator to look at as well. You might have monitors that are not failing, but if over time things are getting slower, that might also indicate a problem.
Important note
If you are running multiple requests in your monitor, the time shown in the monitor plot is the average of the times taken by each of the requests. If you want to see the individual request times, you can click on the Request Split option at the top of the chart.
If the monitor has only been run a couple of times, as shown in the previous screenshot, it is pretty easy to look through the results, but if you have a monitor that is running on a regular schedule, the number of results on this plot will start to get quite large. However, you can still view the results by using the filtering options. These options are available at the top of the chart and they can be used to narrow down the results that you see. You could, for example, look at the results from just one specific request if you want, or you could set the filters to look at only the results for failed or errored runs, as shown in the following screenshot:

Figure 9.7 – Monitor result filters
One other thing that can be helpful if you are trying to figure out why a monitor is failing is to look at the test results for that monitor. If you click on one of the bars in the graph, you can scroll down on the page to see a summary of the results that show what requests were run and what checks each test did. Additionally, you can look at some results in the console log by clicking on the Console Log tab. This tab is also available after clicking on a run in the chart. Some details are not shown in here for security reasons, but it can give you a bit of additional information.
Now that you have had the chance to set up and run a monitor as well as look at the results, I want to show you how to clean them up. Not all monitors need to stay around forever and since the free version of Postman comes with a limited number of monitor calls, you may want to remove monitors that you don't need. Let's look at how to do that in the next section.
Cleaning up the monitors
Since you don't need to worry about the status of the SWAPI service, I would suggest that you don't leave these monitors running. They will count against your monitor run quota and will create unnecessary load on the SWAPI service. You can remove the monitor with the following steps:
- Go to the Monitors tab and select SWAPI Test Monitor.
- Click on the View more actions menu beside the monitor and select the Delete option:

Figure 9.8 – Delete monitor option
- Click Delete on the confirmation dialog.
This will remove the monitor for you, and it will no longer run. In this section, you have learned how to do the final steps in the life cycle of a monitor. You can view the results and make decisions based on what you see. In addition, you have learned how to clean up old monitors that you no longer need.
Summary
Monitoring is an important strategy in the world of modern API development. It is impossible to fully predict everything that will happen in the real-world usage of our applications. No matter how well we have tested our APIs, there will always be surprises in the real world. Monitors are a way to mitigate the risk of these surprises. With monitors, we can see what is going on with our APIs and quickly respond to issues.
In this chapter, I have shown you how to get started with using this tool in Postman. You have seen how to create a monitor and how to add requests and tests to that monitor. You have also learned about the various options that Postman has for creating monitors and learned when to use those options. In addition, I have shown you how to view and understand the result that Postman gives when monitors are run.
Monitoring allows you to get a glimpse into how an API is working when your clients are using it, but it is no replacement for having a good understanding of how your API works. If you want to create useful monitors, you will need to know what kinds of things to look for and have a good understanding of the risks that exist in your API. In the next chapter, we will take a closer look at testing an existing API and see what lessons we can use from there to help us to create better APIs.