
Chapter 9: DevSecOps Pipeline with AWS Services and Tools Popular Industry-Wide
In the previous chapter, we created a CI/CD pipeline along with the standard branches using AWS native services, as well as integrating CodeGuru Reviewer and ECR image scanning as security tools to detect any vulnerabilities before we deploy services in an environment. In this chapter, we will learn more about security tools and create a pipeline with security in place at every stage that scans the application for vulnerabilities and notifies us of any. We will start with the concepts related to the Talisman pre-commit hook, the Snyk advisory plugin, Software Composition Analysis (SCA), Static Application Security Testing (SAST) (Anchore), Dynamic Application Security Testing (DAST) (OWASP ZAP), and Runtime Application Self-Protection (RASP) (Falco). After this, we will start planning for the pipeline, then we will learn more about the tools and their installation. Finally, we will integrate all the tools in a pipeline and deploy a microservice in an EKS cluster via the secure CI/CD pipeline.
This chapter contains the following main sections:
- DevSecOps in CI/CD and some terminology
- Introduction to and concepts of some security tools
- Planning for a DevSecOps pipeline
- Using a security advisory plugin and a pre-commit hook
- Prerequisites for a DevSecOps pipeline
- Installation of DAST and RASP tools
- Integration with DevOps Guru
- Creating a CI/CD pipeline using CloudFormation
- Testing and validating SAST, DAST, Chaos simulation, Deployments, and RASP
Technical requirements
To perform the tasks mentioned in this chapter, you will need the code and configuration given in the chapter-09 folder of the following repository:
https://github.com/PacktPublishing/Accelerating-DevSecOps-on-AWS.git
DevSecOps in CI/CD and some terminology
DevSecOps is the philosophy of adopting security practices along with the DevOps process. A security-focused, continuous-delivery Software Development Life Cycle (SDLC) is referred to as DevSecOps. DevSecOps draws on the lessons learned and best practices of DevOps in general. When DevOps ideals are applied to software security, security testing becomes an active, integrated element of the development process. Security has always been considered as a secondary plan, which is bad. Toward the completion of the SDLC, the information security (InfoSec) team frequently interacts with development teams. As noble as their objectives may be, discovering security flaws at the end of the SDLC may be annoying.
Why DevSecOps?
In a nutshell, we can state that without security, our technology-driven lifestyles would be jeopardized, hence it is critical to include it early in the SDLC. Cyberattacks have become one of the most serious concerns facing businesses and governments today. Several big corporations have recently had data breaches, leading consumers to lose faith and resulting in massive financial losses each year. So, the question isn't so much "Why DevSecOps?" as it is "How do we perform effectively in the DevSecOps era?" DevSecOps is a welcome change for individuals encumbered by standard security procedures. This is not a "one-size-fits-all" directive from a centralized organization; solutions may vary depending on your technology stack and architecture.
DevSecOps ensures security checks at every step of software delivery. These days, we use an automated CI/CD process for the fast delivery of software. The DevSecOps culture enables us to take the Shift Left approach and implement security checks at each stage of CI/CD. The curated list of security checks that takes place in software delivery is as follows:
- Security advisory for source code vulnerabilities in real time: This security check helps developers to identify source code vulnerabilities as they write the code. The security tools for this sort of check are embedded in the Integrated Development Environment (IDE) as some sort of plugin or extension.
For example, say a developer is importing a library to use in their code. That library has Common Vulnerabilities and Exposures (CVE), but the developer doesn't know. The advisory plugin, which is running in the background, will notify the developer that they shouldn't use this library, or to use the latest version, which doesn't have CVE.
- Pre-commit secrets check: This security check helps developers to identify any secrets before they commit the code in a Version Control System (VCS). These security tools are generally installed on the developer's laptop as well as the CI system.
For example, say a developer finishes writing their code without any vulnerabilities, but somehow, they forgot to remove the secrets of any sensitive data that they were using for their local testing and tried to commit the code to a remote repository. During the commit, this tool will kick in and stop the commit if the scan finds some secret leakage.
- SCA: This security check helps to identify vulnerabilities in open source components. This tool doesn't really need to scan the source code, but it scans the libraries and their digital signatures. This tool can be installed as part of the IDE, such as a security advisory plugin. A lot of plugins these days provide source code security checks as well as SCA checks.
For example, say a developer writes their code following the recommendations of a security advisory plugin and uses all the appropriate libraries, which are free from vulnerabilities. But, when they build their code (for example, npm install), the library used in the code could look for another dependency and download it. Then, SCA will scan that dependency too, and give the developer the vulnerability report and fixes. SCA generally doesn't have false positives, and most of the time, it has recommendations and fixes.
- SAST: This security check is primarily done before code compilation in the build system. The security tool for SAST detects vulnerabilities in proprietary code or code written in-house. This tool also helps to set the standard for code style practices and enforce them to be used companywide. This tool generally scans the entire code and gives recommendations, but it also has a higher number of false positives. Some tools try to suppress those false positives. You should choose the tool that supports the programming language that you use in your application development.
- DAST: This security check takes place when your application is deployed in an environment in a running state. This tool simulates all the activities that an attacker would perform in a live application. Common examples are SQL injection, a DDoS attack, and cross-site scripting. DAST does not have any dependencies on language because it interacts with the application from outside means via the application endpoint.
- RASP: This security check detects attacks on an application in real time. The security tools are deployed in the application server as agents and kick in when the application runs. This security tool intercepts all the calls from the application to a system, makes sure that they are secure, and validates data requests inside the application.
For example, say a service Pod is running in Kubernetes, and when it gets compromised, the attacker will try to connect to the Pod. During this time, the RASP software can either kick the attacker out or alert the respective application owner.
These are the main security checks implemented in CI/CD, but you are not restricted to only these. DevSecOps is not only responsible for CI/CD but also for the environment. There are plenty of security checks when it comes to the environment, which we covered in Chapter 2, Enforcing Policy as Code on CloudFormation and Terraform. In the next section, we will discover and unpack the tools used for these security checks.
Introduction to and concepts of some security tools
In this section, we will discover more about the security tools that cover the preceding security checks. These security tools are picked up based on the features and provide free trials, as well as being open source. So, these tools are great for beginners or for learning purposes. We will be unpacking different types of tools from different vendors so that you get to know more about them.
Snyk – Security advisory for source code vulnerabilities in real time
Snyk Code is a tool developed by Snyk Limited that offers a free plan. Snyk Code comes as a plugin for an IDE. It scans the static code as well as performing SAST at the IDE level. This plugin connects with an online database and gives results in real time. Snyk Code provides three types of checks:
- Open source security
- Code scan security
- Code quality checks
We will be covering the installation and implementation of this plugin in a later section.
Talisman – Pre-commit secrets check
Talisman is an open source tool that basically checks for any secrets present in the code whenever the developer commits to a Version Control System. This tool is installed on the developer's workstation. It works on the basis of pattern matching of large files, content, and entropy that could contain any sensitive data. It also scans for information such as credit card numbers. We will explore its installation and usage in a later section.
Anchore inline scanning and ECR scanning – SCA and SAST
The Anchore inline-scan is a docker image provided by the Anchore company, and it's open source. This docker image scans the application docker image and generates a vulnerability report. The Anchore inline-scan docker image includes a PostgreSQL database pre-loaded with Anchore vulnerability data, which gets updated daily. It also contains a docker registry that is used for passing images to Anchore engineers for vulnerability scanning. We will be using the Anchore inline-scan as SCA and SAST in the CodePipeline stage.
ECR scanning is a feature provided by the AWS ECR service. This feature scans the Docker image that is pushed in the registry and finds vulnerabilities. We will be using this feature in our CodePipeline stage after the Anchore inline scan.
Open Web Application Security Project-Zed Attack Proxy (OWASP ZAP) – DAST
The OWASP is a worldwide non-profit organization that focuses on improving application security. OWASP ZAP is a popular tool and is totally free. It is a cross-platform tool and can be installed and used in three different ways. You can run it as a desktop application, you can run it in browser mode with a web UI, and you can also install it in such a way that you can perform any task by interacting with the API.
OWASP ZAP's widely used scans are passive and active scans:
- Passive scan: A passive scan is a risk-free test that just searches for results and compares them to exploitable vulnerabilities. The data on a website is not changed by a passive scan. As a result, the scan on the websites for which we do not have permission are extremely safe. As you may be aware, the number one vulnerability in 2018, according to OWASP, is still injection. Also, keep in mind that a passive scan will not identify a SQL injection.
- Active scan: Active scanning is a technique for finding vulnerabilities on a website that uses well-known techniques. Active scanning can alter data and inject malicious programs into a website. So, when you're ready to thoroughly test your website for security flaws, move it to a different environment and perform an active scan. Only use the active scan on sites for which you have authorization!
We will be installing OWASP ZAP on the server and exposing the API to be consumed and used in the CodePipeline stage. We will be performing an active scan on the application deployed by us.
Falco – RASP
Falco is an open source tool for detecting ongoing risks and threats in Kubernetes, containers, and the cloud. Falco acts as a security camera, detecting unusual behavior, configuration changes, invasions, and data theft in real time.
Sysdig developed it and submitted it to the Cloud Native Computing Foundation. Falco secures and monitors a system via system calls by the following methods:
- At runtime, parsing Linux system calls from the kernel
- Using a sophisticated rules engine to assert the stream
- Sending out an alert when a rule is broken
Falco ships out with a default rule that checks the kernel for unusual behaviors, but you can also create your own rule and feed it into the Falco engine. Falco relies on log stream tools, such as fluent bit, and runs as an agent in the system. We will be looking at its installation and implementation in a later section.
In the next section, we will learn about the planning and strategy of the DevSecOps pipeline that we will create and run.
Planning for a DevSecOps pipeline
In the last chapter, we created a CI/CD pipeline along with a branching strategy with AWS native security services in place, but in this chapter, we will focus more on the security aspect rather than the branching aspect. We will create a single pipeline that will trigger the security tools to scan, provide the result and deploy the application, and then scan the running application. So, this chapter will not cover all the branches, but you can break the stages and place it into multiple pipelines that we are going to create in a single pipeline. The following diagram shows the sequential steps of the DevSecOps CI/CD pipeline:
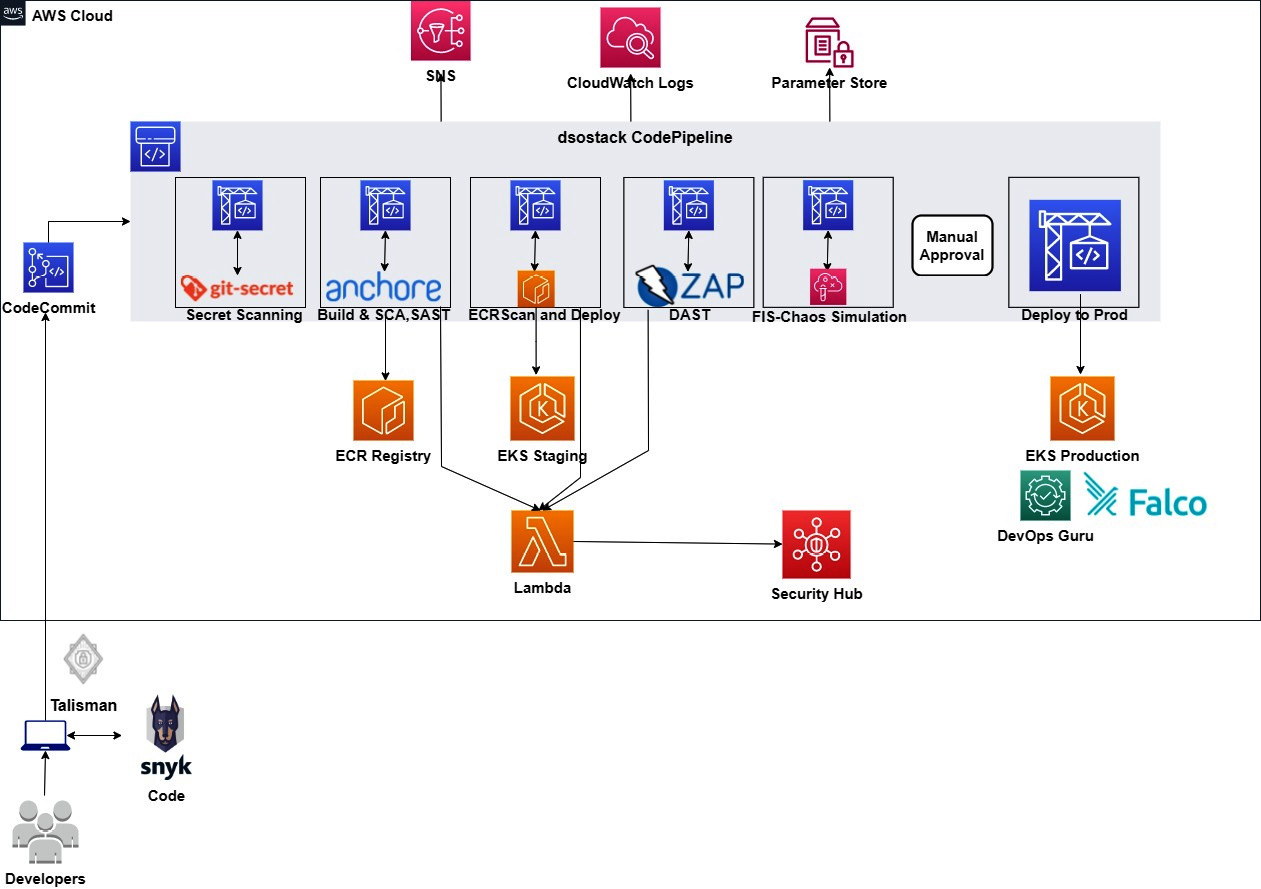
Figure 9.1 – DevSecOps pipeline flow
We are going to perform the following tasks to achieve the DevSecOps pipeline:
- We will start by installing the Snyk security advisory plugin in the Visual Studio Code (VS Code) IDE and check for vulnerabilities in the Catalog_Detail service code.
- After that, we will install Talisman on the local workstation and try to put some secrets in the code to check whether it stops us from committing the code.
- The preceding two steps will be performed in the local machine. After that, we need to prepare the initial setup for the DevSecOps pipeline, as follows:
- The first step is to create a CodeCommit repository, which will store the CatalogDetail service code and the buildspec files.
- We will create two ECR repositories and enable Scan on push.
- After that, we will create two EKS clusters for the staging and production environments.
- Then, we will create an OWASP ZAP instance using CloudFormation.
- After that, we will install Falco in the EKS environment.
- Finally, we will integrate the EKS production with AWS DevOps Guru.
- After the initial setup is done, we will create the DevSecOps CodePipeline project using the CloudFormation template. CloudFormation will not only create the CodePipeline project, but also the related services that will be used in the pipeline, such as Simple Notification Service (SNS) topics, the AWS Lambda function, and parameter store secrets.
- Once the CodePipeline creation completes, it automatically starts running, with the latest commit present in the CodeCommit repository. Once the pipeline starts running, it does the following in sequence:
- The first stage is the Build-GitSecret stage. This stage clones the source code from the CatalogDetail CodeCommit repository and runs a scan to find any sensitive data or secrets. If the scan doesn't find any secrets, the build succeeds and then executes the next stage.
- After the successful execution of the previous stage, the next stage is Build-SCA&SAST. This stage includes two actions. The first action is SAST analysis. This action builds the application and runs the scan using the Anchore inline scanner, which also generates the report after scanning. If the report includes a critical or high CVE, then it will trigger a Lambda function that will parse the report generated by the Anchore scanner to the AWS Security Finding Format (ASFF) format and upload it to AWS Security Hub. The second action is ECR-Scan-and-STG-Deploy. This action will fetch the ECR scan report and if the report contains a critical or high CVE, then it will trigger the Lambda function and upload the result to AWS Security Hub, or it will deploy the service to the eks-staging cluster.
- The next stage is the Build-DAST stage. This stage runs an OWASP ZAP active scan using an API call. During the API call, it fetches the API key from the parameter store. If there are high or critical vulnerabilities, then the Lambda function will be triggered to pass the result to AWS Security Hub, or it will continue to the next stage, which is the Chaos Simulation stage.
- The Build-ChaosSimulation stage creates the experiment template and runs the experiment. The experiment involves deleting the worker node of the cluster, and parallelly monitoring the health of the application and the counts of Pods and worker nodes. This stage executes for at least 5 minutes.
- After this, an approval email is sent to approve the production deployment. There will be a manual approval stage as well, where you need to approve it manually with a comment.
- After manual approval, the Deploy-PRD stage will deploy the service in the eks-prod cluster.
- After the creation of the pipeline, we will run the pipeline. It will fail in all the scanning stages, because the source code, Docker image, and running application will have vulnerabilities. We will try to bypass the vulnerabilities at every stage. We will not fix the vulnerabilities but instead, edit the buildspec file to let the CodeBuild succeed and move to the next stage.
The application that we are deploying in the EKS cluster will not change the frontend UI. It will remain the same. We are changing the CatalogDetail service deployment image from a public repository image to an ECR repository image. From the next section onward, we will start installing the tools and preparing the environment for the CI/CD pipeline.
Using a security advisory plugin and a pre-commit hook
In this section, we will explore security advisory plugins and how they help in detecting vulnerabilities during the development phase itself rather than the build phase. This makes it easier for the developer to see the vulnerabilities and fix them using the recommendations. There are lots of security advisory plugins available on the market that help you detect vulnerabilities while writing your code in IDE. Lots of industries have their own preferences when selecting a vendor. I have found the Nexus IQ plugin quite powerful and it supports major IDEs such as IntelliJ, VS Code, and Eclipse. In this chapter, we will explore the Snyk vulnerability scanner, which scans your code as well as open source dependencies. Perform the following task on your local machine in which you have your IDE installed. The following test has been performed on VS Code, but the Snyk vulnerability scanner is also available in other major IDEs:
- Clone the repository and go to the chapter-09/catalog_detail folder:
$ git clone https://github.com/PacktPublishing/Accelerating-DevSecOps-on-AWS.git
$ cd chapter-09/catalog_detail
- Open this folder in VS Code. Either type code . in your terminal, or open via the GUI and navigate to this folder:
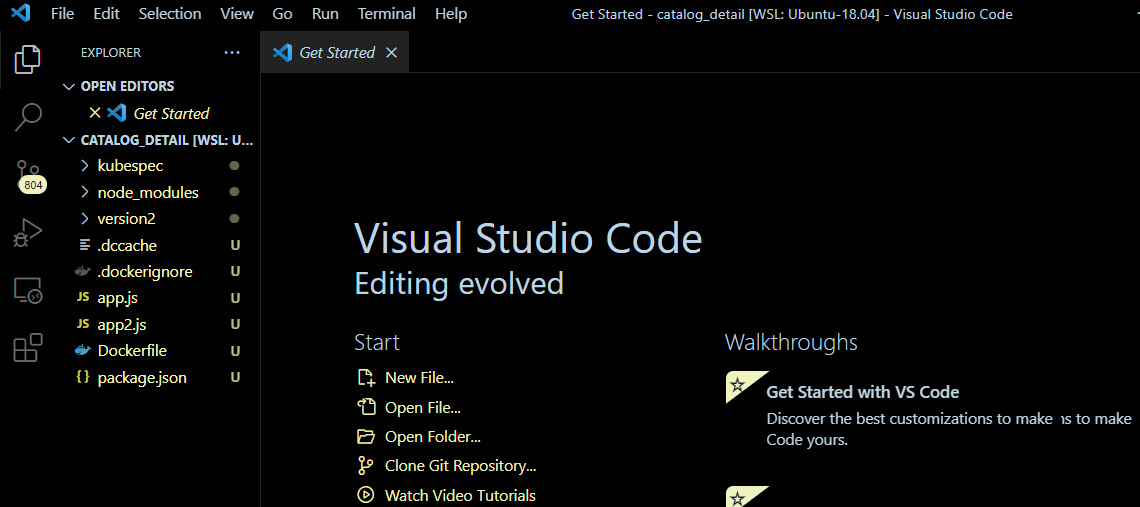
Figure 9.2 – VS Code home page with catalog_detail source code
- Click on Extensions and search for publisher:"Snyk" in the search box. You will find Snyk Vulnerability Scanner. Click on Install:
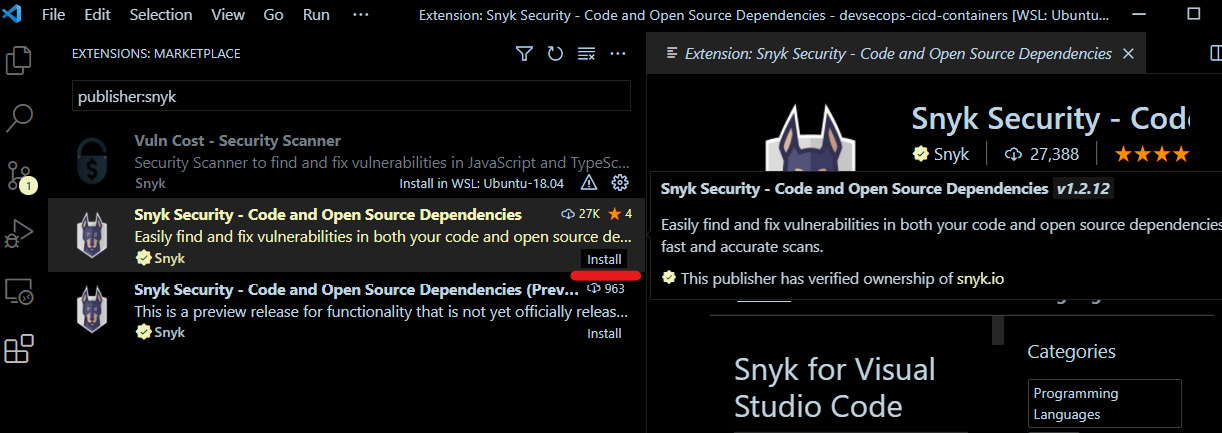
Figure 9.3 – Marketplace showing Snyk Vulnerability Scanner
- After installation, you will be able to see the Snyk icon in the left navigation bar. Click on that; you will then see a welcome message from Snyk. You will see a Connect VS Code with Snyk button. Click on it:
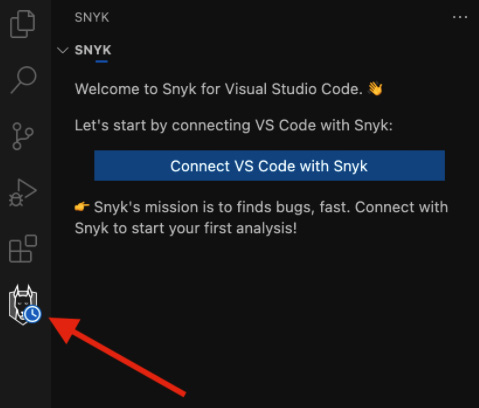
Figure 9.4 – Connecting VS Code with Snyk
- You will be redirected to the Snyk website, where you will be asked to authenticate. You can create an account for free. Snyk provides a free license for individual users for certain products. Once you sign up, click on Authenticate.
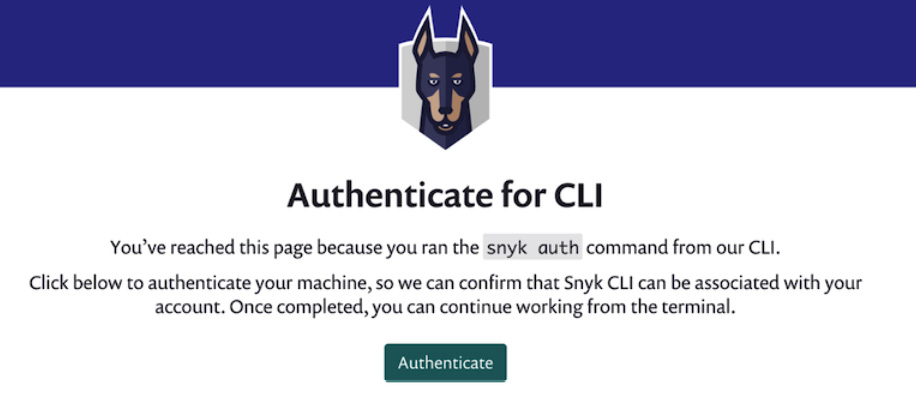
Figure 9.5 – Authenticate extension on the Synk server
- Enable Snyk Code on the Snyk web page and restart VS Code. After that, go to VS Code, where you will be able to see that Snyk took a couple of seconds to analyze a few code-security-related vulnerabilities:
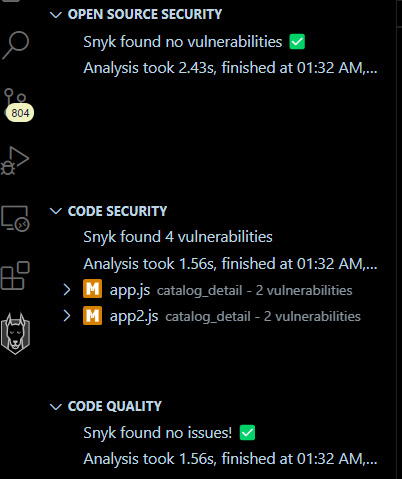
Figure 9.6 – Code scan performed by Snyk
- If you click on one of the vulnerabilities, in this case, app.js, you will be able to see the details with recommendations:
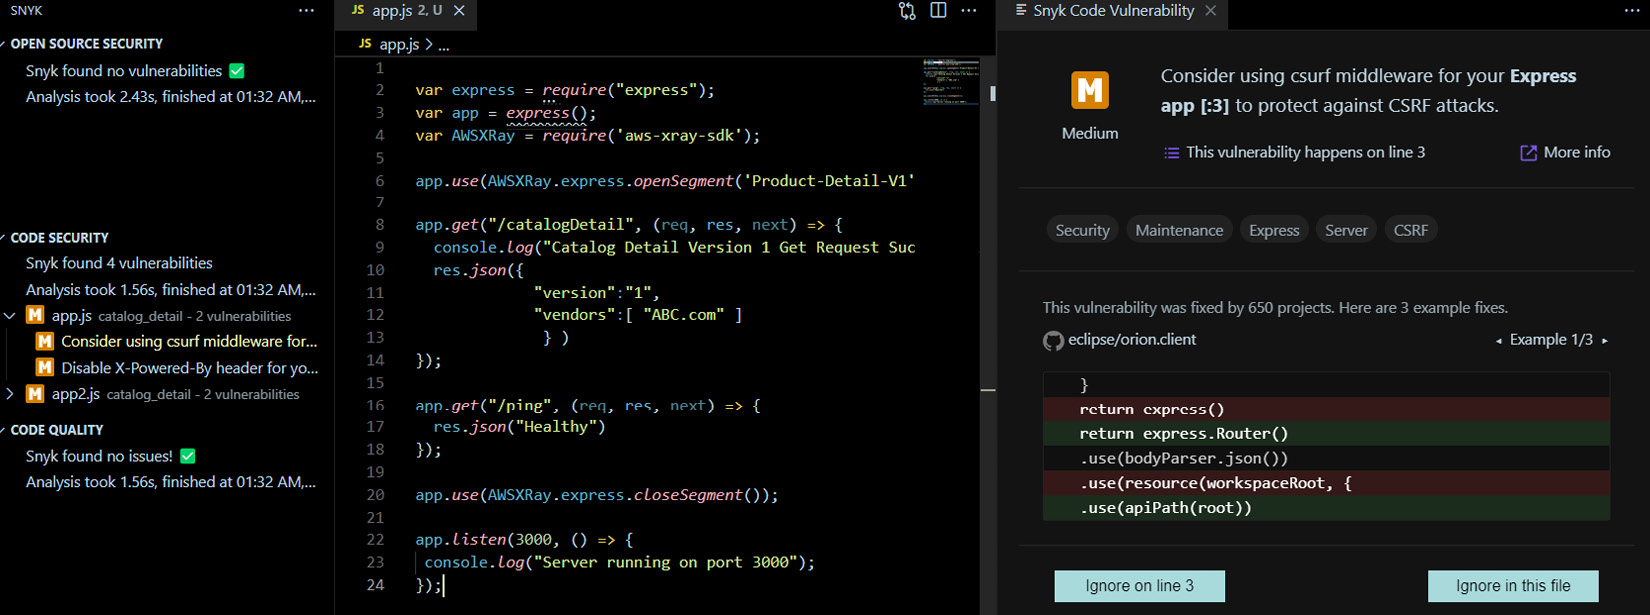
Figure 9.7 – Snyk showing vulnerabilities and recommendations
- This was about code-related security. Now, let's run npm install, which will download the open source libraries, and then see how the Snyk scanner acts. You can open the terminal and run the npm install command from there.
- The moment the command finishes, the Synk Open Source Security scanner will start scanning (if it doesn't start the first time, then click on rescan). In this case, it didn't find any vulnerabilities in our libraries:
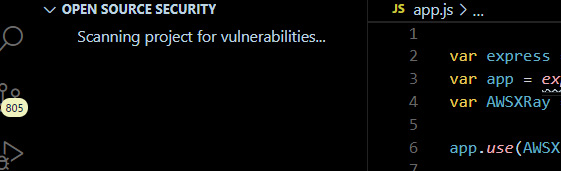
Figure 9.8 – Scanning in progress
When the scan finishes, you can see there are no vulnerabilities:
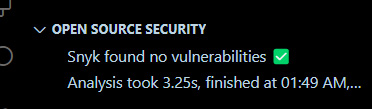
Figure 9.9 – Snyk scan showing no vulnerabilities
- The following screenshot is the scanning result of another application. You can see the Open Source Security vulnerabilities. The right-hand side shows the vulnerabilities in the code:
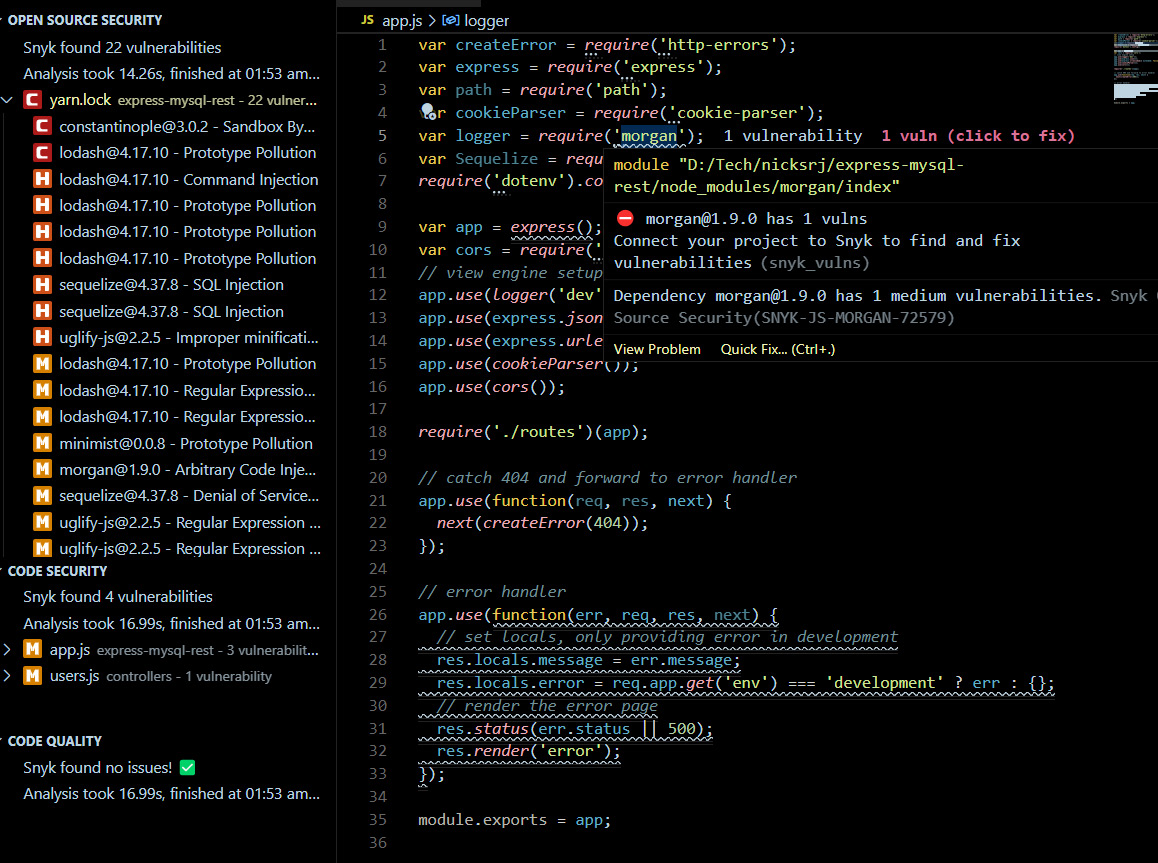
Figure 9.10 – Snyk showing open source vulnerabilities
Note
You can also use the Nexus IQ or Synopsys Code Sight plugins. The Nexus IQ plugin works with its public online database as well as its private server (you need to pay for the private server, which is Nexus IQ Pro). Code Sight has a 30-day free trial, which you can use for Proof of Concept (POC) or learning purposes.
So, we just saw how we can leverage the Snyk vulnerability scanner plugin to identify security vulnerabilities before we commit and push the code into a VCS. Now, suppose after fixing all the security vulnerabilities you forgot to remove the API key or any secrets that you were using for development activities, and tried to push into a VCS. If the secrets get uploaded to the repository, it could cause a security breach. So, to have some sort of check before you commit the code or push into a VCS, you can use a pre-commit hook tool called Talisman. Perform the following steps to see how it works:
- First, we need to inject any sensitive (not really sensitive, but random) data into your code. Go to the app.js file of the chapter-09/catalog_detail folder in VS Code and add the following line to the beginning of the code:
const api_key = 'Xkjhai23JGJIWekUGOOKPPWg38'
- Open the VS Code terminal and delete the unnecessary files if present; these files came because we ran npm install before:
$ rm -rf node_modules package-lock.json .dccache
- Install Talisman in your home folder where all the Git repositories exist, because it will configure the pre-hook in all the existing repositories as well as the new one that you will clone. Ideally, you should install in /home/$USER and follow the interactive instructions. You can customize the installation using configuration parameters that can be found in the documentation of the tool (https://thoughtworks.github.io/talisman/docs/installation):
$ cd /home/$USER
$ curl –silent https://raw.githubusercontent.com/thoughtworks/talisman/master/global_install_scripts/install.bash > /tmp/install_talisman.bash && /bin/bash /tmp/install_talisman.bash
- Now, run the git add and git commit commands. You will be able to see that before committing, Talisman scans the files quickly and gives you the report with a SEVERITY level:
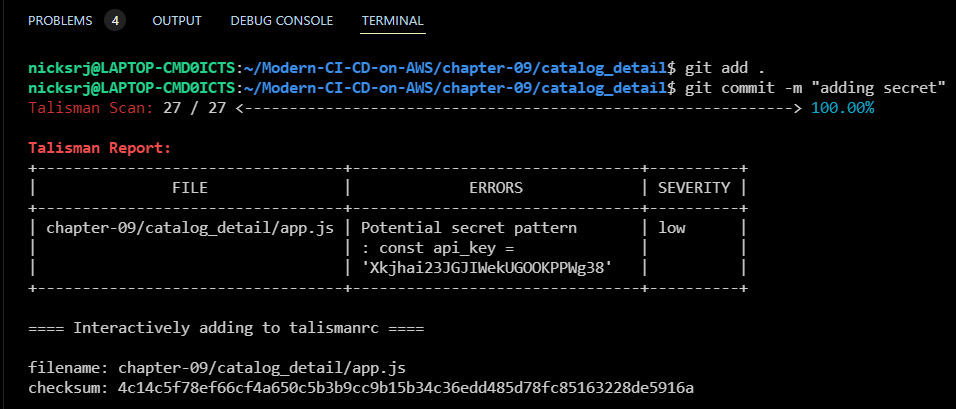
Figure 9.11 – Talisman scanned the code before committing and reported the secret
It is always good to detect these kinds of events, but since this is a local development machine, developers can bypass this as well because they will have full control over Talisman. So, in that case, you must integrate Talisman as a build stage in your CI tool. To learn more about Talisman in the CI stage, you can refer to this blog: https://praveen-alex-mathew.medium.com/running-talisman-cli-in-the-gitlab-ci-servers-29f15af7b1c7. In this chapter, we will be using a different tool for secret scanning that has been open sourced by AWS, known as git-secrets. This will be part of the CodePipeline stage and scan for any secrets inside the code. In the next section, we will create all the prerequisites for the CI/CD pipeline.
Prerequisites for a DevSecOps pipeline
In this section, we will create all the necessary resources for the DevSecOps pipeline. Perform the following tasks to create the prerequisites:
- Create a CodeCommit repository with the name CatalogDetail. Push the source code files available inside chapter-09/catalog_detail/ and chapter-09/buildspecfiles/. The folder structure inside the CatalogDetail repository should look like the following:
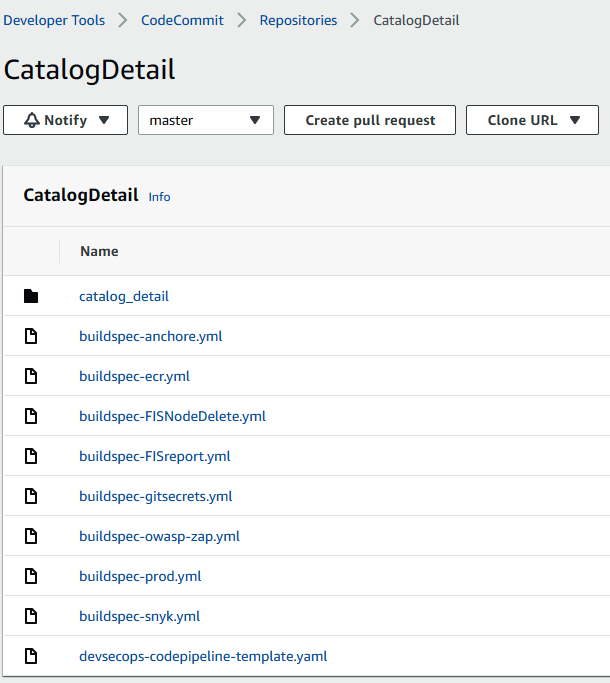
Figure 9.12 – Files and directories present in the CatalogDetail repository
- Create two ECR repositories and name them miscimages and catalogdetail. Make sure to enable the Scan on push option. Upload the following two images to the miscimages ECR repository:
- node:14
- anchore/inline-scan:v0.6.0
- Edit the catalog_detail/Dockerfile file and replace your AWS account number. Similarly, in the buildspec-anchore.yml file, replace the ANCHORE_CI_IMAGE value with the ECR URL value for miscimages that contains the Anchore inline-scan image.
- Create two S3 buckets and give the names of the S3 buckets as dsos3lambda-<YourAccountNo> and pipeline-artifact-bucket-<YourAccountNo>.
- Go to the chapter-09/CICD/lambda_code folder and run the following command to zip the code and send it to the dsos3lambda-<YourAccountNo> S3 bucket:
$ cd Accelerating-DevSecOps-on-AWS/chapter-09/CICD/lambda_code
$ zip -r import_findings_security_hub.zip .
$ aws s3 cp import_findings_security_hub.zip s3://dsos3lambda-<YourAccountNo>
- Enable AWS Security Hub and AWS Configuration Recorder in your AWS account. Refer to the third section (Import AWS Config rules evaluations as findings in Security Hub) of Chapter 7, Infrastructure Security Automation Using Security Hub and System Manager.
- Spin up two EKS clusters with two worker nodes, one for staging as eks-staging and another for production as eks-prod:
### Command to create first cluster
$ eksctl create cluster --name eks-staging --nodes=2 --node-type=t3.small --zones=us-east-1a,us-east-1b
### Command to create second cluster
$ eksctl create cluster --name eks-prod --nodes=2 --node-type=t3.small --zones=us-east-1a,us-east-1b
Do the context switching to access the staging cluster and then again switch to access the prod cluster:

Figure 9.13 – Kubernetes cluster contexts
Currently, you are in the eks-prod cluster context, but you can switch to staging by running the following command:
$ kubectl config use-context <Context-NAME(in my case [email protected])>
- Once your cluster is up and running, add the following service role in aws-auth configmap to both the eks-staging and eks-prod clusters. This service role is not present right now, but it will be available after the creation of the CodePipeline instance. The format of the service role is arn:aws:iam::<your account no>:role/dsostack-SecurityCodeAnalysisRole, as shown here:
$ kubectl edit cm aws-auth -n kube-system
### Add the following content in mapRoles section
- rolearn: arn:aws:iam::<YourAccountNo>:role/dsostack-SecurityCodeAnalysisRole
username: dsostack-SecurityCodeAnalysisRole
groups:
- system:masters
- Create an IAM role with the name FISROLE, and attach AmazonEC2FullAccess and AmazonSSMFullACCESS. Edit the trust relationship with the following snippet:
{
"Version": "2012-10-17",
"Statement": [
{
"Effect": "Allow",
"Principal": {
"Service": "fis.amazonaws.com"
},
"Action": "sts:AssumeRole"
}
]
}
- Go to the CatalogDetail CodeCommit repository and edit the buildspec-FISNodeDelete.yml file, then replace roleArn with the one you just created. Also, replace Nodegroups-Target-1 resourceArns with eks-staging workernode ARN.
- Now, deploy the Product Catalog application in both the clusters:
$ cd Accelerating-DevSecOps-on-AWS/chapter-09/
$ helm install prodcatalogapp productcatalog_application-1.0.0.tgz
- You should be able to access the application with the exposed Loadbalancer endpoint with port 9000:
$ export LB_NAME=$(kubectl get svc --namespace dsoapp frontend -o jsonpath="{.status.loadBalancer.ingress[*].hostname}")
$ echo http://$LB_NAME:9000
Enter the output in the browser after a minute to see the application:
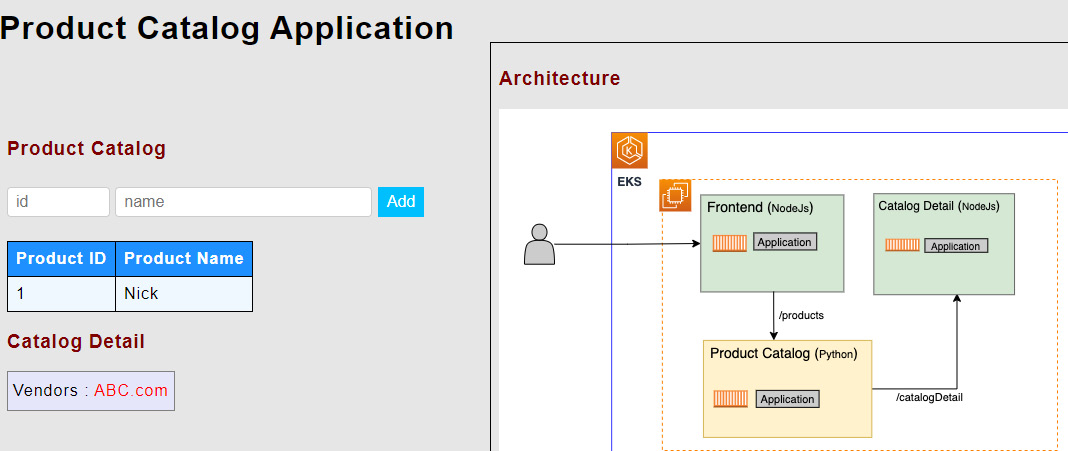
Figure 9.14 – Product Catalog Application UI
- You can also see the Deployment status in the dsoapp namespace:
$ kubectl get deployment -n dsoapp
NAME READY UP-TO-DATE AVAILABLE AGE
frontend 1/1 1 1 7m22s
prodcatalog 1/1 1 1 7m22s
proddetail 1/1 1 1 7m22s
So far, we have created the AWS resources for the DevSecOps pipeline. In the next section, we will install some security tools that CodePipeline will leverage to scan the application.
Installation of DAST and RASP tools
In this section, we will install OWASP ZAP in an EC2 instance, which will be used by the DevSecOps pipeline to scan the application once the new service is deployed in an eks-staging cluster. After the OWASP ZAP installation, we will install Falco in the EKS cluster.
Installing OWASP ZAP
We will be installing OWASP ZAP using the CloudFormation template. Perform the following tasks to configure OWASP ZAP to be used by CodePipeline:
- Make sure you have the chapter-09/owasp-zap.yaml file in your local machine.
- Go to the CloudFormation home page, click on Create stack, then select With new resource. In the Specify template section, select Upload a template file. Click on Choose file and select the owasp-zap.yaml file, and then click on Next.
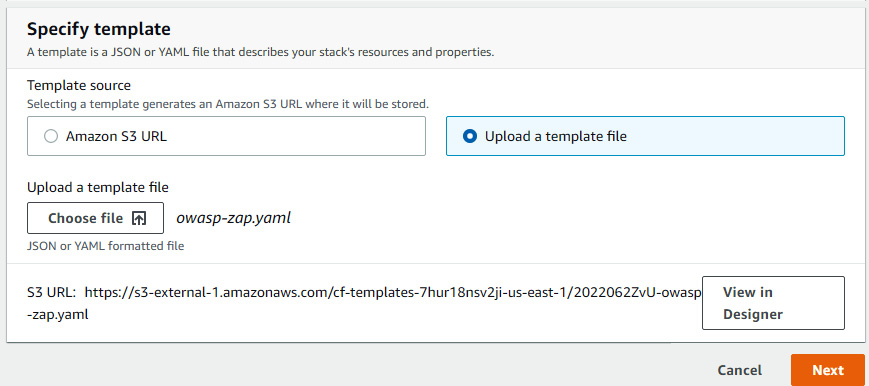
Figure 9.15 – Uploading a CloudFormation template
- Enter the stack name as owasp-zap. Modify the instance type. It is recommended to choose t2.medium or above because, during the scan, the CPU utilization of this server will spike up. Modify the SSH location to your home/office IP (make sure to provide the Classless Inter-Domain Routing (CIDR) range) and click on Next.
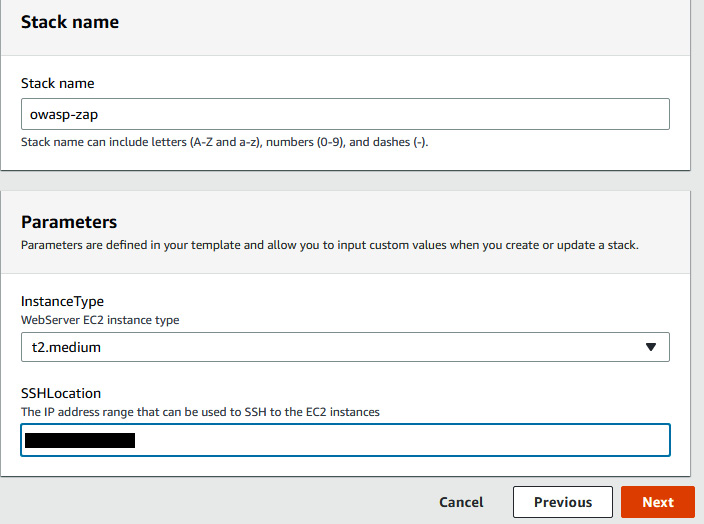
Figure 9.16 – Updating default parameters
- Provide the Tags key and value and then click on Next. Then on the Review page, click on Create stack. It will take 4 to 5 minutes to spin up an EC2 instance, and then run a user-data script to install owasp-zap and apache. You must have a default Virtual Private Cloud (VPC) in your account, otherwise, the stack will fail.
- When you see that the status of the stack is CREATE_COMPLETE, go to the Outputs tab, where you will see the OWASPZapURL value. Click on that and you will be redirected to the API reference UI page of OWASP ZAP:
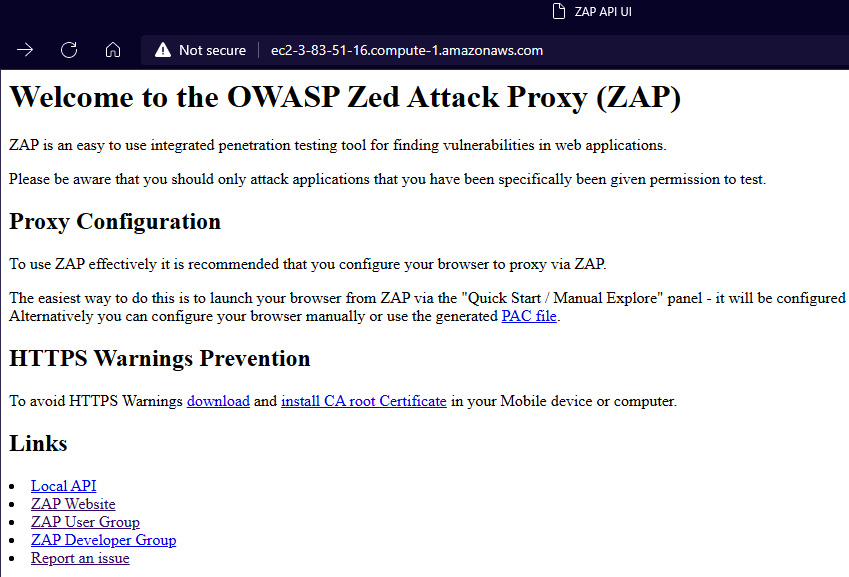
Figure 9.17 – OWASP ZAP API home page
- Now, we need to register the application endpoint where CodePipeline will run the DAST automation. Select LocalAPI | spider (not ajazSpider) | scan (url maxChildren recurse contextName subtreeOnly) in the Action section. In apikey, enter devsecopsapikey. In url, enter the CatalogApp load balancer endpoint with the port number of eks-staging. Enter true in recurse. Then, click on scan.
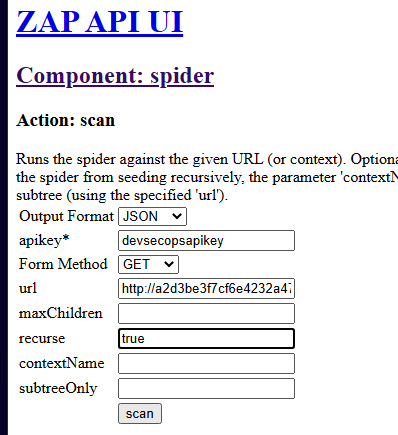
Figure 9.18 – ZAP spider scan on application endpoint
- Once you click on scan, it will return the scan ID with 0, as in {"scan":"0"}.
- Go back to the ZAP API UI welcome page, then select LocalAPI | ascan | scan (url recurse inScopeOnly scanPolicyName method postData contextId) under Actions. Enter the same details as before and click on scan.
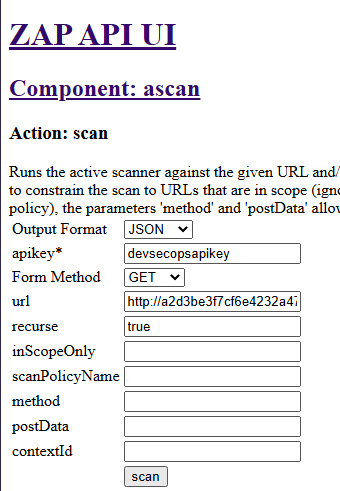
Figure 9.19 – ZAP active scan on application endpoint
- When you click on scan, it will return the scan ID with 0, as in {"scan":"0"}.
At this stage, OWASP ZAP is ready to scan the application using an API call that will be triggered by one of the CodeBuild projects residing in the DAST scan stage of the DevSecOps pipeline.
Installing Falco
We will be installing Falco using a Helm chart and demonstrating how it sends suspicious activity alerts to CloudWatch. Perform the following tasks to install Falco on eks-staging as well as eks-prod:
- Go to the chapter-09/falco folder and run the following command to create an IAM policy:
$ cd Accelerating-DevSecOps-on-AWS/chapter-09/falco
$ aws iam create-policy --policy-name EKS-CloudWatchLogs --policy-document file://iam_role_policy.json
- Attach this policy to the worker node IAM role. You can find the worker node IAM role by running the following command:
$ eksctl get nodegroup --cluster eks-staging -o yaml | grep NodeInstanceRoleARN
### You will get output something like, Copy the strings after role/
NodeInstanceRoleARN: arn:aws:iam::<YourAccountNo>:role/eksctl-eks-staging-nodegroup-ng-9-NodeInstanceRole-GD3WG0XJX7WO
### Attach the policy created in Step 1 in this Node IAM Role
$ aws iam attach-role-policy --role-name <THE ROLE THAT YOU COPIED NOW> --policy-arn 'aws iam list-policies | jq -r '.[][] | select(.PolicyName == "EKS-CloudWatchLogs") | .Arn''
- We just attached a policy to an IAM role that allows us to send the logs to CloudWatch. Now, let's install the FireLens service, which works in conjunction with Falco. FireLens at the backend works with fluent bit, so the manifest file that we are about to apply contains a fluent beat DaemonSet:
$ kubectl create -f configmap.yaml,daemonset.yaml,service-account.yaml
- Now, we can install the Falco Helm chart on the EKS cluster:
$ helm install falco falco-1.17.2.tgz
- You can verify the Pods running in the EKS cluster. At this stage, we will have the following Pods running in the EKS cluster:
$kubectl get pods -A
NAMESPACE NAME READY STATUS RESTARTS AGE
default falco-9w8q9 1/1 Running 0 2m45s
default fluentbit-pt22w 1/1 Running 0 7m28s
dsoapp frontend-7c856967fd-x8qjm 1/1 Running 0 11m
dsoapp prodcatalog-664486654d-kvc5d 1/1 Running 0 11m
dsoapp proddetail-6744fdccf9-vh6hr 1/1 Running 0 11m
kube-system aws-node-6n4dp 1/1 Running 0 48m
kube-system coredns-66cb55d4f4-6h8cr 1/1 Running 0 57m
kube-system coredns-66cb55d4f4-svgzw 1/1 Running 0 57m
kube-system kube-proxy-vpctb 1/1 Running 0 48m
- Now, you need to go to the CloudWatch home page and click on Log groups in the Logs section. You will be able to see the Falco log group. Click on Falco log group, and then select Log stream present under alerts. You will find that Falco has started sending those logs that violate the rules or checks present in the Falco configuration:
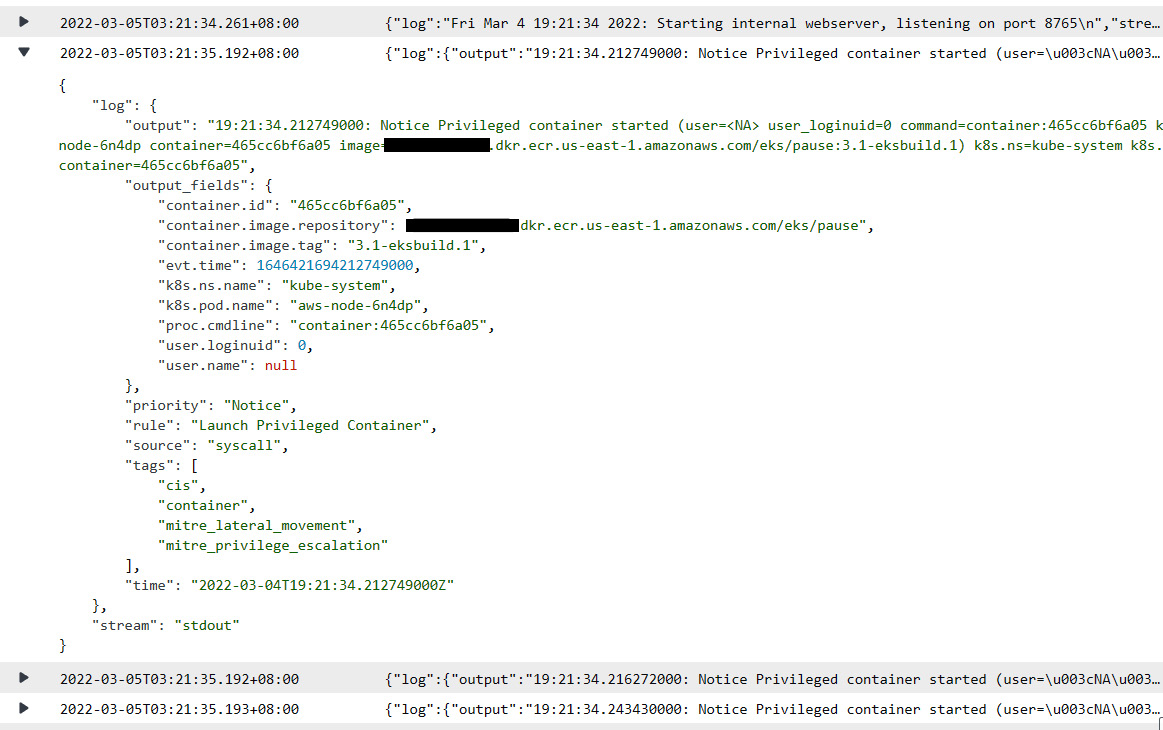
Figure 9.20 – CloudWatch log exported by Falco showing Pods noncompliant with rules
- You can ignore the preceding log because the aws-node Pod needs privilege permission as it's an EKS worker node system Pod.
- Generally, you won't want someone to make the remote connection to the shell of the Pod. Let's connect to one of the Pods and see what we get in the CloudWatch logs. We can connect to the prodcatalog Pod:
$ kubectl exec -it <prodcatalogpodwithID> -n dsoapp /bin/bash
- The moment you run the preceding command, you will see a new thread in the log events like the following. Falco alerted it because a new shell was spawned:
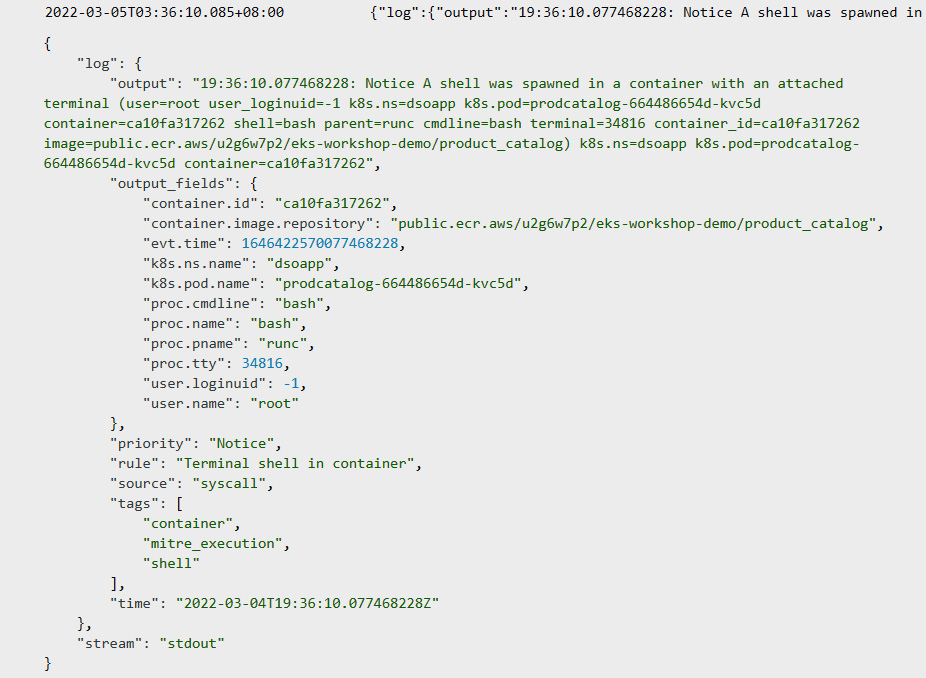
Figure 9.21 – CloudWatch log showing the start of a shell session in the prodcatlog Pod
- You can create a custom CloudWatch insight and an alarm using those metrics. Click on Logs Insights in the Logs section. Select falco in the Select log group(s) dropdown. In the text field, provide the snippet shown in the following figure, and then click on Run query:
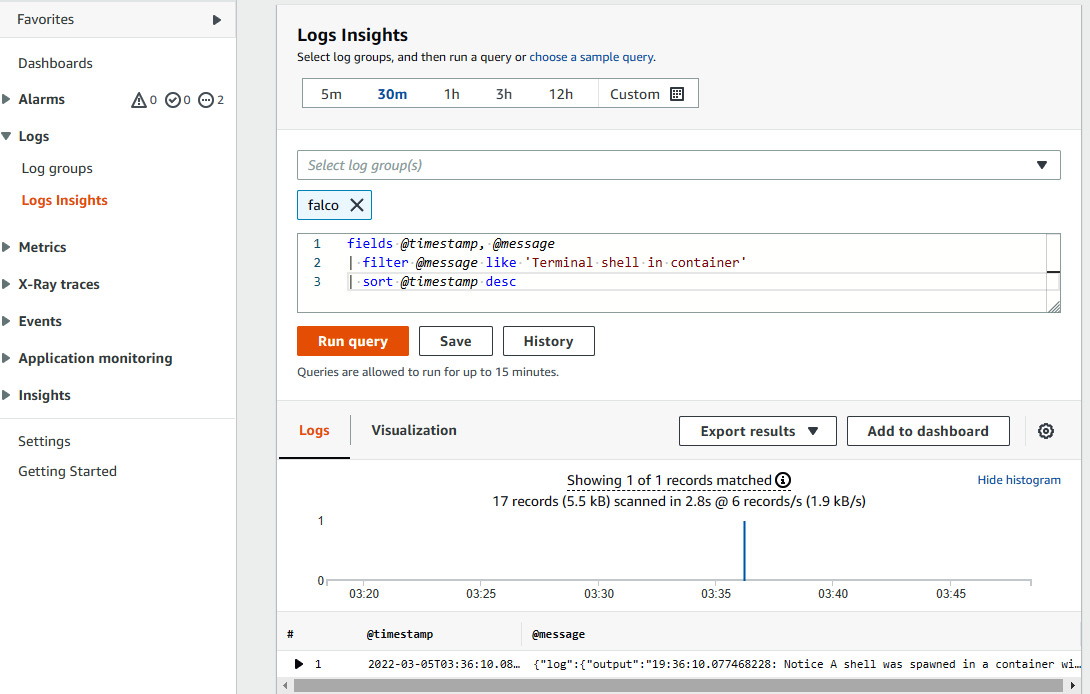
Figure 9.22 – Creating log insights to create an alarm
- You will be able to see the count of alerts. Now, click on Add to dashboard. Click on Create new and enter the dashboard name as dso-falco-alerts. Click on Create, and then click on Add to dashboard.
- Now, you can go to the Alarms section. Click on In alarm, and then click on Create alarm. Click on Select metric. In the AWS namespace section, click on Logs, then Log Group Metrics, and then select falco with the IncomingLogEvents metric name. Click on Select metric. In the Metric section, select 1 minute as the period. In the Condition section, select Greater/Equal than 1, and then click on Next. On the Notification page, make sure the alarm state trigger is In alarm. Select the SNS topic where you want to receive the email of the alert, then click on Next. Enter the alarm name as falco-Terminal-Shell-alarm, click on Next, and then click on Create alarm.
- If you do Step 8 again, you will receive an alert to the email address provided in the SNS topic:
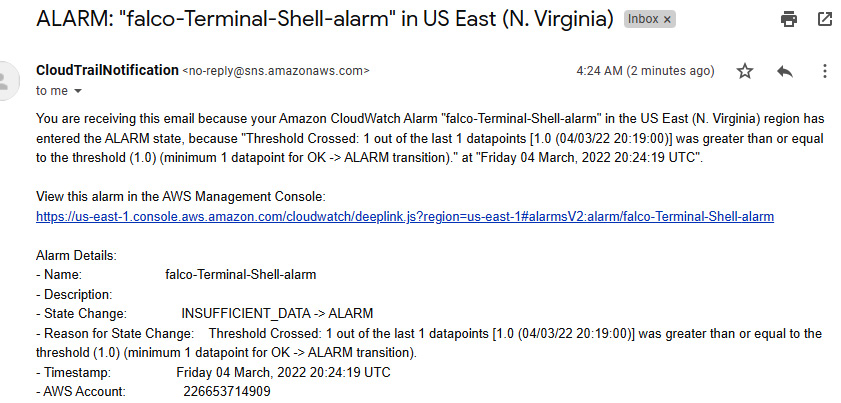
Figure 9.23 – Email notification in case of Falco rule violation
This way, you can get an alert if any suspicious activity takes place during runtime in your application Pod. Falco alerts on the basis of rules present in the configuration . If you want an intelligent system where the system automatically detects the present working metrics of the application and any anomalies that take place and sends an alert as well as providing recommendations, then you can integrate the application with DevOps Guru, which is an AIOps service provided by AWS. We will integrate the DevOps Guru service with the application running in both staging and prod environments in the next section.
Integration with DevOps Guru
It is strongly recommended that you read Chapter 10, AIOps with Amazon DevOps Guru and System Manager OpsCenter, and complete the third section (Enable DevOps Guru on EKS cluster resources) with respect to the CloudFormation stack that we created in this chapter, which is eks-staging and eks-prod.
Creating a CI/CD pipeline using CloudFormation
In this section, we will create a CodePipeline project that gets triggered the moment any code change gets pushed to the CatalogDetail repository. This CodePipeline project executes the following stages and actions in sequence:
- The CodePipeline project will first read the changes from the source and then go to the Build-Secrets stage.
- At this stage, the CodeBuild project will start scanning repository code with the git-secrets utility and look for any secret leakages. After the completion of this stage, the Build-SAST stage will start executing.
- The Build-SAST stage consists of two actions. The first action is SAST analysis, which invokes Anchore to scan the Docker build and then generates the report. Based on the vulnerability status, if there is a high or critical CVE, then the build will fail; otherwise, it will continue to build and push the image to the ECR repository. The next action is ECR-SAST-and-STG-Deploy. This action performs the ECR image scanning on the Docker image and, depending on the vulnerability status, it will fail or deploy the image in the staging EKS cluster. Both actions will trigger the Lambda function at the end of the build. This Lambda function uploads the generated report to AWS Security Hub.
- Once the Build-SAST stage succeeds, then Build-DAST starts executing. The Build-DAST stage includes the DASTAnalysis CodeBuild project, which will invoke OWASP ZAP to perform a scan on the catalog app deployed in the eks-staging cluster. Depending on the alert status, this build will either fail or succeed. This build also triggers the Lambda function to upload the generated report to AWS Security Hub.
- Once the Build-DAST stage succeeds, the transition goes to the Build-ChaosSimulation stage. This stage includes two actions. The first action, FIS-EKSNodeDelete, runs the chaos simulation of deleting the worker node using the Fault Injection Simulator (FIS) experiment template. The second action, FIS-ReportGenerate, monitors the worker node, application endpoint, and Pod status.
- After that, the Manual Approval stage will ask for your approval to deploy the application in the production environment.
- With positive approval, the Deploy-PRD stage will deploy the latest service in the eks-prod cluster.
This is the entire sequence flow for the CodePipeline. Now let's create the CodePipeline using the dsopipelineCFT.yaml CloudFormation template present in the chapter-09/CICD folder:
- Go to the CloudFormation home page, click on Create stack, select With new resources, and click on Upload a template file. Upload the dsopipelineCFT.yaml file and click on Next.
- You will see the Specify stack details page. Provide the information in the following manner:
- Stack name: dsostack
- BranchName: master
- RepositoryName: CatalogDetail
- EcrRepositoryName: catalogdetail
- EksClusterName: eks-staging
- EksProdClusterName: eks-prod
- SASTTool: Anchore
- DASTTool: OWASP-Zap
- OwaspZapURLName: <OWASP-ZAP Endpoint> (you can get that from the output of the owasp-zap CloudFormation stack)
- OwaspZapApiKey: devsecopsapikey
- ApplicationURLForDASTScan: <ELB endpoint of frontend-node kubernetes svc>
- LambdaPackageLoc: dsos3lambda-<YOURACCOUNTNO>
- LambdaPackageS3Key: import_findings_security_hub.zip
- LambdaHandlerName: import_findings_security_hub.lambda_handler
- PipelineNotificationsEmail: YOUREMAILADDRESS
- PipelineApproverEmail: YOUREMAILADDRESS
- Skip other parameters.
- Click on Next once you are done filling in all the details. Click Next to review. Click on the checkbox for IAM resource creation. Then click on Create. It will take a few minutes to create all the resources. Once the stack creation completes, you need to go to the CodePipeline page and click on dsostack-pipeline. You will see the pipeline stages as follows:
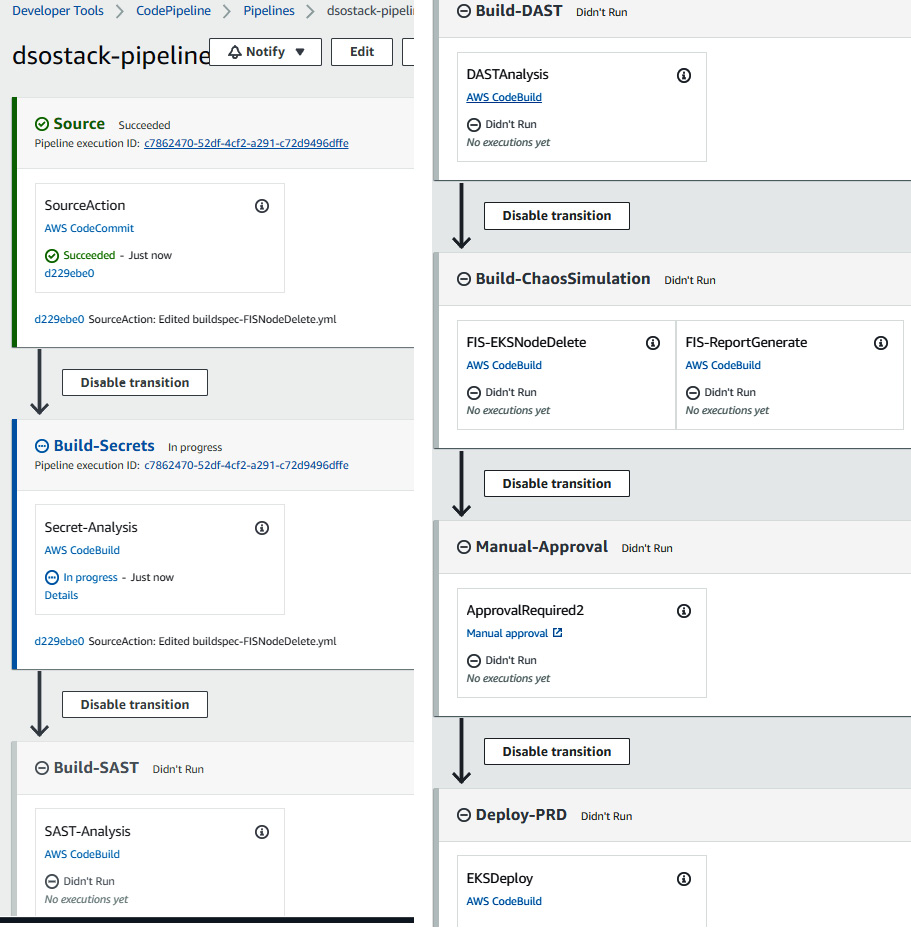
Figure 9.24 – CodePipeline stages for the DevSecOps pipeline
The pipeline will automatically start running. So, we have just created a CodePipeline instance. In the next section, we will validate all the stages.
Note
The buildspec files used for the activity have been created with respect to the us-east-1 region. You may need to modify the buildspec files if you are using them in a different region.
Testing and validating SAST, DAST, Chaos Simulation, Deployment, and RASP
In this section, we will be analyzing all the build stages and looking at how the security tools scan, generate the report, and fail the build. We will also try to bypass the vulnerabilities by tweaking the buildspec file to go to the next stages because the aim of this chapter is to integrate the security tool, scan, and fail rather than fixing the vulnerability. We will start analyzing with the following sequence:
- The first stage after the source is Build-Secrets. If you navigate to the logs of this CodeBuild project, you will see that this stage first clones the repository and then runs a git secrets scan on the source code. Since there are no secret leakages, this stage succeeds and moves to the next stage, which is Build-SAST:
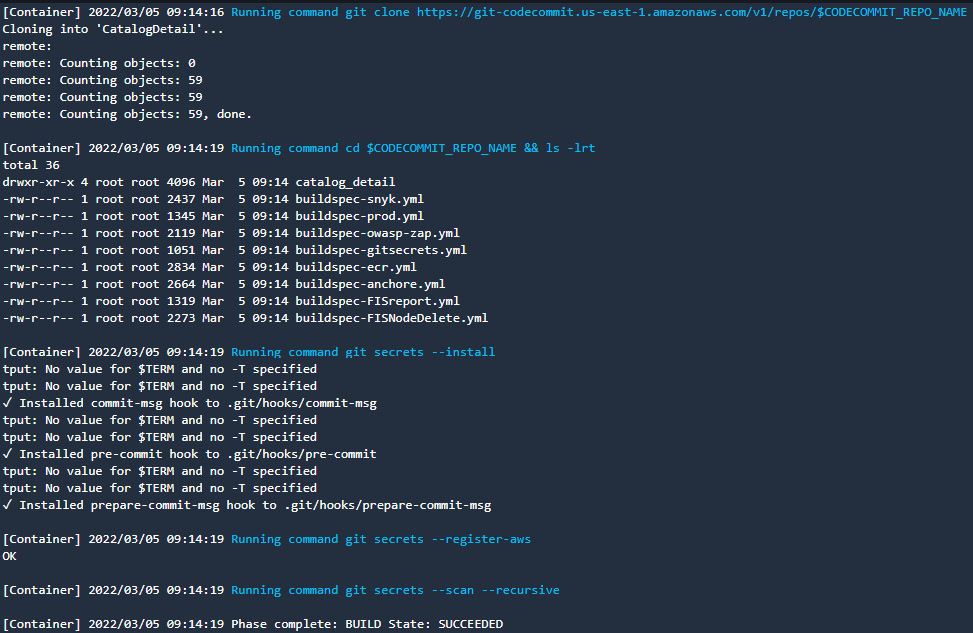
Figure 9.25 – CodeBuild logs showing the git secrets scan on source code
- In the Build-SAST stage, if you go to the build logs of the SAST-Analysis action, you will see that the Anchore scanner has identified lots of vulnerabilities with High, Critical, and Medium severities. Depending on the logic given in buildspec-anchore.yml, the build should fail if it finds High or Critical vulnerabilities. So, the SAST-Analysis action failed, by pushing the generated report to AWS Security Hub via the Lambda function:
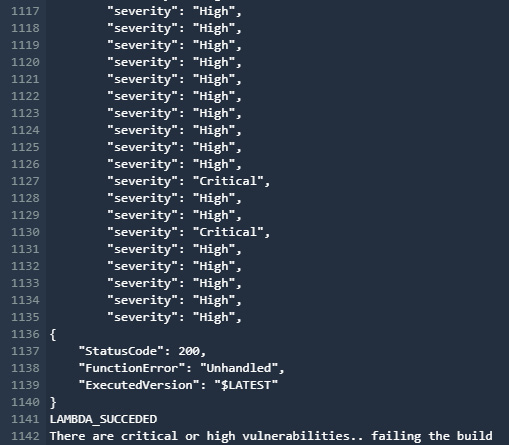
Figure 9.26 – CodeBuild project build failed due to the presence of Critical and High vulnerabilities
You can also go to the AWS SecurityHub console to see the findings as follows:
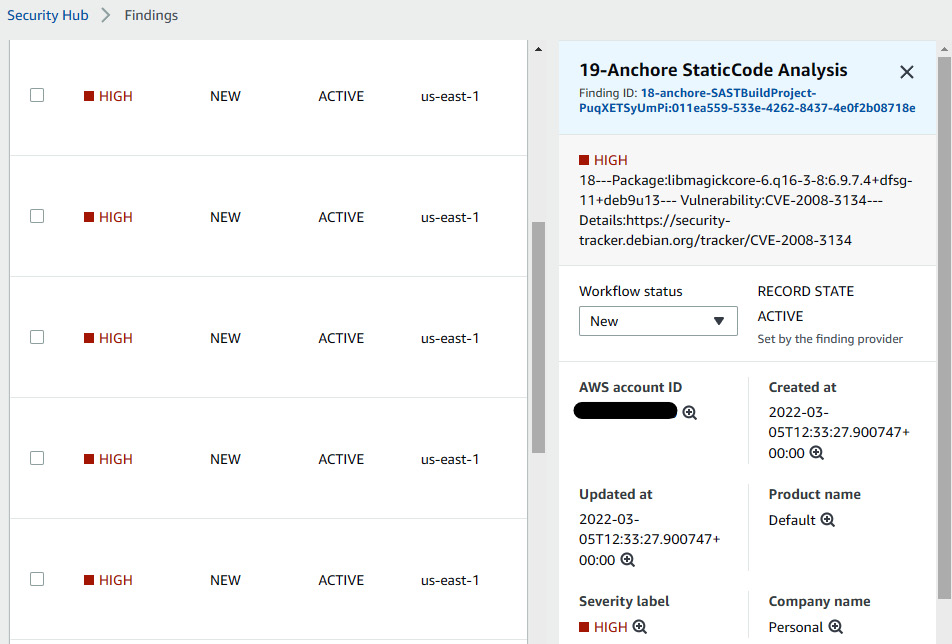
Figure 9.27 – The Security Hub console showing the Anchore vulnerability report
Now, based on the findings, we can see that there are lots of OS- and language-related vulnerabilities that we need to fix. The main lesson here is to build our own (internal) base Docker image, continuously scan and fix it, and provide that Docker image to developers where they will build their application code. It's a similar concept to using the custom patched and secured AMI. Now, to bypass this, we need to tweak the buildspec-anchore.yml file and commit it. Go to the CodeCommit console and edit the buildspec-anchore.yml file. In the post_build command's if condition, remove High|Critical and enter Random instead. In the elif condition, enter High|Critical|Medium, and commit the changes. It should look like the following:
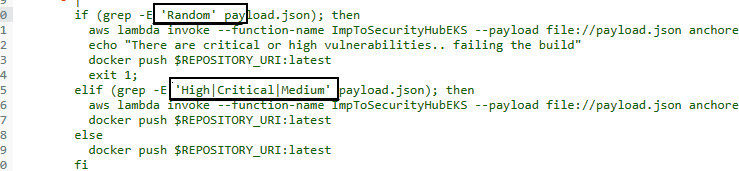
Figure 9.28 – Editing the buildspec-anchore.yaml file
Once you commit the changes, the CodePipeline project will rerun and you will see the SAST-Analysis action succeed:
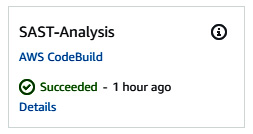
Figure 9.29 – SAST-Analysis CodeBuild project succeeded
After the SAST-Analysis action, the ECR-SAST-and-STG-Deploy action will run. This action will retrieve the ECR image scan result and compare the vulnerability severity status. If the severity matches with HIGH and CRITICAL, then the build will fail; otherwise, it will deploy the service to the eks-staging cluster. In this case, we got the result of 35 high and 2 critical severities, and that led to the build failing:
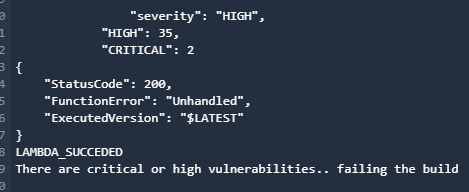
Figure 9.30 – CodeBuild project build failed due to the presence of critical and high vulnerabilities
So, this is another layer on which we can scan for vulnerabilities. You can find the generated report as a finding in Security Hub:
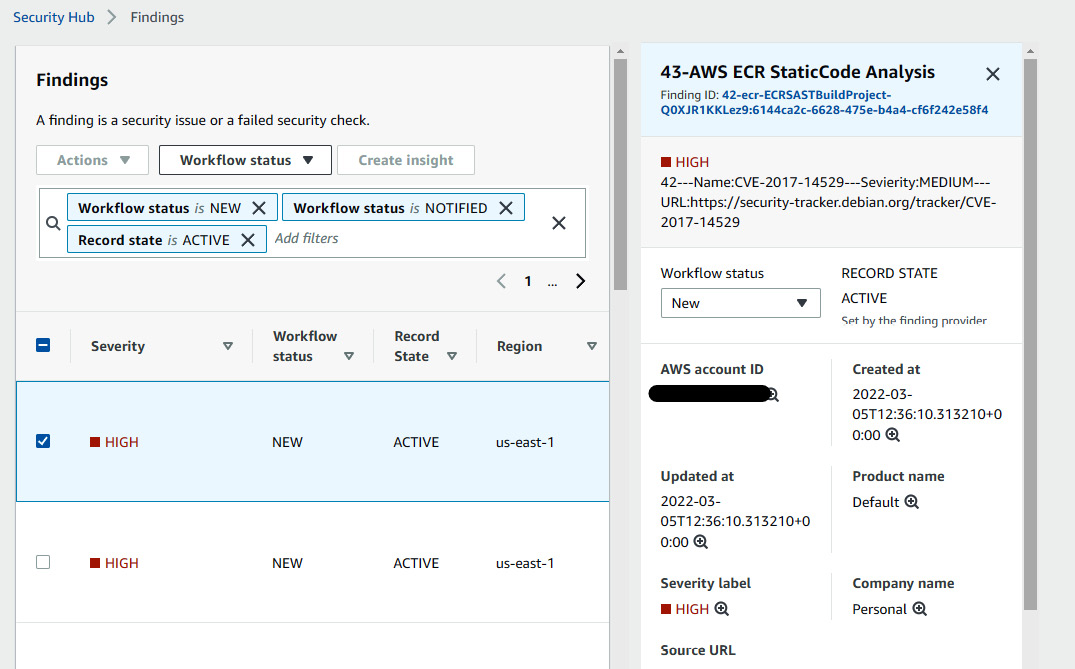
Figure 9.31 – Security Hub console showing the ECR vulnerability report
We will bypass this stage also by modifying the buildspec-ecr.yml file. We will tweak if-else-logic in the post_build commands to allow the HIGH and CRITICAL string and commit the changes (use a word such as bridions instead of random in this case):
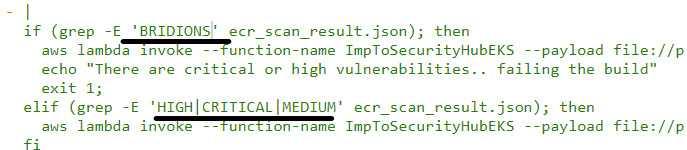
Figure 9.32 – Editing the buildspec-ecr.yaml file
Once you commit the changes, CodePipeline will re-run and this time, the build will succeed and the latest image will be pulled in the proddetail deployment in EKS cluster. The latest image will replace the existing one, which was a public Docker image. You will be able to see the application running with the latest image. You can describe the proddetail deployment in the EKS cluster to verify the image version:
- Once the SAST stage succeeds and deploys the service to eks-staging, the DAST stage will run and trigger OWASP ZAP to scan the application. Depending on the result, it will fail or pass the build. If you look at the build logs, you can see that the build failed because of the presence of high and medium alerts:
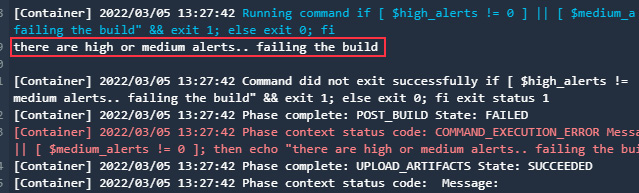
Figure 9.33 – CodeBuild project build failed due to the presence of high and medium alerts
You can verify this and analyze the DAST result in Security Hub:
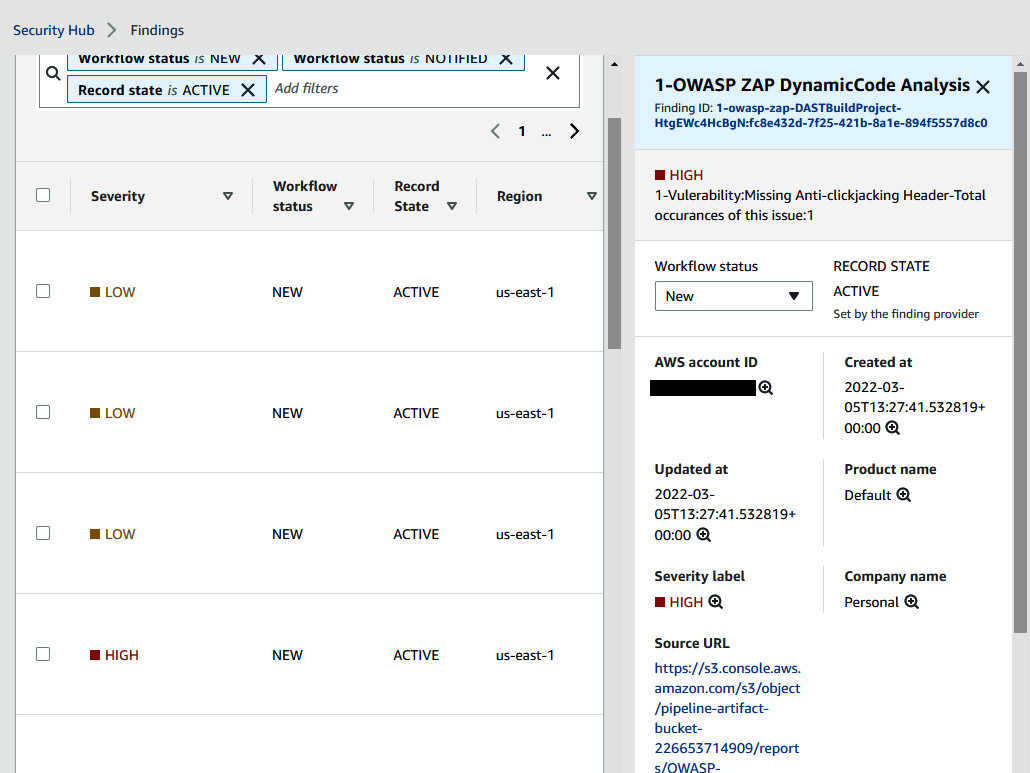
Figure 9.34 – CodeBuild project build failed due to the presence of high and medium vulnerabilities
You need to comment out the last line of the post_build commands in the buildspec-owas-zap.yml file and commit the changes:

Once you commit the changes, the CodePipeline will rerun and, this time, the DAST stage will succeed and trigger the next stage, which is Chaos Simulation:
- In the Build-ChoasSimulation stage, there are two parallel actions. The first action will delete 50% of worker nodes in a nodegroup and the second action will monitor it for 5 minutes:
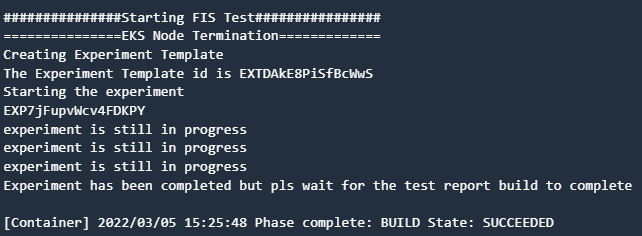
Figure 9.35 – CodeBuild log showing FIS experiment completion
The following figure shows the report of the FIS experiment that shows the unavailability of Pods and nodes:
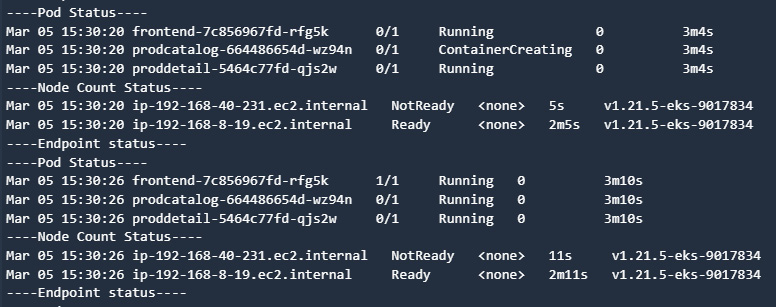
Figure 9.36 – CodeBuild logs showing the worker node and Pod are in the restarting and not ready state
The following figure shows the report that the endpoint, Pod, and nodes are available at their full capacity:
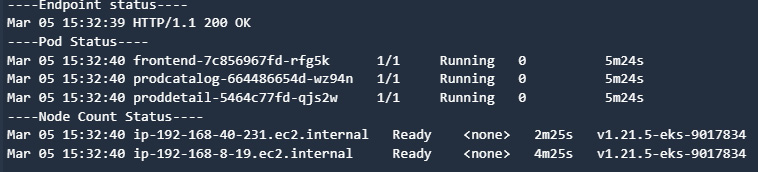
Figure 9.37 – CodeBuild logs showing the endpoint, Pod, and node status
- Once the Build-ChaosSimulation stage succeeds, there will be an email sent to the email address that you provided during the creation of the dsostack CodePipline for approval, and then there will be a manual approval required too. You need to allow that to deploy the latest image in the production EKS cluster:
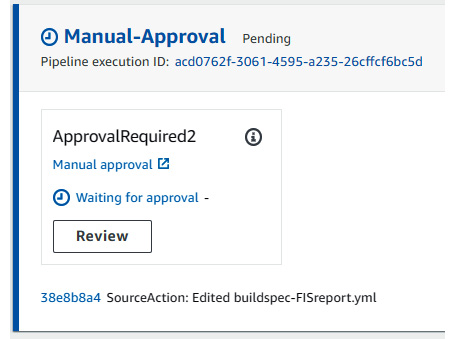
Figure 9.38 – CodePipeline manual approval stage waiting for approval
The following figure shows what happens when you click on Review and it asks you to leave comments:
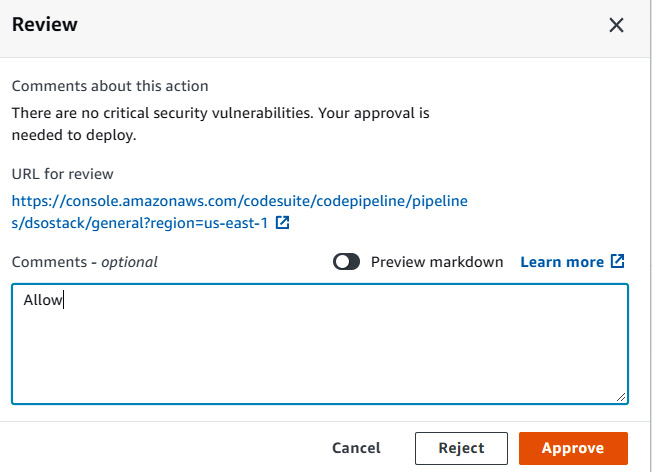
Figure 9.39 – CodePipeline approval page
- Once you provide the approval, the Deploy-PRD stage will deploy the latest image in the eks-prod cluster:
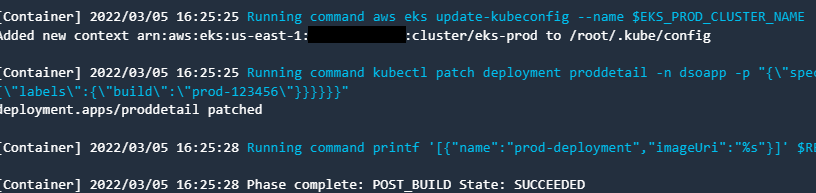
Figure 9.40 – CodeBuild log showing the deployment of a service
- In the end, your entire pipeline will look like this:
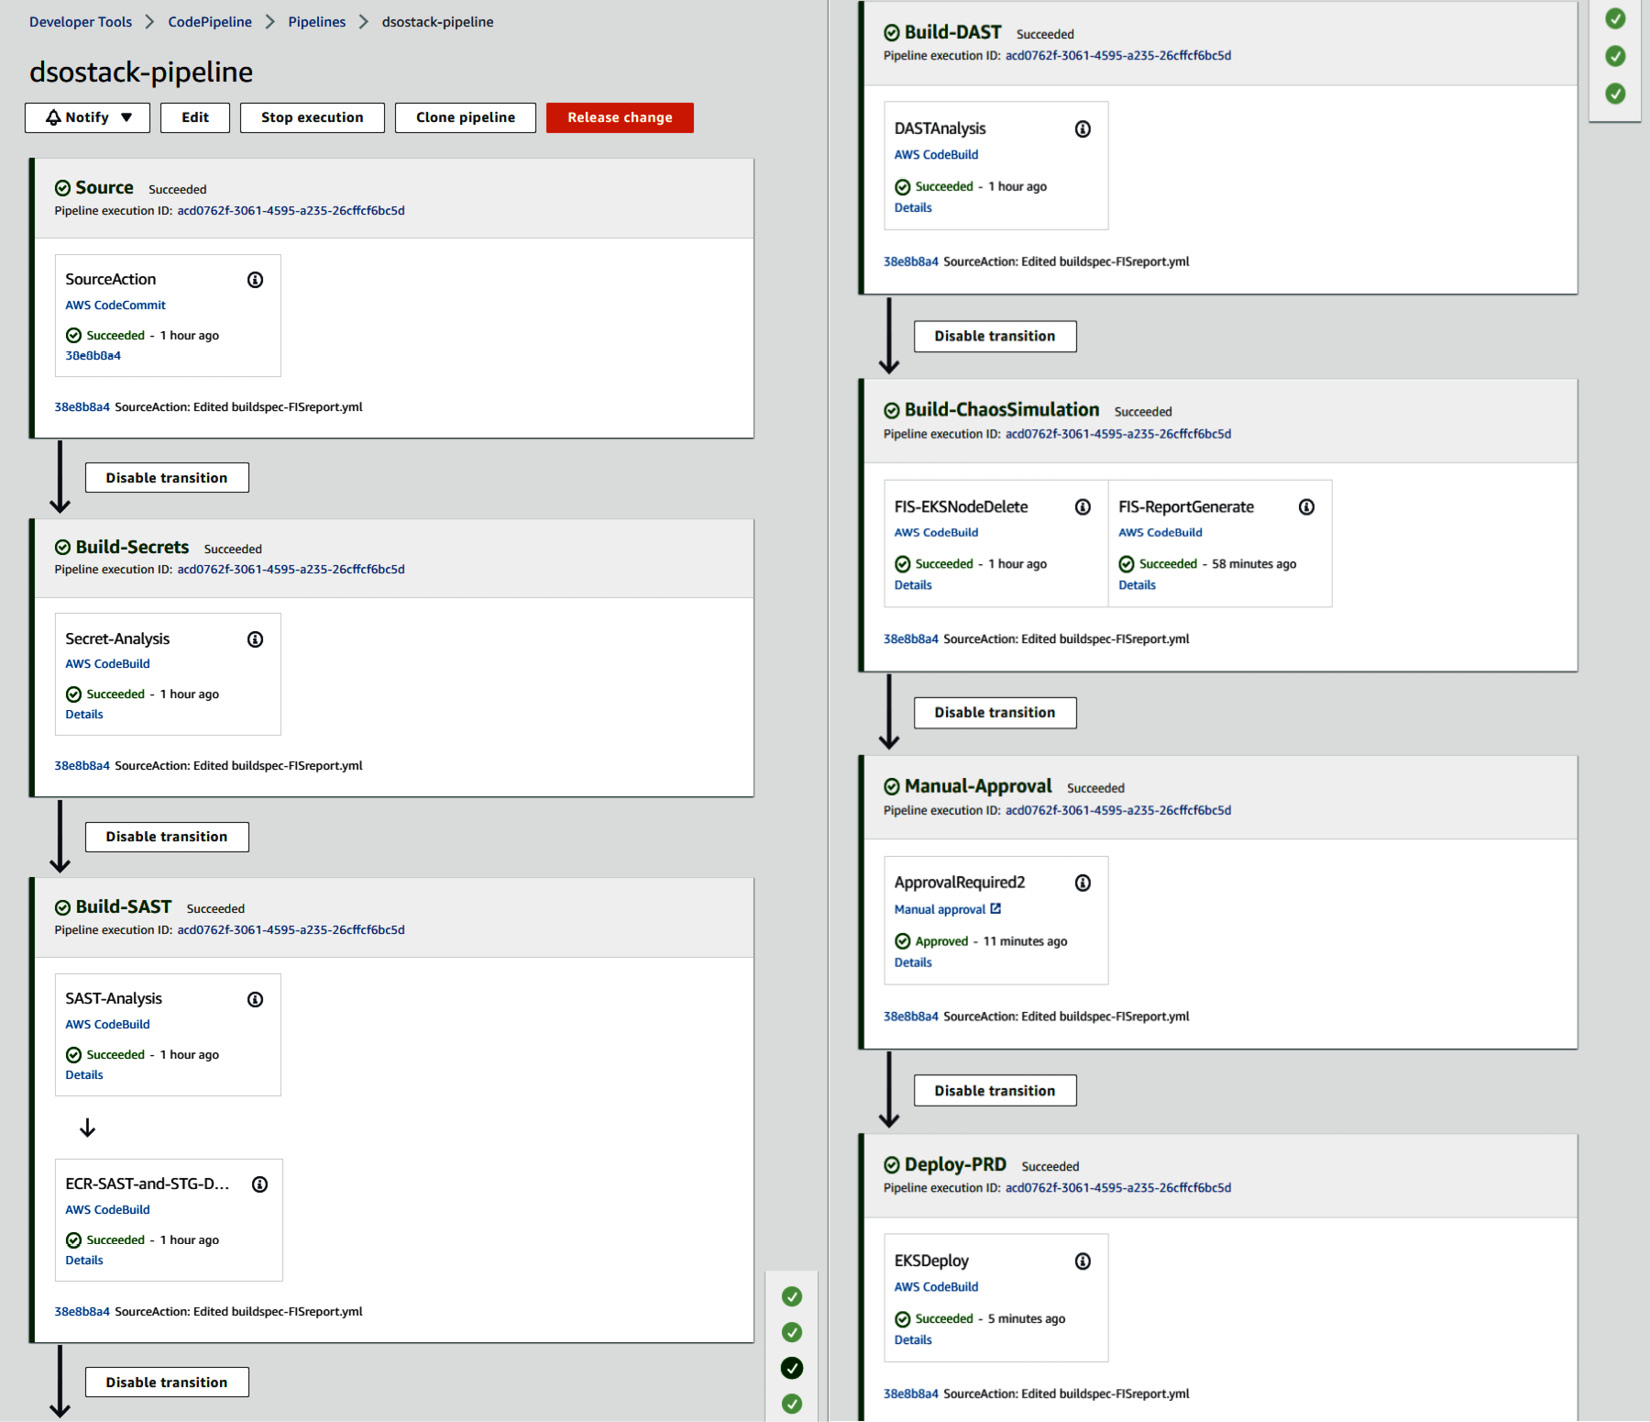
Figure 9.41 – Overall CodePipeline stage succeded
These are the steps that CodePipeline project executed using native services as well as the open source security tools. You can verify the Falco functionality by connecting to any Pod; you will receive an email alert with the subject falco-terminal-shell-alarm.
You can replace the catalog_detail service code by entering your own service code, and tweak the buildspec files to have a smooth run for CodePipeline. So, we have just validated the functionality of security tools and their integration with AWS services. We haven't covered the validation of DevOps Guru yet, because we are covering it in the next chapter. Before we dive into DevOps Guru, there are certain machine learning concepts that you must be aware of. We wanted to isolate the security concepts so that they don't overlap, but since we have finished our final DevSecOps pipeline, in the next chapter, we will learn more about the AWS AIOps service, DevOps Guru.
Summary
In this chapter, we learned about the importance of implementing security at the early stages of software delivery. We discussed the various techniques for security checks that can be implemented in a CI/CD pipeline. We covered the important concepts of security advisory tools, pre-commit secret checks, SCA, SAST, DAST, and RASP. We learned more about the tools by installing and validating them. We created an end-to-end pipeline with a microservice and deployed it to an EKS cluster. We validated all the security checks at every stage of the pipeline. Now, you can easily create a robust pipeline within your environment with your use cases. Remember that security is everyone's responsibility. With great power and freedom also comes greater responsibility to use that freedom in a secure manner.