
Repetitive actions as encountered in the fading or flashing of LED intensity, the square-wave electrical signals for digital-logic clocks, electromagnetic waves, alternating current electricity, rotating motors, mechanical vibrations, sound waves, and pendulum or even planetary motions are recurring events in completely different contexts. However, all have a common feature in that there is a time period over which their individual cyclic actions repeat. A repeating event such as the vibration of a musical instrument string may take place thousands of times a second, while the Moon orbits the Earth on a monthly basis. Frequency is a measure of the number of times an event occurs in a unit of measurement. The units of measurement can take several forms and involve such diverse entities as time, spatial orientation, biochemical composition, or genetics and traits of populations.
Sensors, physical computing, and data processing are often used to monitor the electrical signals generated by sensors monitoring a repeating physio–chemical event that results in a repetitive electrical-signal variation.
As noted in the studies of Galileo concerning pendulum oscillation, the time required for a cyclic process to repeat is termed the period. Frequency is the inverse of the period and is noted as
f = 1 / T
where f is the frequency and T is the period of the repeating event. When a frequency is described in terms of the number of repetitions or cycles of the event that occur in a time of one second, the unit of frequency is cycles per second (cps), also known as hertz and written as Hz in honor of Prof. H. Hertz, who discovered radio waves in the 1880s.
In biological, chemical, and certainly astronomical or geological investigations, many repetitive phenomena and reactions occur at time scales measured in minutes, hours, or significantly longer time spans that can be considered as the extreme low end of the frequency scale. Certain ranges of frequencies have been given names, such as the audio frequency range that is defined by the typical frequencies audible to humans and the ultrasonic range that is above the human hearing scale. Dogs, elephants, orcas, dolphins, and bats are all known to have hearing capabilities either above or below the frequency range sensed by humans.
Events that occur over much longer time scales have come to be described in terms of their period. Visible-light frequencies are in the 4 to 8 MHz range, while most animal migrations occur twice per annum.
In some investigations involving frequency, the period of a cyclic wave–like event can be referred to as the wavelength. In Figure 6-6 the full cycle caption defining one complete oscillation of the waveform is often termed the wavelength of the signal.
In keeping with the introductory nature of this book, the frequency ranges being considered for measurement are those accessible with the readily available materials and electronic components accumulated thus far in developing the previous exercises and measurement techniques.
A distinction exists between electrical signals that do not vary in intensity over time and can be classified as static DC signals and electrical signals that vary repetitively over a fixed interval of time. Cyclic signals can be measured with techniques that determine either the frequency or period of signal oscillation. This chapter describes the techniques for measuring electrical signals with respect to their frequency or their period.
High-frequency electrical signals over the megahertz (106 cycles per second) range require special equipment to measure and visualize. To minimize cost and complexity, the experimental portions of this chapter will be confined to the frequencies accessible with inexpensive, readily available, and well-documented signal generators. A simple signal generator can be assembled around any of the 555 timers as depicted in Figures 6-1 and 6-2. Websites and kits are available to make more complex sine-, triangle-, and square-wave signals from both the 555 timer and Arduino microcontrollers. An inexpensive function generator available from Elenco Electronics ($60 USD) as depicted in Figure 6-3 was used by the author to generate some of the data used in this chapter.
Microcontroller high-speed computational software clocked in the megacycle range is amenable to measuring kilo (kHz) and mega (MHz) cycle frequencies with code that monitors whether a digital pin is connected to a high- or low-logic source. However, when a signal frequency drops into the double-digit, single-digit, or fractional Hz range a different measuring technique must be used. For higher-frequency signals the counting of cycles per second is measured, while for lower-frequency signals the inverse concept of seconds per cycle or period may be required.
As noted in previous texts, when designing a process for measuring physio–chemical phenomena through the use of detectors or transducers, the characteristics of the electrical signal produced by the phenomenon–detector combination at hand must be reproducible before any form of quantitative data collection can be considered.
Experimental
An Arduino library can be used to create an experimental frequency-measurement system that can be read from any host computer. The FreqMeasure library is available from the Arduino organization (https://www.arduinolibraries.info/libraries/freq-measure). The library is provided in two formats: FreqMeasure, for measuring the frequency of signals in the 1/10 to 5 or 6 Hz range; and FreqCount, for measuring signal frequencies in the kilohertz range.
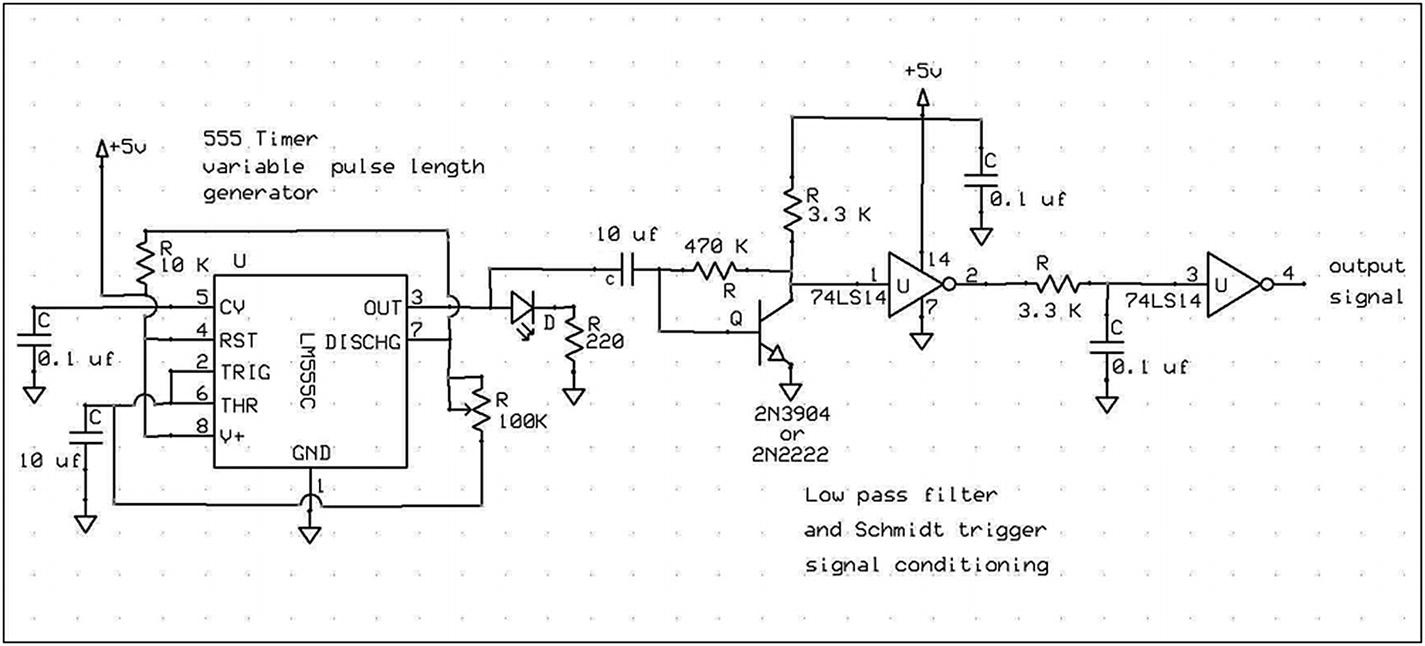
Circuit diagram for a variable low-frequency pulse generator
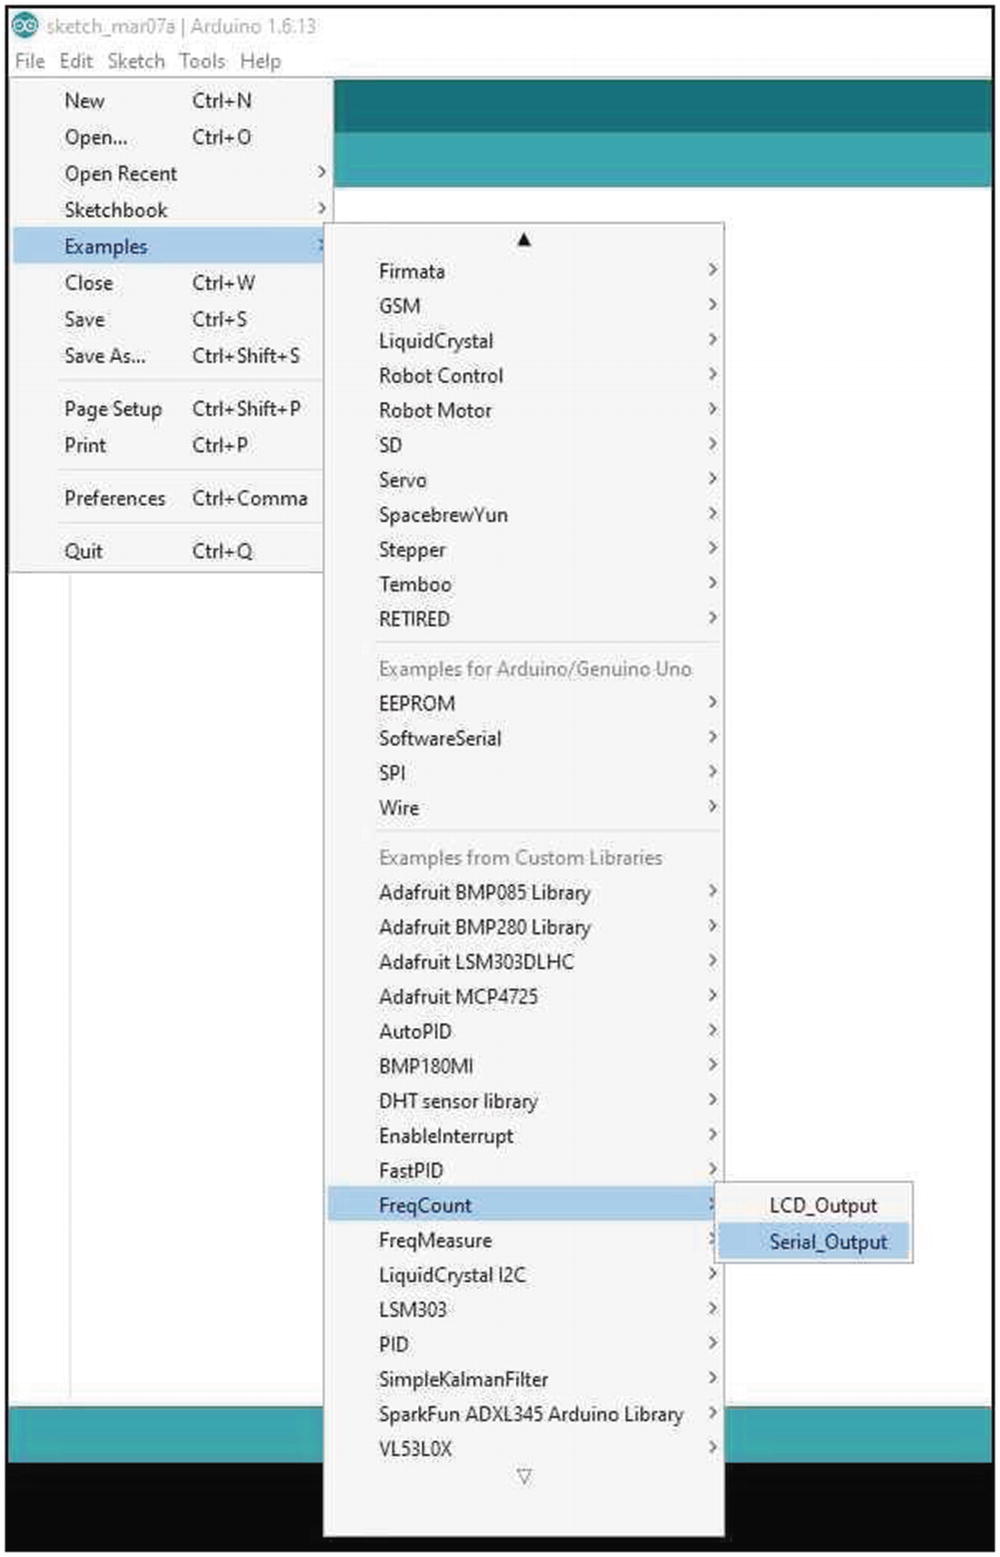
The Arduino frequency measurement selections menu
Two program options are available to the investigator, as can be seen in Figure 6-2. FreqMeasure is a program that measures the half-period of the signal cycle, while FreqCount measures cycles per second count in kHz.
In Figure 6-3, two signal generators are depicted, along with a Sparkfun Red Board Arduino–type microcontroller. A prototype of the circuit in Figure 6-1 is seen on a 2¼ x 3¼ in. (5 x 8 cm) breadboard along with an Elenco FG500 commercially manufactured signal source.
If a sensor signal from an experimental setup, kit-assembled, or breadboard prototype function generator is to be monitored by the microcontroller’s resident frequency-counting software, the signal’s amplitude must be large enough to positively measure as a digital logic 1 or 0 on the system at hand.
Oscillating signals from an experimental setup can be monitored as a stream of numerical values, as seen in Figure 6-4, to provide a measured numerical value that may be required as part of an electronic filter design process.
Frequency values may also be plotted to record a change in frequency with time. In both options available in the menu selections seen in Figure 6-2, the measurement output can be streamed to the serial port. Subject to the limitations inherent in the response times of the DAQFactory, RPi, and Arduino serial port plotter, the host computer’s graphical display programs can be used to record the sensor frequency as a function of time. In Figure 6-5 the Elenco FG500 has been connected to a microcontroller, and the output from the FreqMeasure program measuring the half-period time of the signal cycles has been plotted as a DAQFactory strip-chart recorder display. The data in the display has been generated by setting the coarse dial on the FG500 to the 10 scale and rotating the fine dial to the degrees indicated in the captions of the display. The same type of display seen in Figure 6-5 can also be created with the Arduino plotter.
Examination of the two exemplar programs provided with the Arduino library reveals that the FreqMeasure program has a digital signal-processing default code that collects thirty values for averaging the data integrated into the code. Signal-noise reduction by the averaging of data requires time. If the signal being sampled has a large cycle time then the averaging of readings will multiply the already long sample measurement time by the number of data points collected. As a consequence of the multiplied time between data collection, the investigator may experience wait times of multiple seconds or minutes before data appears on the serial monitor.
The code in the examples can be adjusted by the investigator to control the rate at which data is streamed out to the serial port for single-value read-out or plotting.
Care must be exercised when using the FG500 as the square-wave output can rise to 8V and could possibly damage 5V or 3.3V detector circuitry. Sine and triangular wave outputs are variable from 0V to 3V peak to peak.
It is noted by the library author that the measuring programs are interrupt driven and hence should not be used with programs that employ interrupt timing on the microprocessor.
Observations
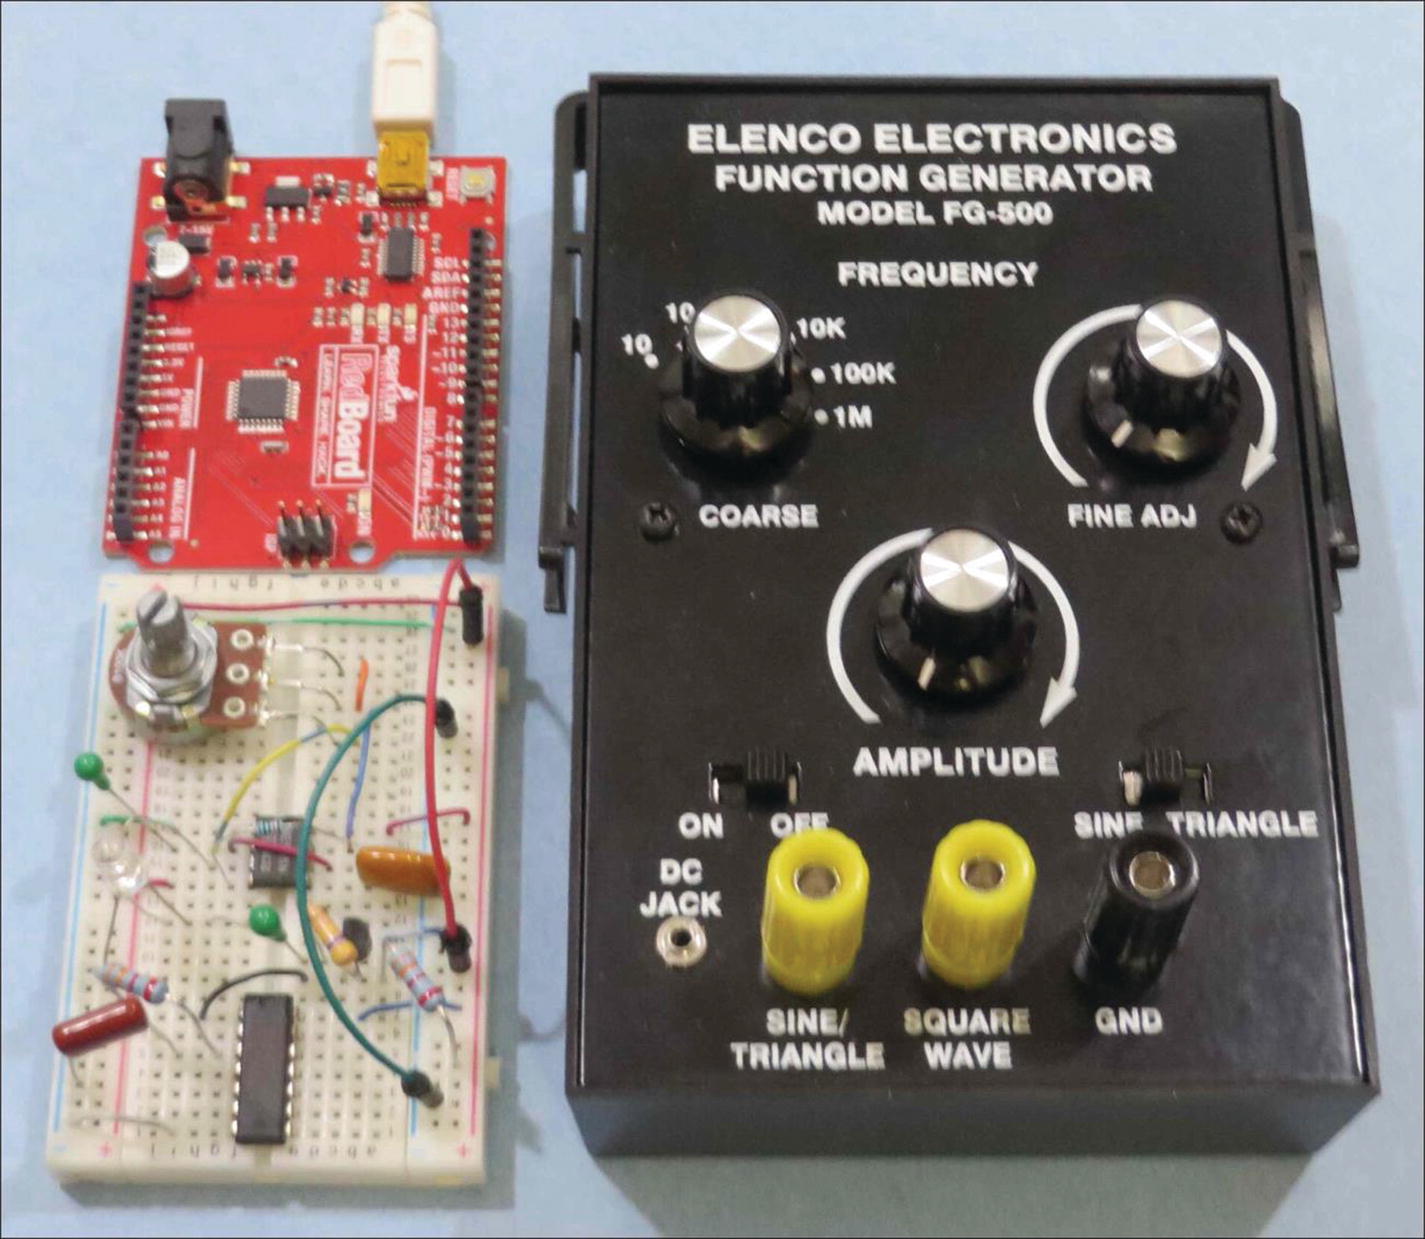
A prototype signal generator with signal conditioning circuitry, FG500, and Red Board Arduino
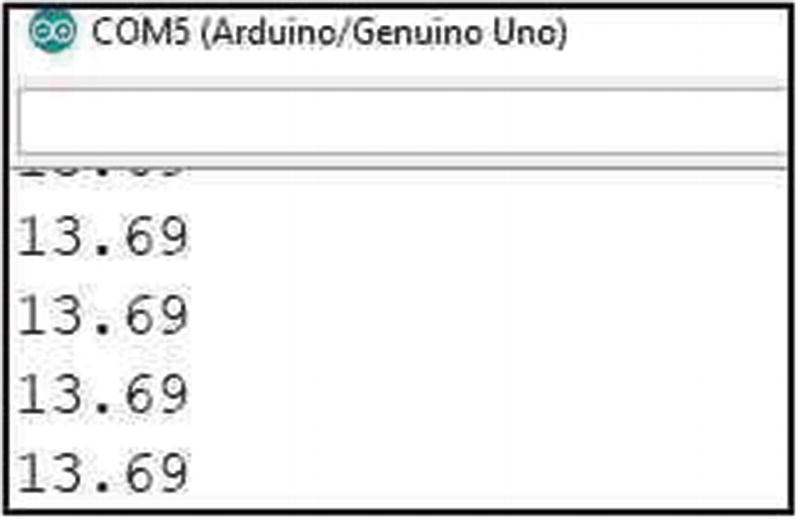
Streamed serial port data from FreqMeasure program

Frequency values generated by fine adjust control rotation Elenco FG500
Discussion
The URL found in the “Experimental” section directs the investigator to the Arduino libraries information site, which contains a link to the FreqMeasure creator’s web page (http://www.pjrc.com/teensy/td_libs_FreqMeasure.html).
In Figure 6-6, a square wave as is produced by the 555 timer output has been captioned similar to the sine wave illustration found at the FreqMeasure website, indicating the cycle length and the half-period portions of the waveform used in the FreqCount and FreqMeasure libraries, respectively.
The cycle period and wavelength concepts are used in the study of the mechanics of waves and wave propagation. If required for further experimental design, the details regarding the relationship between the velocity of propagation, wavelength, and period can be found in most physics textbooks.
The FreqMeasure site provides extensive details on the construction and applications of the two software methodologies for determining the frequency of rapidly and slowly oscillating signals. For the testing and validating of experimental applications of either library function, generators can be inexpensively fabricated from 555 timers. Varying the RC timing components in the circuitry of Figure 6-1, and a large number of websites can provide circuits for single or multiple waveform outputs that can provide a fixed- or variable-frequency signal for experimental setup validation. Low-pass filters are optional and may not be necessary in low-noise experiments.
Kits and commercial function generators are available from most electronic supply facilities. Regardless of the source of the function generator, in order to achieve the correct determination of the frequency of the signal under study, the generator signal must be strong enough to be read by the logic circuitry of the microprocessor and be of a uniform oscillation period. Experimenting with the amplitude control on the FG500 while generating a sine wave with a 3V peak-to-peak maximum voltage caused a loss of counting capability in the FreqCount program at approximately half of the dial rotation. It is recommended that the function generator outputs be compatible with a TTL load of 5V.
Irregular waveforms as seen in Figure 4-8 of Chapter 4, “The PID Process Control Algorithm,” will produce erroneous frequency determinations that DSP may not be able to overcome.
For relatively slowly oscillating signals, the FreqMeasure program can be used as demonstrated with the 0.7 to 13 Hz square-wave example created by the circuitry of Figure 6-1. When a signal of 0.64 Hz was measured with the FreqMeasure program, approximately 48 seconds elapsed between data points appearing on the serial monitor.
An Arduino microprocessor has a 16 MHz clock and is thus able to read signals with the FreqCount program into the MHz range capability of the FG500.
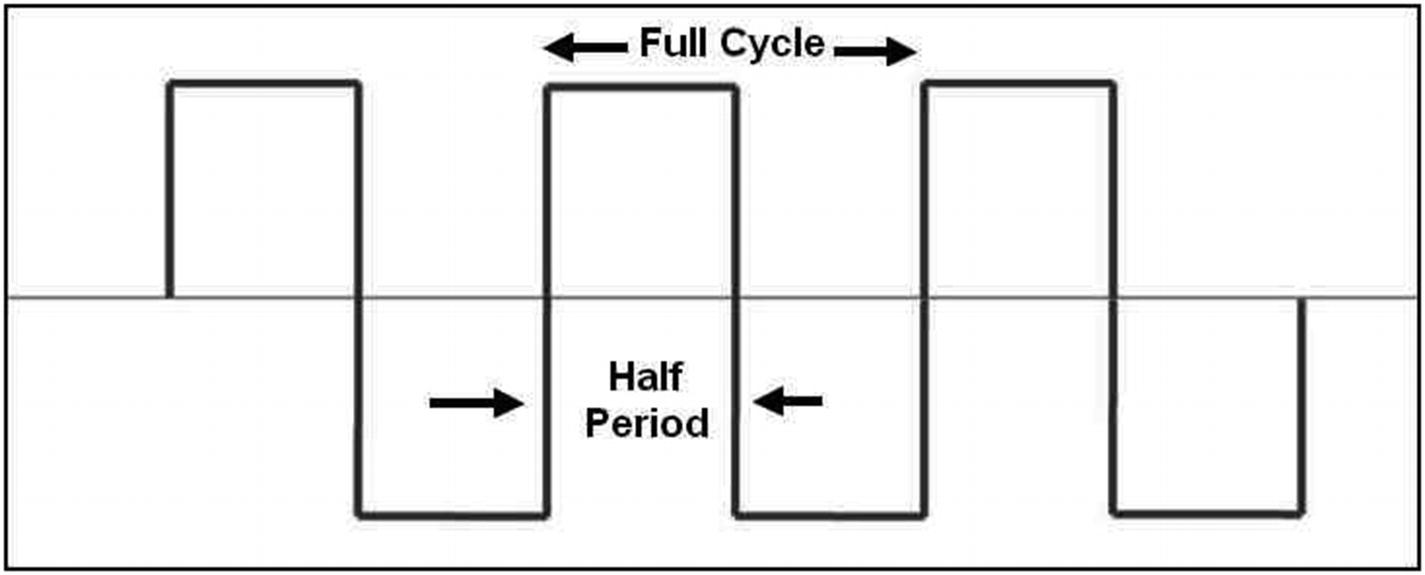
A square waveform and frequency-measurement parameters
A semi-quantitative graphical data recording was implemented with a DAQFactory plotter, the FreqMeasure program, and the FG500 signal generator. Figure 6-5 is the plotter response recorded when the FG500 coarse selector was set to the 100 scale and the fine adjust dial was set to the nominal degrees rotation caption on each step increment. By using the stepped increment the plotting illustrates the system’s ability to quantitatively follow changes in the signal frequency. The virtually vertical traces between increments of the frequency change were validated by the apparent simultaneous movement of the display trace with the rotation of the fine adjust dial.
Summary
Frequency is defined as the number of occurrences of a repeating event per unit of time.
Electronic frequencies are often measured in terms of cycles per second, while natural and biological events are often expressed as units of time per event.
Software libraries, filters, commercial signal generators, and low-cost experimenter-assembled signal sources are reviewed.
In Chapter 7, the often overlooked inherent errors in experimental data and the importance of reproducibility are explored.