
1 Aging Power Delivery Infrastructures
1.1 INTRODUCTION AND OVERVIEW
This chapter provides an overview of aging power delivery infrastructures, their characteristics, the issues they create, the challenges they present, and the methods and processes utilities and the power industry will use to meet those challenges. It is divided into nine sections that cover different aspects of aging power infrastructures, all from a high-level, big picture perspective. The rest of this book fills in the details. This Introduction and Chapter 17 - Guidelines and Recommendations, taken together constitute an executive summary.
Gradually Growing Older
America’s electric utility systems are growing older. In many systems, significant portions of the equipment and facilities in service date from the economic boom following WWII, or from the sustained growth period of the 1950s and 1960s that many American cities and towns experienced. A lot of equipment installed then, and still in service today, is between 50 and almost 70 years old.
As electrical equipment gets older, it deteriorates from the wear and tear of service. At some point, it wears out. Then, it may fail outright, or more often, succumb to forces it would have withstood when new but no longer can - the high winds of a storm or the rare electrical spike caused by switching or lightning. Such failures cause interruptions in service to the utility’s customers, and require expensive emergency repairs and system restoration work. Monies will have to be found to pay for that work and the cost of replacement equipment.
All equipment eventually reaches an age where deterioration and increase in failure rate is significant. This is the first fundamental truth of aging power infrastructures. Electric utility equipment is designed and built to be incredibly robust, but eventually time wins: sooner, but usually later, everything fails. A second fundamental truth for most utilities is that it is no longer sooner and that it will soon be later: large portions of old equipment are approaching an age when they are not going to provide dependable service without considerable attention.
A portion of the equipment installed fifty to sixty years ago has already failed in the decades since. Storms, floods and other natural disasters took their toll. Accidents, such as a power pole being hit by a car or an underground cable being dug up by a construction crew, happened. Sometimes equipment just failed for no obvious reason. Regardless, all that equipment was replaced when it failed. As a result, even in the oldest areas of a system, there is a mix of old and new.
But the old predominates. Even in areas built immediately after WWII, rarely has more than 25% of the equipment been replaced in the intervening decades. Well over 70%, and often more than 85%, of the equipment is original in spite of being more than five decades old. That creates a practical operating problem for a utility. Some of the equipment is new. The biggest portion, although having spent decades in service, is still good enough to provide satisfactory service for a decade or more to come. But a tiny fraction of the old is badly deteriorated, perhaps not to the extent that it shows visible signs of imminent failure, but to the extent that it cannot do its original job dependably. Those failures will poison the performance of the system overall.
It might seem that this problem is easy to solve. Just have the utility find and replace all the equipment that is going to fail in the next few years, and do that on a continuing basis. Realistically, that is not easy to do. First, the level of failure considered “bad” is remarkably low. Power systems depend on long chains of transmission lines, substations, transformers, breakers, feeder circuits, reclosers, sectionalizers, fuses, cutouts, service transformers and service drops. All must function well if the utility is to deliver reliable power to its customers. If anything fails in this chain, some utility customers go without power until service can be restored.
Thus, an equipment failure rate of only half a percent per year would be disastrous. It would mean service interruption rates that are completely unacceptable to customers, regulators, and stockholders alike, and emergency field work rates that exceed the utility’s ability to dispatch crews to do the work. Under normal circumstances, less than two tenths of one percent of equipment in good condition fails in a year. Thus, finding the future “bad actors” in a power system is a challenge – the proverbial needle in the haystack. A utility might have 8,000 steel lattice transmission towers in service, and it will be a very bad year indeed if more than four give serious problems.
Finding that flawed equipment is not easy. In many cases, badly deteriorated equipment does not give obvious signs of its undependability. Tests can be done to improve the knowledge the utility has of equipment condition. But those require skilled personnel, always in short supply, and expensive specialized equipment. And many tests are intrusive to customers: utility technicians have to go into backyards and factory property to set up and run their tests. In downtown areas they must cordon off lanes of major streets while they work in equipment vaults under the pavement.
Furthermore, test results are not entirely dependable. A test that is 95% accurate may sound as if it is a good test – and it may be the best available – but its unrestricted use creates problems. Suppose a utility has 10,000 older wood distribution poles, of which 500 (1/2 percent) are truly so deteriorated as to probably fail in the next decade. A 95% accurate test will find 475 of those, leaving 25 bad poles in the field. That alone is a concern, but not the major worry from this test. The real concern is that if it has a 5% false positive rate, too, then it will identify 475 of the 9,500 good poles as bad, for a total of 950 poles it indicates should be replaced. If the utility follows those test results it will replace twice as many poles as necessary – and incur twice the cost. The test may be the best that can be done in the circumstances, but it is not the type of clean, effective solution that inspires confidence among all stakeholders.
Furthermore, replacement of equipment already in place is very costly. Of course, there was a significant cost associated with the original installation – what is often called “greenfield” site work. Money was required to buy a pole or transformer or cable, and skilled labor was needed in every aspect from design to construction. But the cost of replacing that equipment many years later is much greater. First, before the new equipment can be installed the old equipment has to be removed and recycled, etc. Then new equipment has to be put back into place and reconnected to the rest of the system. Further, typically this work must be done while the rest of the system is in operation – i.e., energized – so that service to customers is not interrupted. That means the utility’s personnel must work in and around live electric equipment. Such work can be done safely, but will proceed much slower and cost more than the de-energized site labor that was used in the original installation. As a rough rule of thumb, replacement work is two to three times as expensive as an initial greenfield installation.
Thus, replacement of even a small portion of an aged system can be a formidable financial burden to a utility. Going back to the 10,000 wood poles discussed above, the utility would follow up its test results by replacing nearly 1000 poles in order to obtain a failure rate over the next decade only slightly above that for all-new equipment. That may sound like a good bargain. But those replacements will each cost about three times as much as new poles cost when originally installed, and again, it is replacing more than two poles for every failure it will avoid, even though the test procedure is 95% accurate. And those tests, themselves, have a noticeable cost, as does the effort to correlate test results and manage the pro-active replacement in and around all the other activity the utility has keeping the lights on 8,760 hours a year. Altogether, the utility will spend roughly 5% of the cost of the original construction of the entire line for these 10,000 poles (adjusted for inflation, etc.) in order to keep failures and their consequences under control for another decade: or about half a percent per year.
To put that half a percent capital expenditure in perspective, consider that a typical utility might add about 1% new equipment each year for system expansion – as its customer base and energy sales grow. Traditionally, the rates that it charges its customers, the budgets it puts together and manages to each year, the number and types of field crews and materials and equipment supply infrastructure it has, and its management bandwidth, too, are all geared to that level of capital spending and construction. This additional half a percent cost to pro-actively handle aging equipment is a 50% increase above that traditional rate of capital spending on system equipment “additions.” To a company that may have only a single-digit profit margin, that finds it difficult to hire skilled field personnel and managers, this can appear to be an untenable challenge.
Against this, however, is the undeniable fact that O&M costs for repairs, restorations, and replacement for failures are and will continue to rise in the foreseeable future as the system continues to age, and that if the utility manages pro-active programs well, they will ultimately reduce cost as compared to that. The utility has no choice but to adapt with new testing, tracking, evaluation, analysis, planning, and management approaches to control its infrastructure aging.
In any practical sense this issue of aging infrastructures is new to the utility industry. During the last half of the 20th century, electric utilities in North America, Europe and in many other places around the globe developed and institutionalized incredibly efficient methods and processes to run a utility system while providing high levels of reliability (§ 99.98%), all at costs that regulators accepted as being as low as practically possible. Then, equipment that today is 60 years old and beginning to give problems was only 20 to 40 years old and still quite robust.
Since the problem of aging infrastructures was not a priority then, utilities and the power industry did not set themselves up to address it. Nor was it a focus for equipment manufacturers and service providers that support utilities: they go where the market leads them. Even only twenty years ago – half a career ago for senior managers and the most experienced engineers and operators at a utility – this problem did not exist in any measure serious enough to make it a priority. The challenge the industry now faces is to change this situation in time to effectively control aging and its impacts before the problems they cause become serious.
1.2 AGING INFRASTRUCTURE MANAGEMENT MUST BECOME A MAINSTREAM PART OF UTILITY OPERATIONS
In most cases it makes no sense to replace a system that was originally installed seventy years ago in a wholesale fashion. Even among the oldest equipment a majority may still be in serviceable condition and capable of providing many more years of good service. A utility’s best course is to do what it can to find the bad actors and the questionable equipment and replace only that, continuing into the future each year with a system that is old but in which its condition is being managed to a level optimized to balance service reliability and cost. The system will be old, but condition will be “good enough.”
Among other things, this means aging infrastructures are here to stay. Any utility’s system will age, until it at some point it has become “old,” a term the authors will define here as meaning the system has a sufficient portion of equipment deteriorated badly enough to cause the utility concerns about failures, breakdowns, reliability, and cost. Once a utility starts managing the condition of that aging infrastructure well, it will replace or refurbish deteriorated equipment that is in unsatisfactory condition, but retain all the old equipment that is still in satisfactory condition. The system will continue to include a lot of old equipment, and that older equipment will always have the potential to go bad in the future. Further, that equipment kept in service will continue to age. The aging infrastructure condition management program will not necessarily reverse aging, just control condition to some (hopefully optimum economic) point. The system will not be new, but neither will it be badly deteriorated.
To do that the utility will need some combination of on-going testing, tracking, mitigation of continued deterioration, and pro-active replacement and refurbishment of deteriorated equipment, will be needed on a continuing basis into the future. Such programs will control equipment condition to an “optimum” level, a stable, sustainable point at which equipment in service continues to age, deteriorated equipment is replaced, and the utility continues to test, maintain, and service and replace equipment sparingly but in a targeted manner, with overall cost kept at a minimum.
Utilities that today have no processes and budgets in place to do this type of condition management will have develop those capabilities. Those new processes will be folded into the traditional planning and construction and O&M management processes and functions that the utility has had for decades. And condition management will be mainstream utility practice: It is likely that by 2035, a significant portion of electric utilities in North America, perhaps as many as 40%, will be spending slightly more capital each year on replacing aged and deteriorated equipment than on system expansion due to load growth.
1.3 WHAT IS THE INFRASTRUCTURE INVOLVED?
Even a power system serving only a few thousand customers is made up of tens of thousands of individual components – poles, ducts, underground vaults, substations, transformers, circuit breakers, voltage regulators, monitoring and control systems, service transformers, meters, transmission towers, and electrical conductors (wires). To many people this all-inclusive set of equipment is the infrastructure. But the comprehensive view that leads to the best solution to aging and the problems it causes says there is more. The methods of operation of the system are a big part of how the power system performs. For example, three cornerstones of utility operation are:
1) Loading specifications – the guidelines the utility sets on the amount of electrical or mechanical load permitted on a unit – influence how much wear and tear it experiences, how much burden it is expected to carry, and how much its failure affects service reliability.
2) System operating guidelines – the procedures and priorities for operating the system have a lot to do with how failures affect cost, customer service, public safety, and the utility’s business performance.
3) Inspection, service and maintenance guidelines. Every utility has such guidelines in place along with processes that apply them.
Some if not all these guidelines, and the institutionalized habits built around them, are themselves quite old – “deteriorated” as compared to modern needs. Revision of loading and operating guidelines can reduce stress on older equipment and thus decrease the potential for failures. Modification of O&M rules and guidelines for equipment inspection and service can help find deterioration before it causes problems. There are ways to prepare and organize for contingencies so as to minimize customer inconvenience and utility cost, even when unexpected failures cannot be avoided. And, given that a utility will have to perform equipment testing, track condition, and perform pro-active refurbishment and replacement as part of a continuing condition management program, those activities should be merged with traditional maintenance and operating activities and all of it managed in the most efficient manner possible. Finally, the design and technology of the utility’s control systems is part of the infrastructure. Different control schemes can mitigate some of the reliability and cost effects of failures due to aging. New technologies can be retrofitted to detect insipient failure, to respond automatically to failure, or to further reduce reliability and cost impacts.
In many cases, these changes to specifications, to operating guidelines and procedures and to system configuration and design are more cost effective at reducing reliability problems and utility costs than efforts aimed directly at refurbishing or replacing equipment. In many more cases – a majority perhaps – they can affect the efficiency and quality of results from equipment testing, lifetime extension, and replacement programs. They, too, are a vital part of the “infrastructure” that should be managed. Thus:
An aging infrastructure includes all the power system’s equipment and facilities along with all processes, methods and guidelines and control systems used to design, operate, maintain, repair, and restore service and manage resources and system performance.
1.4 CHARACTERISTICS OF AN AGING INFRASTRUCTURE
Situations vary, but most aging infrastructure problem areas have most of the same characteristics, which are:
• The area was originally developed, or last experienced a rebuilding boom, prior to the 1970s. Most of the existing system structure (substation sites, rights of way) dates from before that time.
• The majority of equipment in the area is more than forty years old.
• The system is well engineered and planned, in the sense that a good deal of concern and attention has been devoted to it. It fully meets the utility’s minimum engineering criteria.
• The area is seeing steady but perhaps slow growth in load. It may be undergoing, or about to undergo a rebuilding boom.
• The area is plagued by above-average equipment failure rates. Overtime labor may be high due to large amounts of unscheduled repair and restoration.
• SAIFI degradation leads SAIDI degradation by a few years. Typically, frequency of interruption begins rising from five to eight years prior to big increases in SAIDI.
• When a major “event” such as a widespread interruption of service occurs, it is sometimes due to a series of events that are quite unusual or even characterized as a bizarre combination of events.
• Things go bad a lot.
The next to last bullet above deserves special attention. In a badly deteriorated system, breakdowns and minor problems as well as outright failures have all increased in frequency compared to a system in satisfactory condition. This in itself leads to many operating problems. But it also means that the incidence of simultaneous problems increases drastically: double the chance that any particular relay in a system may not operate as expected, and the likelihood that two relays will not operate together when they should quadruples.
In a badly deteriorated system, events begin occurring more frequently due to combinations of breakdowns and failures in which the existing deteriorated condition of surrounding equipment or systems affected the consequences of or contributed to a failure and outage, often in bizarre combinations and ways that were never anticipated and will, at first glance, be dismissed as “once in a lifetime” occurrences that “could never happen again.” Utility executives and managers need to realize that such statements are specifically true but not true overall: that particular bizarre combination will very likely never happen again. But other equally un-anticipatable and bizarre events will occur, and more frequently as the system continues in a downward spiral of condition deterioration. This pattern is a sure sign of an aged and badly deteriorating infrastructure.
1.5 POWER DELIVERY SYSTEMS
The authors have deliberately used the term “Power Delivery” rather than “T&D” throughout this book in order to make a point that is both crucial to success in dealing with aging infrastructures, but very often overlooked. The infrastructure involved in the issues being discussed here includes a good deal of the T&D system, but not all of it. In order to understand the problem, and appreciate how to solve it effectively at the lowest possible cost, a person must appreciate that both problems and solutions must be examined from the standpoint of what does the equipment involved do?
Modern power T&D systems can be divided into two parts, or levels, based on the function of that part of the power system under a de-regulated structure. In terms of the new de-regulated industry paradigm these are most easily distinguished as the wholesale level and the retail level. The point of this section, and the focus of this entire book, is that the problems of aging infrastructure, as they impact reliability of customer service, are almost exclusively limited to the retail level.
This is not to say that the wholesale power transmission level is unimportant. It is absolutely critical, and problems at that level can cause customer service interruptions. What is most important at that level, however, is system security, the continued ability of the system to remain “up and running.” That is slightly different than reliability, and handled well by FERC (Federal Energy Regulatory Commission) and NERC (North American Electric Reliability Corporation) requirements. Programs and methods needed to comply with these requirements are composed of the same testing, tracking monitoring, evaluation analysis, and planning techniques covered in this book. However, the priorities and focus are generated by regulatory requirements and regional grid considerations. Those aspects are not dealt with here.
The authors recognize that the consumer does not care about whether his lights are out because the wholesale grid cannot supply all the power needed regionally, or because a part of the local power delivery chain has failed – he is without electric power. But this book is about understanding and fixing the problems caused by aging power delivery infrastructures and eradicating the customer service quality, operating and business problems they cause to the local delivery utility. In that context, the distinction between wholesale and retail matters a great deal. The record shows that the vast majority of customer service quality issues seen throughout the industry are created at the local delivery, or retail, level and that the solution to those problems lies there as well. Problems at the wholesale level are generation shortages and transmission congestion. These are very serious in their own way, but an entirely different set of concerns, and are not addressed here.
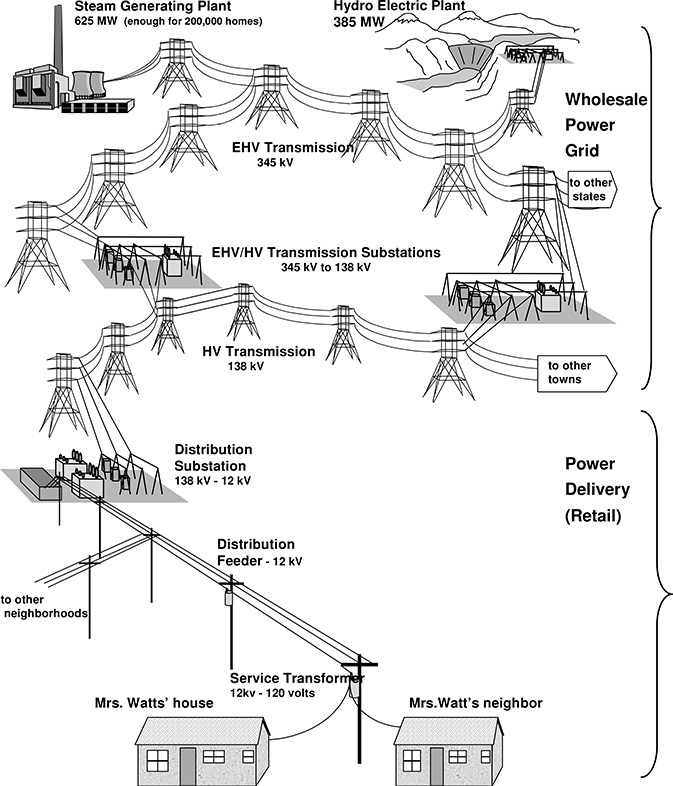
Figure 1.1 The electric power industry, including generation (now de-regulated), the high-voltage transmission network (open-access), and power delivery, which consists of sub-transmission, substations, feeders and laterals, and the utilization voltage system leading to all customers.
Table 1.1 Seven Characteristics of Distribution (Power Delivery) Systems as Opposed to Wholesale Transmission (FERC)
|
Delivering Power to Mrs. Watts
Figure 1.1 shows a typical power system from the generation plants to the home of a customer, Mrs. Watts. The power Mrs. Watts uses to heat her home this week came through the wholesale grid from any number of power generation plants and not always from the same ones. But it flows into the same local distribution system all the time. And except during emergencies or contingencies, always takes the same path to her home. This “power delivery system” is owned and operated by the local utility company.
Power Delivery: Getting Power to People
In contrast to the wholesale level, the retail, or power delivery, level exists solely to route power to consumers. Table 1.1 lists criteria that FERC (Federal Energy Regulatory Commission) established to identify the local delivery level. Most important to this discussion is a point mentioned earlier: a particular consumer’s power always flows through the same part of the delivery system, except on those rare occasions when there is a contingency. The power that Mrs. Watts uses each day is intended to always come through the same set of service drops, through the same service transformer, lateral branch, feeder trunk, substation switchgear, substation transformer, high-side switchgear, and substation transmission-level feed line. Only during an equipment failure will an alternate route be used for some part of this supply chain.
Power delivery infrastructures are those portions of the power system whose purpose is solely to deliver power to energy consumers, and do not include those elements associated with the wholesale electric power grid.
Power delivery includes more than just local distribution, although it certainly includes that. It also includes a portion of the transmission-level system in what was traditionally called the “sub-transmission lines – those lines that deliver power to distribution substations. Figure 1.1 indicated the portion of the power system identified as the power delivery system. This is normally the transmission that despite its voltage level, falls under FERC’s distinction of distribution function, as opposed to wholesale transmission (Table 1.1).
1.6 THE BUSINESS ENVIRONMENT HAS CHANGED
If the changes above were not enough, the technical, social and political environment in which utilities must function has changed dramatically in the last thirty years. In the 1970s electronic calculators were still in their infancy; digital computers were large mainframes with far less computing power than today’s average laptop computer, and not yet widely deployed, and automated monitoring and system communications for power systems was used only in major generating plants. Similarly, at home most consumers did not have any appliances or other products that relied heavily on electronics other than perhaps their radio, television or stereo system – all analog devices.
The transistor had been invented in 1947. Discrete component technology found its way into consumer products in the 1960s with the introduction of the “Transistor Radio.” However, the proliferation of electronics in consumer mass-market products did not begin to occur on a large scale until the development of the integrated circuit. Intel introduced the 8008™ microprocessor in 1972. The capability to support computational complexity and the sensitivity of products to disturbances on the electric power supply system have been increasing at accelerating rates ever since. Today one can find integrated circuit technology throughout the home. Televisions, clock radios, home video game systems, desk top computers, programmable microwaves, programmable ovens, programmable dish washing machines, programmable VCRs and an increasing number of other appliances incorporating programmable controllers are becoming commonplace.
Office technology has seen a similar evolution to greater complexity and sensitivity. Mechanical adding machines and calculators were replaced first with electronic calculators and more recently desktop computers. Mechanical typewriters were replaced with electric models, then the stand-alone word processor. Now word processing programs run on the same desktop computers used for accounting, spreadsheet analysis and computationally intensive engineering calculations or graphic design. Many businesses own or lease their own telephone switching systems, another application of microprocessor technology.
Likewise, production and manufacturing facilities have evolved. Manual control of machinery gave way to analog controls. Analog controls have given way to numerical control, first to punched tape, then to process control computers. Electronics have made possible variable-speed AC motor drives. Efforts to increase productivity and efficiency in the factory have introduced many of the same systems used in the modern office and factory, such as desktop computers and customer-owned telephone systems. Additionally, the internal power distribution systems of the plants have become more demanding as they provided faster protection of valuable equipment. Today’s microprocessor controlled relays, motor control systems, and recording and monitoring systems are much more sensitive than the electromechanical relays, analog instrumentation and motor control centers of 50 years ago.
While the microprocessor revolution was taking place in homes, offices and factories, little was changing in the construction of the power delivery system. Granted, solid-state relays were developed and deployed, improving the security of the bulk power system. The computer revolution also improved the ability of the utility engineer to model and analyze the operation of the power delivery system further optimizing technical aspects of system design in accord with the planning and design parameters developed in the 50s and 60s. Advances in measurement technology based on the microprocessor also allowed technicians to monitor the operation of the system in near real time. Digital event recorders capture the transient operation of the system for later analysis. With the right instruments and communication channels, one can monitor various attributes of electric service for many points on the power delivery system.
However, the system itself has not changed in any significant way. Although there have been improvements in the quality of the material and equipment, the system itself remains essentially the same. The power delivery system is composed of poles, wires, insulated cables, switches, fuses and transformers. It is subject to damage inflicted by man and nature in addition to the random and rather infrequent failure of the components. Finally, the way in which the system reacts when subjected to a tree limb falling on an overhead wire or a back hoe digging into a cable is the same today as it was 50 years ago. A fuse or a breaker or other protective device opens to isolate the damaged segment of the system. In the time required for protective equipment to operate, high fault currents flow, depressing the voltage for customers and customers on other circuits served from the same source until the protective device operates. In many systems, fast acting reclosers or circuit breaker relay schemes open and reclose before the protective device can operate in an attempt to clear temporary faults, subjecting all customers on the affected circuit to a series of momentary interruptions.
The end result of the mismatch between the sensitivity of the equipment used by customers and the operation of the delivery system has been a steady decline of the customer’s perception of system performance. Residential customers may arrive home and find all of the electronic clocks blinking or with the words “power failure” showing on the display. The initiating event may have been a momentary interruption due to a tree branch brushing against an overhead conductor, or just a voltage sag due to a short circuit on another circuit out of the same substation. Fifty years ago with electric clocks driven by small motors, the event would have gone unnoticed by anyone not at home – at most they would have noticed was a blink or a momentary dimming of the lights.
The situation was similar in the industrial and commercial sectors. In the 1980s it was not unusual to encounter problems associated with the application of new technology that were internal to the facility but nonetheless blamed on the utility. In one instance a manufacturer had installed microprocessor-controlled robots on an arc-welding line. The controls were supplied from the same circuit in the plant that supplied the welding equipment. It was relatively easy to demonstrate that the controls worked fine when the welders did not strike an arc but caused control problems when they did. In another instance a plastics injection molding plant replaced all of the electromechanical voltage and current protection devices with new solid state devices. Because he was able to do so, the plant electrician had set them at maximum sensitivity and zero time delay. The end result was that they would trip the supply to the compressor motors any time there was a switching operation on the supply line, despite being only several hundred yards from the substation. The problem was resolved by reducing the sensitivity of the protective devices to the same level of those they replaced.
But most of today’s power quality problems are not as easy to solve. Sensitive plant control equipment may be built into the system that it is controlling, and some equipment cannot tolerate even a momentary power interruption. Sensitivity of equipment throughout a plant may be such that even routine voltage sags are intolerable. A single momentary or voltage sag may cause the loss of hundreds of thousands of dollars. Solutions to these problems have been available at utilization voltages for some time. There are un-interruptible power supplies (UPS), motor generator sets and constant voltage transformers to name just a few. Yet, it may be that there is not enough space available for the manufacturer to install the necessary mitigation equipment. Installation of low voltage mitigation equipment at multiple locations throughout the plant may not be cost effective.
It is in this context that the aging power delivery infrastructure must be viewed. Not only does system performance suffer as equipment condition deteriorates, but today’s customers have become much less tolerant of any disturbance in their power system. The potentially poorer service quality in combination with rising customer expectations has put the power delivery companies in the spotlight.
1.7 FIVE FACTORS CONTRIBUTE TO AGING INFRASTRUCTURE PROBLEMS
Throughout the United States, and in many other places around the world, portions of electric utility systems have become aged: in the sense as described above. The average age of equipment in the region or area of the system exceeds the design lifetime for electrical equipment. Figure 1.2 shows the distribution of average ages of substation power transformers throughout the power industry, estimated by the authors. The mean age is about 40 years, meaning that the average transformer is roughly ¾ of the way through its normal lifetime. The figure indicates that more than a few transformers have been in service over 60 years.
The fact that a transformer, circuit breaker, or other piece of electrical equipment is old does not mean that can no longer do its job. Old equipment will often still function, and although not as efficiently as modern units, nonetheless get the job done. But what age does mean is that the unit is much more likely to fail in the next year, as compared to a new unit of similar size and design. As a result, a system composed of old equipment has a much higher incidence of equipment failures. Equipment failures often lead to interruptions of service to customers, and that means the system provides relatively poor service – at least poor service as compared to a system that is composed of newer equipment.
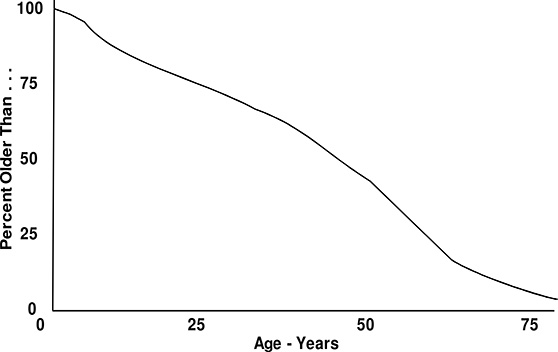
Figure 1.2 Estimated percent of distribution substation transformers over a certain age in the US. Roughly half are probably over 40 years in service.
Table 1.2 Five Contributing Factors to Aging Infrastructure Problems
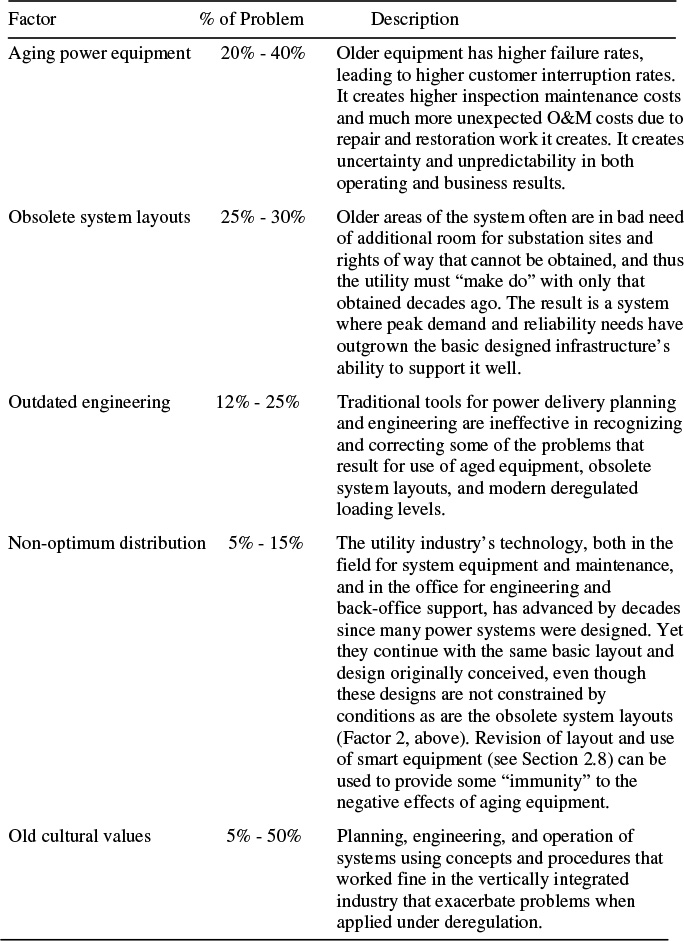
This perspective provides the easiest way to define and identify an aging power delivery infrastructure – simply look at the age of its equipment. But that provides only a partial view of the problem, and given that condition management seeks to keep old equipment but old good old equipment, a view incompatible with the condition management approach. What this perspective that age is the key factor misses is that four other factors common to older parts of the utility infrastructure heavily interact with equipment age to exacerbate its effects and contribute to the overall problems of poor customer reliability and high operating costs. Table 1.2 summarizes these five interrelated, contributing factors, which are all at work in an aging power delivery infrastructure. Together, they work against efficient, reliable operation of the older power system. These are discussed in more detail below, and in much greater detail elsewhere in this book.
Contributing Factor 1: Aging Equipment
As cited above, old equipment is a serious contributing factor to poor reliability and high costs in many utility systems. In fact, there is usually some area in any electric distribution utility’s system where old equipment is a worrisome factor in providing good customer service quality.
All power system equipment will eventually fail. At some point, after a period of service, something will wear out or deteriorate to the point that it no longer adequately performs its role. The equipment will cease to provide electrical power delivery to those customers downstream of it. The nature of electrical equipment is that very often failures lead to a fault, requiring protective equipment action that isolates a larger portion of the system than just the customers served by that failed unit.
Regardless, electrical equipment does not have a uniform probability of failure with age. Usually electrical equipment fails only after many years of completely satisfactory service. Thus, old equipment is much more likely to fail than new equipment (roughly three to ten times as likely). As a result, a system or area of a system composed of old equipment will have a much higher failure rate than one composed of new equipment. This has three consequences, all of which are undesirable:
1a. Equipment failure causes lower customer service quality. Customers are more likely to have interruptions of their electrical service due to the unexpected failures of this older equipment. The frequency of interruption rises – SAIFI increases.1
1b. Higher repair and restoration efforts. More failures mean more and more unpredicted events requiring emergency or contingency mitigation efforts. The impact of this on all but the most efficiently managed and staffed organizations is to increase duration of equipment outages (and hence customer interruptions). There are more numerous outages to repair, taxing the restoration and repair resources to the limit and often requiring repair of one to wait on another. SAIDI increases slightly as a result.
1 SAIFI, System Average Interruption Frequency Index, the average number of interruptions of service experienced annually per customer. For a discussion of this and other reliability-related indices, see Chapter 4.
Also quite important for the utility’s bottom line, these higher repair and restoration needs increase overall costs.
1c. More inspection and testing efforts required. Equipment more prone to fail often benefits from more frequent and comprehensive inspection and testing, which in many cases can reveal developing problems before they cause failures. Catching trouble early allows what would have become unscheduled emergency repair work to be done in a more efficient, less costly scheduled manner. This reduces the utility’s costs, but the inspection and testing increases required increased costs. Compared to newer systems, costs are higher.
Chapters 6 and 7 will focus on various aspects of equipment aging, its management, and the mitigation of its effects in more detail. Usually, a utility cannot afford to replace all of its aging equipment. As a result, the solution to this particular problem source is a combination of partial measures that seek only to reduce failure rate slightly and control its effects:
a) Careful assessment and tracking of condition,
b) Good utilization of capacity and expected reliability of equipment,
c) Artful management of restoration and replacement policies,
d) Design of the system for failure – planning that assumes that things will go wrong.
Chapters 10 and 11 will discuss these in more detail.
Contributing Factor 2: Obsolete System Layouts
This, not aging equipment per se, is perhaps the strongest contributor to poor reliability in a sizeable portion of aging infrastructure cases. This is often not recognized or identified as an aging issue, but the facts speak for themselves.
Usually, the design of the power system in an area of a power system, its layout of substations and rights of way and the configuration of how they are interconnected and supported by one another during contingencies, dates from the time the equipment now in service was installed, or before. For example: the central part of the power system in many urban areas of the U.S. The “downtown power system” in most large cities is based on substation sites and rights of way that were laid out in the 1940s through the 1960s, when the post WWII boom created a period of sustained economic growth. These designs were executed with great skill to meet both the needs of the moment and reasonable amounts of load growth two or more decades into the future.
But between four and six (not just two) decades have passed since these systems were first laid out and built. In many urban areas throughout the United States, the electric demand has doubled or tripled since the power system last had a major revision in layout. By default, these systems had their layout “locked in:” As the city continued to grow, the utility found it increasingly difficult to obtain new substation sites or rights of way in the crowded, growing downtown area. Both economic and political pressures stood in the way of expanding its existing sites or adding new ones. Adding capacity at existing sites instead accommodated load growth. The utility often had to compromise preferred configuration (switchgear type and interconnection) and/or maintainability (quick accessibility) in order to squeeze every last MVA of capacity possible into crowded spaces.
At some point, equipment additions and renewals notwithstanding, the power system reached the limits of the existing sites and rights of way. Every bit of room had been used, every innovative trick within design standards had been exercised, and there was simply no more room. From thereon out, the utility either had to find some way to get the “unattainable” addition sites, or face the only other choice left: load the existing equipment in its sites and rights of way to higher levels than it would prefer.
In many cases, the rather extreme situations lead the utilities to overcome significant economic and political pressures and obtain some additional sites or space. But in all cases, the major manner of accommodation of load growth was by simply allowing loading on existing equipment to rise above traditional limits. A certain amount of this increase is by design, and does not necessarily have a negative impact. Since the mid 1980s, equipment utilization ratios (the ratio of peak loading to equipment capability) has risen through the power industry as electric distribution utilities sought to increase efficiency of equipment usage and cut back on expenses. It was not uncommon to see an electric distribution utility raise its target utilization ratio for transformers from 66%, about typical for the mid-1970s, to 70 – 83% during the last 15 years of the 20th century. This increase was by design. But the increases in loading forced on aging systems due to a combination of obsolete system layouts and other factors (to be discussed below) went far beyond these limits. In the central core of many cities in the U.S., power delivery equipment such as sub-transmission cables, substation power transformers, and primary distribution circuits are all loaded to their maximum rating at time of peak demand, leaving next to nothing for contingencies or emergencies. In a few cases, loadings at peak average close 100% throughout the downtown area and exceed that at a few places. Several of the utilities that experience serious problems during the summer of 1999 had some major delivery equipment in their central systems that was loaded to over 110% of nameplate rating during peak periods, not by accident, but by intention.
There is plenty of evidence that this trend is widespread. Figure 1.3 compares 1999 utilization ratios in the central core and the suburbs of five major metropolitan systems, all among the largest power delivery systems in the U.S. Not all urban utilities follow this pattern, but a majority seems to match this profile. This is not to say that the utility’s engineers preferred this higher loading level or that management and operators were entirely comfortable with the high loadings. But it was accepted, not as an emergency situation, but as the “normal” plan for serving peak demand.
Distribution Designs That Are Not Obsolete, But Are Not Entirely Modern
At the distribution feeder and service level there are similar issues of design and configuration that interact with aging infrastructure impacts. Traditional distribution systems are nearly all radial in operation and serial in their sectionalization. As a result individual equipment failures cause noticeable customer power interruptions, and events involving multiple failures (such as during storms or bizarre events) tend to cascade to large numbers of customers out of service.
Considerable improvement in a distribution systems SAIDI and SAIFI, even in the presence of a slowly rising tide of equipment breakdowns and failures, can be made by using a combination of smart equipment and changes in the circuit layouts and operating configuration. The margin cost of reliability for such changes to a system is often far less than a the cost of dealing directly with the aging equipment failures via a replacement program, and is often a first step in mitigating the continued effects of system and equipment deterioration.
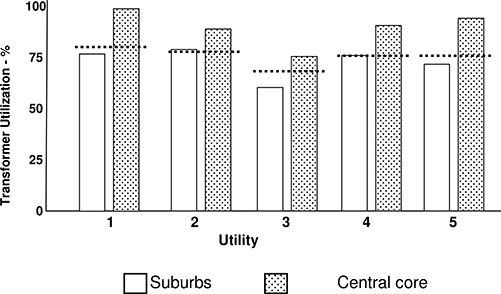
Figure 1.3 Substation transformer utilization ratios in the central core and the suburbs of five major metropolitan areas. Dotted line shows the utility’s own design guidelines.
High Loadings: A Complicated Interaction with Design
These higher loading levels were not accepted without a good deal of preparation and often only with changes to the system to keep it, at least ostensibly, within engineering criteria. In all cases the authors are aware of the utility planning and engineering departments’ applied intense engineering methods to make arrangements so that the system could, at least based on traditional analysis, tolerate equipment outages in spite of the potential reliability problems such high loadings could cause.
However, the full implications of higher loadings are difficult to evaluate fully with traditional power system engineering tools. As a result, some of the potential problems of accommodating load growth in aging system areas by using higher loading levels were not fully appreciated. (This is part of contributing cause number 3 and will be discussed later in this chapter.) While the systems in question met traditional reliability criteria, the systems failed to perform to the level the criteria were supposed to assure.
Configuration limitations
In addition, it is important to realize that the obsolete system presented the utility with challenges beyond just those caused by the higher loadings that had to result from the limited amounts of substation and rights of way space. The utility had to distribute a growing amount of power out of the same limited number of substation sites. This had detrimental effects on the performance and reliability of the primary feeder system. Beyond a certain point, a primary feeder system simply cannot be reinforced to deliver more power out of a limited number of sites, without accepting a certain amount of degradation in reliability and/or cost as a consequence of that limitation. This is due to a host of secondary, but important effects related to primary feeder configuration and performance that will be discussed in Chapters 7, 8, 11, and 12.
Symptoms of the obsolete system layout
The net result of obsolete infrastructure is that higher loading levels have three undesirable consequences:
2a. Accelerated aging. Time to failure for most electrical equipment is often to a large degree a function of its loading. The higher utilization rates forced on utilities in these areas of the system cause electrical equipment there, particularly cables and transformers, to “age” or deteriorate faster and fail sooner. Thus, in those areas where age and failure rate is already a serious concern, the obsolete system layout forces the utility to exacerbate those problems just to get by. Over time, this tends to increase the frequency of service interruptions (i.e., SAIFI goes up).
2b. Limited contingency capability. High loading levels make it very difficult to provide service to all customers when a unit has failed. To begin with, a system with high utilization has “a lot of eggs in each basket.” When a failure does occur, if service to consumers is to be maintained, a lot of load has to be re-distributed to other, still-functioning equipment nearby. But those remaining nearby units are already at high loading levels, meaning they have little available capacity to pick up additional load. The result is that interruptions, when they do occur, are difficult to restore, involving more load transfers, more emergency measures, and taking more time. While this does not increase the number of consumer interruptions to any large degree, it tends to increase the average duration of interruptions that do occur. At some point, SAIDI increases - the number of interruptions has gone up (due to age and the accelerated aging cited above) and now the length of interruptions goes up due to this reason. CAIDI (essentially their product) increases considerably.
2c. Higher delivery operating costs. The distribution systems in question operate at high loading levels. One consequence of this is the need in places for the utility to replace existing lines with a larger conductor simply to handle the MW-miles of delivery burden. Regardless, such systems typically have relatively high electrical losses. In addition, voltage drops are extreme. Tap changers and voltage regulators operate frequently, both fail more often and both require more preventive maintenance. These reasons and a host of similar secondary effects increase operating cost at the distribution level by 10%–20%.
In Table 1.2 and the discussion above, the authors have indicated that this particular cause among the four presented here typically contributes as much or more to a utility’s reliability and cost problems than any of the other three. This is because the obsolete layout interacts so much with the other aging issues. It exacerbates equipment aging. Solutions require an analysis that is very sensitive to the weaknesses of traditional engineering methods. And, on its own, the obsolete system layout creates operating and reliability challenges.
Both the problem and its solutions are complicated because they interact so strongly with both the other three causes of the aging infrastructure problem and with many other aspects of the power delivery utility’s operation. Generally, the solution is some combination of:
a) Somehow obtaining a few new sites and ROW to improve the system layout,
b) Use of innovative means of squeezing more capacity into existing sites, and most important,
c) Optimized configuration of substation switching and buswork, and primary feeder-level switching, based on sound reliability-based engineering (to be discussed below).
Chapter 8 focuses on obsolete system layout and its effects in more detail.
Contributing Cause Number 3: Old Engineering Methods
Many T&D utilities are using engineering methods that worked well in the 1970s, but cannot fully guarantee reliability operation in a world where substation and line loadings are pushing beyond traditional levels. As a result, engineering planning functions at many utilities cannot identify precisely what the problems are or prescribe the most effective and economical remedies. This particular subsection will provide a particularly comprehensive summary of this subject. Engineering tools are in an area where utilities can make immediate improvements and one where improvement must be made if the aging infrastructure issue is to be properly addressed. Chapters 9, 12, and 13 provide more detail on this subject.
N-1 criterion
Traditionally, reliability was designed into a power system by making certain that there was a “backup” of sufficient capability for every major element of the power system. If that element failed, negative consequences of that failure were covered. This is called “N–1” planning, or use of the N–1 criterion. Any one element of the power system, composed of N elements, can be removed, and the system will still perform its job, even under the most stressful (peak) conditions. Simply stated, one bought reliability with capacity
N–1 engineering is done by running N separate studies of a power system, one in which each of the N elements is removed (outaged) and the system switched as appropriate to have other equipment pick up the load it was serving. Computer programs that use a load flow algorithm (the basic power system simulator which estimates voltage, current, and loading throughout a power system for a specified set of conditions) have been written to do this automatically. The power system engineer inputs a description of the system and its loads, and the program both solves the “normal” (everything working) load flow case and all N “single contingency” (one element out) cases, and reports all with any problems such as overloads, low voltages, poor power factor, etc.
More generally, this approach is called the “N–X” criterion – a power system of N elements can be designed to tolerate the loss of any X elements. This requires NX cases to be run by the automatic analysis program.
The use of this N–1 approach is dogma throughout the power industry. Developed in the 1960s, it proved very successful: systems designed with it worked well. Every major utility developed the design of its high voltage transmission grid, sub-transmission and substation systems, and other critical elements of its system, using this method. Nearly every utility modified the method in numerous small respects to fit its needs or preferences, but overall, this approach was universally applied. The reasons were:
1) The basic concept makes tremendous sense – design the system so that if anything goes wrong, nothing bad happens as a result.
2) Experience showed that this method worked: traditional power systems designed with this approach provided good reliability.
3) There were no alternatives, at least originally.
N–1’s limitations
The N–1 approach is a sound engineering method, in fact one that the authors recommend as a part of any power system planning and engineering procedure. But like all engineering methods it makes assumptions, uses approximations, and takes short cuts to gain efficiency – in other words, it has its limits. There is no doubt (based on publications from the 1960s and 1970s) that the engineers who developed and first applied N–1 recognized these limitations. However, because the traditional applications of N–1 seldom encountered these limitations, and because institutional memories are short, many utility planners and engineers working today never considered that as conditions change, their systems might run into those limitations.
By any practical standpoint, N–1 capability is a necessary requirement for power system reliability. To be reliable, a power system must have the ability to tolerate the loss of any one element of the system and still do its job. However, that does not make it a necessary and sufficient criterion. One that, if met, assures adequate reliability of service, which is how the industry often has applied the criterion and methods based upon it: design a system to meet N–1 and it was by definition “reliable enough.” The fact that a power system meets N–1 criterion is not sufficient to assure that it will provide satisfactory reliability, or even fairly good reliability. As proof, it is only necessary to look at the system outages that occurred in summer of 1999. All of the systems that experienced severe reliability problems fully met N–1 and many cases met N-2, and even N–3 design criteria in critical places.
N–1’s “ragged edge” as a dependable planning tool revolves around its lack of probabilistic expectation in its computations. N–1 methods and the N–1 criteria assure power system planners and engineers that there is some feasible way to back up every unit in the system, should it fail. However, they make no assessment of how likely the system is to get into situations that go beyond that. N–1 methods do not provide any analysis of:
• How likely is it that backup will be needed?
• How reasonable is the feasible plan for each contingency situation?
• Is the planner is actually building a “house of cards” by expecting “too many things to go right” once one thing has gone wrong?
• How much stress might the system be under during such contingency situations, and what are the long-term implications for both equipment life and operating feasibility of the system?
• How often do conditions occur which cannot be backed up (e.g., multiple failures) and how bad could the situation become when that is the case?
As a result, systems that meet the N–1 criteria can be less reliable than needed engineers might expect, even though the N–1 criteria “guarantees” there is a way to back up every unit in the system. This is much more likely to happen in modern power systems than it was in traditional, regulated power systems, due to changes in utilization and design made in the period 1990–2000, and the more volatile operating environment of de-regulation.
The reason is that modern power systems are much “leaner” than those of thirty or forty years ago, when N–1 was first developed and applied. In the 1960s through the early 1980s, electric utilities typically loaded key equipment, such as substation power transformers and downtown sub-transmission cables, to only about 2/3 or a little more (typically about 66%) of their capacity, even during peak periods. The remaining capacity was kept as “operating reserve” or “contingency margin.” Engineers and planners at distribution utilities designed their power systems using the N–1 and other criteria, while counting on this margin. In this environment, N–1 was both necessary and sufficient to assure good reliability.
Beginning in the 1980s and increasingly throughout the 1990s, utilities pushed equipment utilization upwards to where, in some systems, the average substation transformer was loaded to 83% of its rating during peak periods. As will be discussed in Chapter 8, in aging areas of these systems, which suffered from “obsolete system layout,” utilization rates often averaged close to 100% under “normal” peak conditions.
Whenever a power delivery utility increased its planned equipment utilization rates, changes were carefully engineered into the system, so that it could fully meet the N–1 criteria everywhere, and even attain N–2 capability in critical places. This despite the greatly reduced contingency margin levels now available: there were feasible ways to back up any and all failures, despite the higher utilization rates.
However, as will be discussed in Chapter 9, this fell far short of providing traditional levels of reliability. N–1 is not sufficient to assure traditional levels of reliability, when the system is operated at high utilization rates. Basically the reasons are that such systems are much more likely to experience “high stress events” to the point that situations that go beyond the N–1 backup capability and are far more likely to occur. Such systems may have from three to five times the potential for customer service quality problems as traditional systems. Coupled with the higher failure rates caused by aging equipment, this creates a serious service quality handicap for the utility.
Other Engineering and Planning Related Problems
Power systems that operate with either an obsolete system layout and/or at high utilization rates are sensitive to more than just probability-related increases in interruption rates. The sensitivity of the system service quality to other problems increases exponentially. In particular, problems are encountered with partial failures, configuration complexity, and load forecast sensitivity, which are discussed in further detail in the following paragraphs.
Partial failures
Contingency-based methods such as N–1 are basically “zero-one” models of failure: a unit of equipment is modeled as completely in, or completely out of service. But modern power systems often encounter partial failures or operating constraints of some components:
• A transformer may be in service but its tap changer has been diagnosed as problematic and is locked in one position.
• An oil-filled UG cable’s pumps are disabled and the cable has been de-rated.
• A bus ground that failed tests has dictated opening a tiebreaker to balance fault duties.
These and other similar problems impact an area of the system with obsolete system layout or an area of the system operating at high utilization ratios, far more than they impact a traditional (66% – 70% utilization) power system. The obsolete layout is stressed with respect to voltages, flows, etc., and limitations in its full equipment usage due to such partial failures add stress and often “uses up” contingency capability. A power transformer loaded to 85% at peak, whose tap changer is locked into one position, is subject to voltage regulation problems that can easily reduce its ability to handle load by more than 15%. The contingency margin (85%-100%) that the typical N–1 method assumes is there, is in fact gone.
Configuration complexity
At high utilization levels a system needs additional switching flexibility to accommodate its need to back up equipment operating at high loading levels with other equipment that is also already operating at high loading levels. Traditional N-1engineering methods are capable of analyzing the additional complexity this additional switching adds to the system design, at least from the standpoints of both electrical flows and feasibility evaluation of contingency operation. However, configuration decisions at substations (i.e., ring-bus vs. breaker-and-a-half vs. double bus design) and feeder layout and branching/switching design (see Chapter 10) affect reliability – how likely and how often – failures or outages will lead to interruptions. When configuration becomes more complex, as it does in most cases where adequate levels of reliability are being sought when utilization rates are high, the interaction of configuration and reliability is non-trivial and not intuitively obvious. Candidate plans that look like they will provide an improvement can, in fact be less reliable overall.
N-1 methods cannot assess, nor provide good feedback to engineers on the interaction of configuration with actual customer-level reliability. For this reason they leave a gap in the engineer-planner’s understanding of the system being designed. Generally, systems laid out only with N-1 methods have configurations, which will, providing feasible contingency capability, offer far less operating flexibility than really necessary for reliable operation.
Load Forecast Sensitivity
A system that is under a good deal of stress, either because it has a system layout that is less than ideal for its load levels, or because equipment is being operated at high utilization rates, is particularly sensitive to errors in the load forecast used in its planning. Poor load forecasts used in the planning or operation of a power delivery system effectively “use up” its contingency capability [Willis and Powell, 1985]. This will be discussed in more detail in Section 9.2. Poor normalization of weather data for forecasting or poor spatial forecasting (poor correlation of loads with areas and equipment) result in deterioration of a systems contingency to withstand capability. This greatly exacerbates the reliability-of-service problems discussed up to this point in this chapter.
Contributed Cause 4: Non-Optimum Use Of The Distribution Level
Averaged over the entire power industry, the primary distribution system is without a doubt both the most important and least well-used part of the power delivery chain, for several reasons. First, it accomplishes more of the power delivery function than any other level of the system, in the sense that power is routed into a few locations in fairly large chunks. Then the distribution system routes and sub-divides that power into very small allotments delivered to many different locations. No other layer (See Figure 2.3) of the power system accomplishes so much dispersion over area or so much sub-division of power.
Secondly, the primary distribution level has more impact on customer power quality than any other layer. In the vast majority of power systems, it is both immediately downstream of the lowest voltage regulation equipment (substation voltage regulators or load-tap changers) in the system, and by the nature of its topography, the source of the majority of voltage drop from that regulation point to the customer. That topography also guarantees that the primary distribution system sees the majority of outages that lead to customer service interruptions. Thus, in most systems, the distribution system is the source of the majority of both the voltage-related and availability-related power quality problems seen by energy consumers.
Modern Capabilities Are Not Well Used
At many power distribution utilities, the primary distribution system is planned and engineered using principles and layout concepts that were developed in the 1920s and 1930s and that have been handed down through generations of planners and engineers without substantial revision or re-examination. Foremost among these long-time “habits” are the overall layout style of the primary feeder system: whether the large trunk, multi-branch of the hierarchical subdivision, often-called “feathered” template for radial feeder layout, guides that. Additional factors include switching zone and contingency backup policy, voltage regulation and “reach” design, and conductor set selection and tapering policy.
Any reasonable layout style, conductor size set, switching zone, and conductor sizing rule base, will result in a distribution system that does its basic job as interpreted from the traditional perspective: route power from substations to customers without violation of voltage, loading, or power factor standards. However, this interpretation of the distribution system’s job is obsolete, and incomplete. It looks at the distribution function only from the perspective of moving power and neglects its role in and capability for improvement of customer-service reliability.
Very few primary distribution systems are planned and engineered to make maximum use of the distribution system as a resource for customer reliability. As mentioned above, the guiding rules for primary distribution planning and design at most utilities were developed in the 1930s, and last seriously re-examined and revised in the late 1960s. Additionally, they are applied in a “cookie cutter” manner, using rules-of-thumb, informal guidelines for the larger issues of layout, switch planning (along with copious formal guidelines about the details), and rote rules for overall design. In a majority of cases, these rules are often too conservative, not allowing the full use of distribution as a resource.
“Hidden” Capability May Thus Be An Untapped Resource
As a result, distribution systems in most utilities are underutilized in two ways:
1. Economics – when viewed just from their standpoint of their traditional function moving and dispersing power – they cost more than is necessary.
2. Reliability – the potential of the primary system to maximally contribute to improved reliability is partially untapped in the vast majority of cases.
Table 1.3 gives statistics on the results of “distribution optimization” studies from nine utilities, with which the authors have recently worked. The first six cases involve only changes in configuration, etc. Cases 7 - 9 include changes to circuit configuration and layout guidelines and the use of smart equipment used in combination. These cases are representative of all the utilities the authors have worked with over the past twenty years. They are an average set, not a set picked to show particularly good results. They demonstrate both the margin of improvement that is possible by updating and modernizing primary distribution planning and design paradigms, and the variation that is seen among different utilities.
Table 1.3 lists four statistics for each system. The first, “Electrical - $,” is the reduction in overall (lifetime) cost of distribution that could be wrought with respect to the traditional primary distribution paradigm of moving power. This is the savings in new capital additions that result from improving how the distribution system is designed to do its traditional job – moving power, without the use of appropriate “smart” equipment and using smart equipment.
The second statistic, “Existing - $” shows how much the useful utilization of an existing distribution system can be improved with respect to that traditional paradigm. Existing systems encompass both the good and bad points of their past engineering and design, and those systems cannot be thrown away and re-designed based on new and improved rules. However, as shown, some improvement can be wrought in the MW/$ capability of these systems. However, improvement is only useful where needed (i.e., if one improves a 5 MVA feeder so it can carry 5.4 MVA, that is useless unless it is in an area where one needs .4 MVA more capability). These values reflect both what is possible, and what was found useful, on the respective systems.
Table 1.3 Improvements in Distribution System Cost and Performance Derived from Revision of Traditional Design Guidelines and Engineering Methods
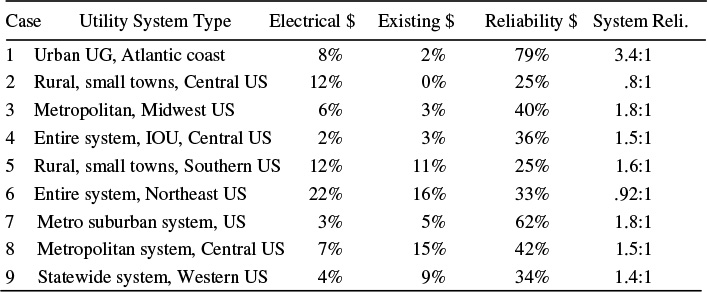
The third statistic, “Reliability - $,” represents the reduction in the cost of improving reliability that was attained by revising design guidelines and applying the most effective reliability-based planning and engineering methods to these systems. These improvements while rather dramatic, are typical. As stated earlier, distribution systems are simply not designed from a reliability standpoint. When this is done and the engineering is optimized, the result is a very considerable improvement.
The final statistic, “System Reli.,” represents the margin in “bang for the buck” that the revised distribution reliability improvement made over the existing cost of improving reliability that was in effect before the revision. This statistic goes to the heart of the use of distribution as a resource in aging infrastructure areas, and of the authors’ overall theme of using all of the power system chain optimally to obtain the greatest “bang for the buck.” In four of the six cases listed, reliability improvement was between 20% and 40% less expensive to buy at the primary level than at other levels of the system. In these cases, spending on the distribution system could deliver reliability improvement for less cost than spending on other levels of the system.
In two other cases, this was not the case, and the value shown is negative, which means that their optimum business case was to spend more money for more results, to the extent marginal cost dropped. Of note here is that the utilities were unaware of this entire issue, because the traditional tools they were using for the design of all three levels were not capable of directing engineering reliability or of even measuring such things as reliability improvement per dollar. Thus, in all cases, improvements of between 9% (1/ 92 – see final column) and 70% were possible by adopting reliability-based engineering methods and using them at the distribution system and for coordination of design among the distribution and sub-transmission-substation levels.
Table 1.3 shows that revision of distribution system guidelines and adoption of reliability-based engineering methods should be viewed as a valuable improvement in terms of the traditional (electrical) perspective on distribution. The average improvements in cost effectiveness of around 8% are noticeable and valuable.
However, from what might be termed a “modern perspective” – one that views the system’s role as one of both performing the electrical duties and providing reliability of power availability, the improvement represents a quantum leap in cost effectiveness. By looking at the distribution system as a reliability resource, and optimizing its use for that purpose, an average 40% increase in cost effectiveness of reliability improvement is obtained at the distribution level. Coordination of that with the planning and design of other levels of the system achieve a 70% increase in overall effectiveness of money spent on reliability improvement.
The authors are aware that many readers, particularly some with long experience as planners at power delivery utilities, will dispute that these improvements shown are theoretical and were not implementable (they were), or that that their system is different (not likely), or that “it won’t work here” (it will). Chapter 10 will go into more detail on these improvements.
It is rocket science
The rather significant improvement in effectiveness that is possible by revising guidelines and adopting newer engineering methods at the primary distribution level brings up a key point about why the industry clung to what are essentially outdated engineering practices for so long. Distribution planning and engineering at most utilities is kept at a rather low level.
Engineering of a distribution system so that it performs the basic electrical functions that were traditionally required of it is rather straightforward. It can be done and was done for decades with nothing more than rough calculations (slide rules at best), nomographs and tables, rote-memorized rules of thumb, and institutionalized memory informally handed down from one generation of engineers to another. When digital computers are used, that level of engineering becomes quite simple. For this reason, one often hears terms such as “it isn’t rocket science” or “distribution planning and design are quite simple.” This cultural paradigm is exacerbated by the following facts: 1) Distribution is of relatively low voltage (compared to other parts of the power system; 2) the equipment involved is rather small and inexpensive (compared to other levels) and; 3) the system is normally laid out in radial form (which makes power flow easy to calculate).
In fact, the power distribution system is by far the most difficult of all layers in the power system to plan and engineer to a truly high standard. It is rocket science, because distribution systems are like piranha. Yes, all the equipment is low voltage, all of it is small, and each unit is some type of very common, “commodity” design.
But a distribution system consists of tens or hundreds or thousands of thousands of these components. In aggregate it is large, expensive, and most importantly, very complicated. A distribution system represents a tremendous challenge in combinatorial decision-making – in deciding how to select and arrange equipment, line routes and capacity tapering, interconnection, normal and contingency flow patterns, and a myriad of other factors to best achieve the required goals.
It is possible to select and arrange this equipment based on standardized layout rules, traditional (and rather straightforward) guidelines on equipment and engineering methods, so that it works well enough from an electrical standpoint.
Beyond this, distribution systems present a number of other challenges which ultimately create a large gap between the quality of a plan that works, and that of a really good plan. First, the distribution system has to handle the vast majority (roughly 95%) of the load coincidence (diversity of peak) dynamics on the system. Secondly, distribution is closer to the consumer than any other part of the power system: it has more than its share of constraints on routing, equipment placement, and design. Third, distribution must deal with a good deal of ‘fuzziness’ in terms of the demand levels it serves. Unlike at the transmission level, accurate load measurements are few and far between. Usually loads are estimated from metered, kWh data, and assumed values of diversity.
For all of these reasons, getting the most value possible out of an existing distribution system, or from new investment about to be made in it, is more difficult than in any other level of a power systems. Distribution planning, done to the most effective manner possible, is rocket science.
Contributing Cause 5: Old Cultural Identities and Ideas
Section 1.1 stressed the changes that aging power delivery infrastructures will require of utilities, their organizations, and their personnel. Simply put, the problem did not exist to any noticeable degree in past decades, and methods to address it were not part of the utility’s operations or culture.
Old habits die hard. At some utilities, the managers, planners, engineers and operators still tend to think in terms of the culture and goals that were appropriate for a purely regulated, vertically integrated industry. New goals may have been articulated, but for various reasons a change in thinking, in priorities, and in method has not followed, one which makes the planning, engineering, and operating compatible with those new goals. The use of the out-dated engineering methods cited earlier could be characterized as part of this problem. Particularly, the considerable resistance to new ideas that prevents many utilities from fully adopting new reliability approaches (Contributed Cause 3, above) and distribution planning practices and guidelines (Contributing Cause 4, above) is mostly due to cultural resistance to a change in institutionalized values and methods. However, the authors have identified those as separate issues – methodology, rather than culture -- in order to focus attention on broader issues. In a number of cases, perhaps half of the aging infrastructure problems the authors have analyzed – retention of outmoded priorities, corporate values, and concepts -has been a contributing factor in the problems the utilities experience with aging infrastructures. This is often not a result of resisting change as much as one of recognizing when, how and where to change.
Executive management’s perspective: business-driven
Since the power industry was de-regulated in the mid 1990s, the 21st century power companies and distribution utilities that fell out of the dis-aggregation of traditional vertically integrated utilities, began taking a more “business driven” approach to their decision-making. Investments and operating policies were justified on the basis of their business case: if and how much they helped the bottom line of the business. This perspective is a huge departure from the values traditionally used at many utilities. Executives at many modern utilities drive all priorities into their organization starting from their financial model. “What will it take for us to achieve our financial goals?” Budgets and priorities are set by that requirement.
While electric utilities always recognized they were businesses, many of the values they used in decision-making were based on a “public stewardship” concept that does the right thing, regardless of cost. This attitude made sense within the traditionally regulated utility business model. Any expenditure justified within that framework could be put into the rate base. Ultimately the utility would recover its expenditures and earn a reasonable return on invested capital.
Deregulation, and shifts in attitudes within the industry and regulatory agencies, has changed that perspective. No longer are capital expenditures and operating expenses acceptable to a utility’s management just because projected revenues will cover all projected future costs. Executives insist that spending be contained for a variety of business-related reasons. Regulators are concerned about price as much as quality. The result is a system that is much more focused on the business implications of each project, not just the assurance that a project is the minimum revenue requirements solution to a given “problem,” as defined by the planning guides.
In this new paradigm, traditional values such as good customer service, high utilization of physical assets, and efficient operation are all-important priorities, because they contribute to that end. It is interesting that there seems to be more focus on these “virtues” of good utility operation under deregulation than there was under a traditionally regulated operation. Certainly utilization rates are higher, attention paid to reliability is greater than ever, and more effort is being directed at improving efficiency than ever before. The reason is that when one has less of something, more attention is given and more effort is put into getting the most out of it. Modern utilities understand that all of the virtues they desire boil down to one resource: money, and that they will never have enough to meet all possible needs based on traditional planning standards.
Additionally, in aging infrastructure areas, a power distribution utility will have nowhere near enough money to take the “obvious” approach to the aging infrastructure: replace all the old equipment and upgrade the obsolete layout. There simply is not enough money. This makes the whole planning situation budget-constrained. The overall, executive management perspective is thus,
“The power delivery system is a physical asset that we purchase and maintain to provide good customer service and stockholder profits. It is doing its job when it supports our business model.”
Changes in cultural “standards” may be needed
Many of today’s power delivery planning, engineering and operating concepts were developed by or for vertically integrated utilities in a regulated, non-competitive industry. Some are quite inappropriate for a business-driven utility environment. They use procedures that are rule- rather than results-based procedures, and thus not easily adaptable to an environment, in which decisions are ultimately driven by financial, rather than standards or policy, considerations. Required changes are scattered throughout this book, but in general, the utility needs to re-examine:
• Standards and guidelines – one utility that encountered severe problems in 1999 had not re-examined and revised its distribution planning and engineering guidelines and standards since 1978, forgetting entirely the issues of de-regulation and competition, load characteristics, capital vs. operating cost considerations, and a host of other changes in system requirements have occurred in the intervening 28 years.
• Budget base. Many utilities operate from year-to-year by revising the current year budget incrementally for the following year. Budget allocations and functions among departments are effectively institutionalized along traditional lines.
• Protection and restoration practices at many utilities follow practices developed in the late 60s and early 70s. These are often incompatible with modern consumer needs of fewer interruptions and do not make use of the most modern equipment and techniques for elimination of interruption propagation through the network whenever an outage occurs.
• Prioritization of projects is still based on models and concepts developed while utilities were regulated, vertically integrated companies. Most of these prioritization methods are entirely incapable of allocating a limited (constrained) budget among needed projects in the best possible manner [Willis, 1997, Chapter 18].
• Reliability engineering at many utilities is mostly reactive. Reliability analysts review operating records and experience in order to identify poor performing areas or equipment. Once identified, these areas are turned over to Engineering and Planning for rehabilitation, using what are basically traditional contingency-based tools.
• System design at many utilities throughout the United States still follows specific styles and guidelines developed decades ago. Nearly every utility in the industry has slightly different preferences in how it lays out and specifies equipment for substations, how it routes, sizes, and switches feeders, how it designs its protection schemes and contingency backup plans, and how it operates its system at times of high stress. Every utility insists that its methods are best. But they can’t all be correct – in fact few have it right, and all can learn by reviewing what other utilities do best.
In these cases, and a host of others, utilities can make improvements by re-examining what are often long cherished practices and unique characteristics or policies, which they firmly believed in. This fresh approach should both look at the changes in customer loads and needs since the last time practices were examined, and should make certain that the new standards, guidelines, methods and practices are maximally supportive of business-driven focus of the utility.
Inappropriate paradigms reduce the effectiveness of efforts the utility makes to improve or maintain performance, particularly in areas where reliability is relatively costly to maintain (aging areas). The impact is raised costs, which translates to increases in SAIFI or SAIDI, whichever the utility needs, because money is used inefficiently, which would otherwise go to make improvements as needed.
1.8 CONDITION, CRITICALITY, AND CONSEQUENCES
Condition is a classification, scoring, or categorization of equipment that identifies which equipment is most in need of attention based on its characteristics and features. It is determined for all information known about an item, including negative information (explicit recognition of what one does not know).
To be most useful, a condition score of categorization must be single-valued. For example, a condition evaluation system that lists a transformer as [A, D, C] on an A-F scale, where A, D, and C respectively indicate the shell and outside systems are in first class condition, the bushings test very weak, and the core is in average shape for cores of this type, will still have to be boiled down to a single valued score that can help answer a fundamental question: “Do we do something about its condition or leave it in service as is?” Besides, the utility has all the base data and information that led to each of those three categorizations. It can use them to come up with one score (D: the bushings are bad so go out and replace them and check everything else while there.).
A high level of quantatization is not necessarily an advantage in a condition score or classification and may be a hindrance. A score that ranges from 0 to 100 in units of 1 gives the impression of great accuracy, but in practice leads to no better results than a 1-10 scale or an A-B-C-D-F scale. The utility’s goal is to find equipment that is in bad condition. Frankly, a digital scale of [bad, not bad] can get a big portion of the job done.
Conditions Have Consequences
Conditions have consequences – they mean something with respect to the utility’s goals. The goal is not to develop a scoring system that puts equipment into “bins” on the basis of available data. The purpose is to find equipment that helps ferret out equipment that is counterproductive to corporate goals.
As an example, a condition scoring system based on DGA (dissolved gas analysis) data could be devised that would group the 900 power transformers a utility had into five bins of 180 each. The 15 transformers (1.7% of the total) in most need of attention are in bin F – but so are 165 other units. A three-tiered condition method that would perhaps put 850 units in class A (good to go as is, no special attention needed), 35 of them in class D (inspect very frequently so that developing problems can probably be caught in time) and 15 in class F (has a high probability of failure or breakdown or other problems).
Criticality
Condition measures should be based on the status and characteristics of the equipment itself: its DGA readings, its impulse test results, the evaluation of inspectors training in visual classification of defects, and its age, model type, and installation details. A separate measure is criticality, which recognizes that a utility might care about one potential failure or problem due to deterioration more than another of equal condition and likelihood, because it was more critical to achieving the utility’s goals.
For example, in Chapter 16’s case study, among a utility’s wood distribution poles is one that would cause 67,800 customer minutes of service interruption if it failed: among all 723,000 poles in the system it is the most critical to service, in the sense that it would create the most customer disruption and SAIDI increase if it failed. At the other end of the criticality scale are thousands of poles supporting single-phase laterals and service lines that lead to only one or a few customers and thus will have far less impact on customer service and reliability, creating perhaps fewer than 400 customer minutes of outage if they fail. Clearly, the utility wants to put more focus on tracking and controlling the condition of the most critical poles and prioritize these poles of lesser potential impact on operations to a lower level of attention.
Condition versus Criticality
Generally, a first step in the study on any particular class of equipment (e.g., medium voltage breakers) in an aging infrastructure is to classify the equipment in that class in two dimensions -- by both condition and criticality. Equipment in the top ranking (that of most concern) in both categories will get the most attention. Figure 1.2 is a matrix for the 894 medium voltage breakers in a particular power system, showing how many are in each combination of four categories of condition and four categories of criticality.
Fuzzy Evaluations and Staged Prioritization
A reality of aging infrastructure management is that nearly everything that must be analyzed and evaluated in development of a condition estimate is “fuzzy.” Data and models might provide good results and significant statistical fits when applied to an entire class of equipment (e.g., 900 breakers over twenty years of operation, all 723,000 poles in the system). But the data and evaluations for any one breaker’s condition or one pole’s level of deterioration and losses of strength are subject to a good deal of uncertainty. Experience has led the authors to strongly favor aging-asset management approaches that acknowledge the uncertainty and that cannot be practically reduced beyond a certain amount. Such approaches are therefore designed to deal with it efficiently.
From a practical standpoint the uncertainty or fuzziness means that the units assigned to each box in Figure 1.4 have some likelihood of belonging in a nearby box instead, particularly as regards the vertical (condition evaluation) ranking. There is little doubt that the three units in the upper right most box are in need of very focused attention: anything scoring that high in the initial screening will definitely “make the playoffs.” But the twelve units in the box right below are an example of the conundrum the utility faces due to uncertainty. A few of these units probably belong be in the box above and should receive attention now. Several probably should be in the box below and are not really a priority this year. For this reason, condition versus criticality matrices are only a first step in staged or hierarchical process as depicted in Figure 1.3. As shown, the sixteen breakers in the two categories closest to the upper right are scheduled for immediately inspection and evaluation. Based on those results several may be moved into the upper category and would be assigned for refurbishment or replacement. In this way, every one of the 894 medium voltage breakers in the system is assigned to an appropriate category of work to support the aging asset management program.
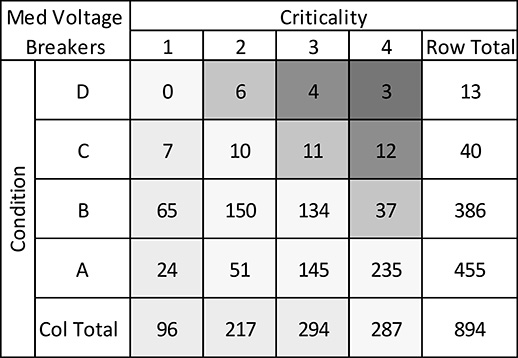
Figure 1.4 Condition versus Criticality Matrix for 894 medium voltage (feeder) breakers at a medium size utility in the central US identifies three transformers as having both a poor condition and high criticality of failure/breakdown consequences, and 16 others of high concern.
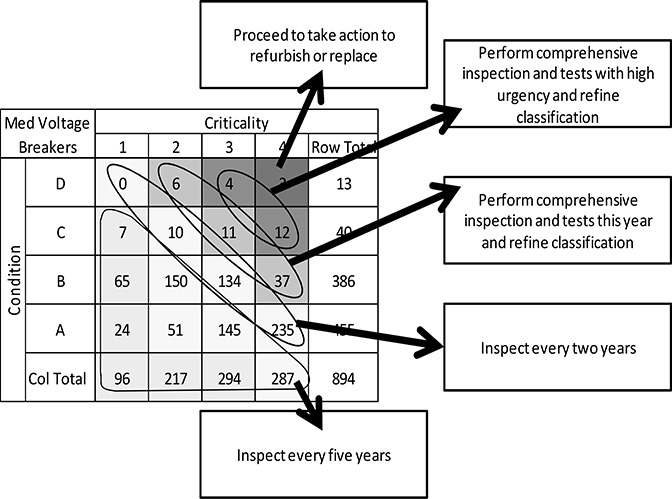
Figure 1.5 Condition and Criticality leads to actions that recognize the underlying uncertainty in condition evaluation and seeks to clarify condition in all but the most urgent situations before prescribing further action.
1.9 CONCLUDING REMARKS
Aging power delivery infrastructures include utility system equipment and facilities that are old and of concern due to deterioration of condition, which leads to high failure rates, repair and replacement costs, and customer service interruptions (Table 1.4). The infrastructure also includes the operating and management processes and methods that the utility uses to determine and control its use of that system and its equipment. In many cases these processes and methods are as old as that system’s equipment and in need of revision and augmentation just as the system is. Regardless, making changes and additions to its operating processes and methods and perhaps the power delivery system, too, a utility can control condition deterioration and impacts on customer and system performance so that it can get the best business results possible.
Manage Both Effects and Causes
Managing an aging infrastructure is about both reducing the effects of aging equipment as much as possible (if you can’t control the disease, control the symptoms) and controlling the deterioration of the system as much as possible (but keep the disease under control as much as you can). Some combination of effort and budget split between these two will be optimum. That is the primary focal point for executive management. For example, a distributed secondary network design renders a power system almost completely immune to a high incidence of small random failures through the system. Compared to the traditional radial central trunk feeder system, they are an order of magnitude more tolerant of failures. Should a utility with aging equipment shift to such a design so the system and the customer base “just doesn’t care” about increasing failure rates? Of course not. Making that move would be very expensive, and distribution networks carry their own operating characteristics that would be difficult to live with en masse over an entire system.
But a move in that direction might be a good idea. There is a huge range of distribution configurations between the distributed secondary network approach and the traditional central trunk radial feeder approach, such as multi-branch feeder/highly sectionalizable feeder layouts, open and closed loop systems of various types. Particularly in combination with “smart” equipment and control systems, these can provide a certain amount of immunity from increasing rates of equipment failure. The failures still occur, but they lead to far lower SAIDI and SAIFI increases.
Table 1.4 Characteristics of the Typical Aging Infrastructure Area
|
But ultimately, the utility has to address, or at least control, the root cause, which is deterioration of equipment due to the wear and tear of service. This correlates with age more than anything else, but age is not the direct cause. There is also a noticeable element of random luck involved: a brand new transformer can be struck by lightning and greatly weakened, too. As much as justifiable based on cost and results, the utility needs to find a way to address this.
Condition Data, Modeling, and Tracking is the Key to Success
Regardless of the concepts and approach taken in managing an aging infrastructure, condition estimation is the foundation of any aging infrastructure management program. The extent to which the utility can, in an affordable and practicable manner, separate the bad equipment (poor condition) from the good (otherwise) determines the potential it has to manage its infrastructure and achieve economical success. Ultimately, any path to success requires the utility to separate the equipment that is in a condition to give satisfactory service, regardless of age, from equipment, old or new, that is deteriorated or flawed to the point that it will not provide satisfactory service.
The Future System Will Not Necessarily Be Good, Just “Good Enough”
Power system engineers and operators dream of a system in which all of the equipment is in first class shape: in top operating condition, clean, nicely painted, shiny, and new. That is only a dream. It is not the practical future of any power system (even one that is brand new today). Any well-managed aging power delivery infrastructure will have high portions of old equipment in it. Quality and condition will not be uniformly first-class throughout, but only “barely good enough” in places.
The service transformers shown in Figure 1.6 are old, have a patina of rust and mildew, and do not live up to that dream. They are a bit noisy, too, indicating their cores are a tad loose. If tested, it is likely they would return mediocre results – within specifications, but not near the “new” end of the test range. Yet for all that, these transformers are in place and doing their job, and their condition and criticality does justify replacement. Replacing them makes little economic sense, to particularly when money is needed to replace and repair equipment that is in much more need of attention.

Figure 1.6 A bank of service transformers does not look new, because they aren’t, but they are good to go in a system that is trying to get the most from its past investments in equipment. The utility’s challenge is to separate these units, which can be expected to give satisfactory service for many years to come, from other units that won’t.
An Optimum Path Toward an Optimum Sustainable Point
In Section 1.1, the authors introduced the term sustainable point to mean an operating status at which the infrastructure no longer deteriorates and performance no longer worsens each year. Ideally, a utility would find an affordable and effective way to manage aging equipment to achieve a good sustainable point. It would put the resources, tools and management processes needed in place to affect that program. The system and its performance would then be controlled. The system would be an infrastructure with controlled aging, managed to a set of cost and results goals.
A good deal of this book is devoted to the sustainable point concept and its application to the management of the aging power delivery infrastructures. The final chapters of this book deal almost exclusively with determining what is the best sustainable point and then managing to it. The Appendices describe how to model it from operating and historical data and give details about the characteristics of using it in practical application. Key features of sustainable points are summarized here. They will be presented in more detail, proven, discussed and then used later in this book.
A sustainable point exists from every power delivery infrastructure. The sustainable point for a particular infrastructure is a function of the power system’s layout and design, the equipment it is composed of and the ages and conditions of that equipment, and the ownership strategy, operating rules, guidelines and standards being used to care for and operate the system made up of that equipment.
A different sustainable point can exist, if changes are made. Change anything within this infrastructure – change the system layout and the way circuits are configured, or the equipment or its condition, or how it is loaded or how it is inspected and maintained, or the ownership strategy and operating rules for refurbishment and replacement, etc., and the sustainable point will change.
A power delivery infrastructure trends toward its sustainable point – slowly. As a mental exercise, suppose one installs 100,000 wood distribution poles, all new, and puts all of them into service on January 1 of particular a year. Ignore infant mortality failure rates in this example and operate them as most utilities do (basically, do nothing until they fall over or a period of five to ten years, when they are inspected and treated with an anti-fungal spray).
Very few will be replaced in the following 365 days of operation because they are all new and in good condition and few will fail. As a result, nearly all the poles will make it into year two. The “system” will age almost exactly 1.0 year in its first year of operation, and enter the following year with average age just slightly less than one year.2 In that following, second year of operation, the poles will again exhibit a good failure rate, etc.
Over time the average age continues to climb at about one year per year, but as the age increases, the average failure rate begins to increase – very slowly at first because deterioration rates are very gradual initially. More and more failures will occur each year, meaning that more and more new poles are installed each year, until at some point the new poles counteract the continued aging, at least on average. To make the sustainable point and this trend understandable for the moment, suppose that this balance occurs when average age reaches 50 years, at which failure rate is 2%. This means in this year, 2% of poles will be replaced with new (because they fail) and 98% will not fail and will be a year older going into the next year. Average age will then be 98% x 51 years + 2% x 0 years = very nearly exactly 50 years again. The system will not have aged: it is at its sustainable point. The reader should note that this is a very simplified example, far too simple for useful application or generalization. It is used here only to quickly communicate the concept that eventually a balance point – the sustainable point – is reached. The fact that this point exists for any and all power infrastructures can be proven mathematically and demonstrated by example based on just about any power system. But in the real world, the sustainable point is more complicated than this example makes out. In particular, in the real world failure rate and age are never reciprocal (in this example, the age, is equal to the inverse of the failure rate of 2%, i.e., 50 = 1/.02).
Furthermore, due to non-linearities in just about every relationship and factor involved, and non-uniformities in nearly all the statistical distributions involved, it is much more common for a sustainable point for a set of wood utility poles to be something like 64 years at .61%. In addition, the sustainable point is reached when not just average, but distributions about the mean are stable. This is often quite important to a utility. All this will be discussed as needed in later chapters, It is covered in detail in Appendix B’s tutorials.
Practical Implications: the Good and the Bad
From a practical standpoint, what is important to electric utilities and the people who manage and operate them about the sustainable point is:
Good: Most power systems are not at their sustainable point – yet. With no significant exceptions, all utility systems in the US are not yet at their sustainable point. Despite age and aging, including perhaps pockets of seriously old equipment and facilities (80+ years old) even the oldest systems in the US are still getting older ever year.
2Perhaps the failure rate for new poles is .25%, meaning that 250 poles failed. Treating the new poles as age = 0 and the originals as age =1, at the beginning of the next year the average age is .9975 years.
Bad: The sustainable point is much worse than now. In almost every power system throughout North America, the sustainable point for the power delivery infrastructure (power system in combination with current operating and management rules) would be completely unacceptable to customers, utility, and regulators alike. It represents a combination of failure rate, reliability, and cost that is far worse than present.
Good: The system will take time to get there: one can count on the slow, steady trend. Power systems do not fall “off the edge” with regard to aging and its effects, nor does aging typically lead to catastrophic “system meltdowns” when failure rates and costs skyrocket over a short period of several years. Aging power delivery infrastructures instead are very similar to quicksand: the situation slowly but inexorably worsens, perhaps until it is very bad. This is a particularly apt analogy in other ways, too. First, often measures taken to get out of the mess are counter-productive, and only worsen the situation in the long run. Second, only a sustained steady pull will extract one from the situation.
Bad: all this means it’s going to get worse every year. Things move slowly, and storms and year-to-year randomness mean volatility will be seen in annual results, but the long term trend is inevitable: things will gradually get a lot worse.
Good: the sustainable point can be moved. The utility can change its strategy, its ownership and operating policies, its maintenance and service guidelines, etc., and move the sustainable point to something more to its liking.
Bad: it takes a good deal of time for systemic changes to have a significant impact. The “sluggish” response of the system to aging and its effects works the other way, too. Perhaps a utility is at an uncomfortable point with regard to particular equipment (i.e., failure rates are 3X that of new equipment due to significant deterioration of condition) in a system on its way to a sustainable point that is much worse than that, perhaps 10X). A change in inspection, maintenance, repair and refurbishment policies that results in a sustainable point that has a failure rate “as good as new” will not make a huge impact overnight. Even targeted as effectively as possible, these changes might take five years or more to drive failure rates back down to only 2X.
Effective programs cost a lot of money. As discussed in Section 1.1, it costs more money. The industry will ultimately have no choice but to either accept worsening reliability or somewhat higher costs.
Good: changes in design and configuration along with the addition of “smart equipment” reduce the system’s vulnerability and sensitivity to its aging and deterioration-related effects. Basically they mitigate the consequences of failure. Old, deteriorated equipment still fails as frequently as before, it just does not matter as much or have as much effect.
More good: these measures lower the cost all around. Actually, these changes move the sustainable point themselves, but the way many people chose to look at them is that they make changes to operating guidelines, maintenance and inspection programs, etc., more cost effective (less is needed).
The Optimum Plan Does Not Quickly Reach Its Sustainable Point
The sustainable point is a useful concept because it makes the basic behaviors and trends of an aging power delivery infrastructure (see above) more understandable and intuitive. It also can help in some statistical analytics applications and numerical modeling steps (knowledge of the characteristics of an answer can help solve for it with minimal error). However, most often the optimum business strategy is to not quickly jump to the sustainable point. Examples later in this book will demonstrate this, but generally, given the “sluggish” response of aging systems and the effectiveness of methods like circuit configuration revision and the addition of smart equipment in reducing system sensitivity to equipment failures, the optimum business strategy is to start now, on a path that optimizes results but might takes as long as twenty years to reach a sustainable point: as the system continues to age and deterioration continues to take its toll each year, the utility makes staged changes that keep the effects of aging just barely at bay: the program just barely erases the increases in reliability problems and operating costs that would have occurred.
Thus, every year, as the system’s failure rates increase just a small amount, the utility spends a little more on smart equipment and targeted circuit configuration changes to make the system a little less susceptible to failures than it was the year before. It begins to remove the most worrisome equipment and replace it with new or refurbished equipment. It applies life extension in areas and to equipment where it makes economic sense. It starts to apply inspection and maintenance programs that will have an effect over the long run. All of this is done in a coordinated manner, with the most effective measures being “used up” first, and generally only to an extent needed each year.
Thus, when all is said and done, a lot is changing each year, but what is not changing are the key performance indicators. SAIFI, SAIDI, safety, system performance, utility profit margin, and business results basically stay where they have been and were traditionally. The utility is on a long-term, gradual path that will take years but will gradually change the sustainable point to an acceptable status. Perhaps the original sustainable point represented reliability and cost problems that are three times what last year’s were. And perhaps it would take twenty years for the quicksand-like pace of deterioration to take its toll, (these values are representative of many real systems). Then the roll out of the program can be be viewed as taking about that long. The utility gradually moves the sustainable point to that operating point it wants.
This works: performance stays where it was. It is often optimum or close to it from just about any and all standpoints. But it is necessary for one practical reason. Any solution to the management of an aging power delivery infrastructure will involve increasing spending. This can be done optimally but it will still represent a significant increase – the discussion in Section 1.1 mentioned a 50% increase and that is representative of what most utilities will face. Rolling that out gradually, a few percent a year, is really the only option that will be viable to the utility, to regulators, and to the utility’s customers. That said, there are two final points executive management will need to consider:
1. The best sustainable point may not have today’s performance results. When all is considered, a gradual change to less reliability, or different reliability (higher SAIFI, lower SAIDI, or vice versa) may be best. Given historical trends, the authors expect our society will expect better reliability, particularly with respect to storm damage. Regardless, executives and planners should not assume that the only answer lies with keeping results where they are now.
It is never too early to start. The sustainable point might be 20 years in the future. The point where the continuing gradual trend becomes untenably unreliable and costly serious might be eight to ten years in the future. Regardless, the time to begin putting a solution in place is now: a 50% increase in spending spread over 20 years is much more palatable and manageable than a similar increase spread over only 15 years.
What Can and Should Be Done
The most easily identifiable characteristic of an aging delivery infrastructure is that a lot the equipment is old. However, “old” alone is not enough to cause concern and age is not the real issue. A good deal of that old equipment is very likely in satisfactory condition – good enough to remain in service for at least a few and perhaps many more years. The problem in an aging infrastructure system or area is that an unacceptably high portion of the old equipment is not dependable enough for continued service. It is deteriorated to the point that the failure rate or capability is seriously degraded, and from a practical and economic standpoint, it is incapable of providing satisfactory service in a dependable manner in the future.
Major Challenges Need to Be Overcome
The first major challenge to a utility is finding that equipment with poor condition amidst the greater mass of merely old equipment, determining what it faces overall (when it looks at all old equipment, its entire system, and its options) and then doing something affordable and effective about the situation. The second major challenge a utility faces is to determine what its viable alternatives are and which to pick. This usually involves folding aging infrastructure management into its long-tern business strategy and mainstream processes.
Table 1.5 Summary of Suggested Fixes for Aging Infrastructure Problems
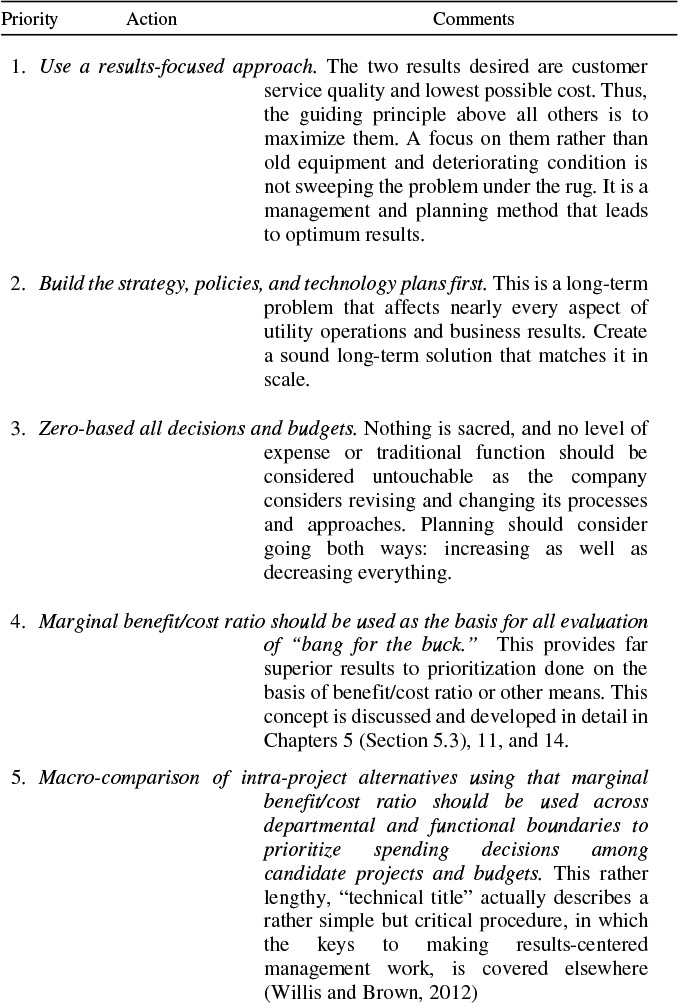
The final challenge for a utility is in finding the money to implement its plan. Even at its best, any successful program to keep an aging infrastructure at a stable, sustainable and acceptable operating point will cost more than the utility was spending prior to aging having become a problem. A big part of the effort will be communicating this to other stakeholders and arranging cost escalation to be slow enough that it is palatable to others.
Table 1.5 gives ten key recommendations for how to proceed. Much this book will be about these recommendations and the details of their application. The central theme is a condition-based, sustainable-point focused, multi-attribute asset management approach. This complicated-sounding approach is straight-forward in concept even if rather intricate to apply well in many of its technical steps:
• Condition based. It is condition, not age, that is the major focus. Old equipment actually preferable: it means the utility is getting its value from what it spent – long ago.
• Sustainable point means that the utility does focus on the long-term aging trends and where they are going, and in determining how to manage them best in the long run.
• Multi-attribute means the utility is considering all its important goals and targets, such as customer reliability, system efficiency and cost, safety, public image, capital spending limits, and overall business risk.
• Asset management is a method of performing such work in a way that prioritize work and planning alternatives so that spending is as cost effective as possible (Willis and Brown, 2012).
REFERENCES AND BIBLIOGRAPHY
R. E. Brown, Electric Power Distribution Reliability – Second Edition, CRC Press, Boca Raton, 2009.
R. E. Brown, Business Essentials for Utility Engineers, CRC Press, Boca Raton, 2009.
R E Brown, et al., “Spatial Load Forecasting Using Non-Uniform Areas” in Proceedings of the IEEE T&D Conference, April, 1999.
R. E. Brown, et al., “Reliability and Capacity: A Spatial Load Forecasting Method for a Performance-Based Regulatory Environment,” in Proceedings of the IEEE PICA Conference, May, 1999, San Jose.
P. Carrier (Chairman), Interim Report of the U.S. Department of Energy’s Power Outage Study Team: Findings from the summer of 1999, United States Department of Energy, Office of Policy, Washington, January 2000.
M. V. Engel et al., editors, Tutorial on Distribution Planning, IEEE Course Text EHO 361-6-PWR, Institute of Electrical and Electronics Engineers, Hoes Lane, NJ, 1992.
H. N. Tram et al., “Load Forecasting Data and Database Development for Distribution Planning,” IEEE Trans. on Power Apparatus and Systems, November 1983, p. 3660.
H. L. Willis, “Load Forecasting for Distribution Planning, Error and Impact on Design,” IEEE Transactions on Power Apparatus and Systems, March 1983, p. 675.
H. L. Willis, Spatial Electric Load Forecasting – Second Edition, Marcel Dekker, New York, 2002.
H. L. Willis, Power Distribution Planning Reference Book – Second Edition, Marcel Dekker, New York, 2004.
H. L. Willis and R. E. Brown, “Substation Asset Management,” Chapter 19 in Electric Power Substations Engineering- Third Edition, J. D. McDonald, editor, CRC Press, Boca Raton, 2012.
H. L. Willis and R. W. Powell, "Load Forecasting for Transmission Planning," IEEE Transactions on Power Apparatus and Systems, August 1985, p. 2550.
H. L. Willis and J. E. D. Northcote-Green, "Spatial Load Forecasting -- A Tutorial Review," Proceedings of the IEEE, Feb. 1983, p. 232.
H. L. Willis and H. N. Tram, “Load Forecasting for Transmission Planning,” IEEE Trans. on Power Apparatus and Systems, paper 83 SM 379-5, March 1984.