9
QUANTITATIVE EMPIRICAL RESEARCH IN MARXIST POLITICAL ECONOMY: A SELECTIVE REVIEW
Deepankar Basu
University of Massachusetts Amherst
1. Introduction
Marxist political economy has a long and distinguished tradition of quantitative empirical analysis, going all the way back to Marx himself. Using tax returns data to infer patterns of top income distribution and nutrition data to understand conditions of the working class population in Volume I of Capital, Marx anticipated Thomas Piketty by more than 150 years and the discipline of development economics by about 100. Lenin's monumental work, The Development of Capitalism in Russia, had used extensive quantitative data on distribution of landholdings, small peasant industries and factory industries in Russia and Europe to argue against the Narodnik claim that capitalism could not develop in a backward country like Russia.
This robust tradition has been kept alive by the painstaking research of numerous Marxist scholars, who have used, over the years, improved statistical techniques and better measurement for quantitative empirical work. In this chapter, I review some of this literature, focusing specifically on quantitative empirical research in the following areas: (a) construction of Marxist national accounts, (b) analysis of classical theories of relative prices, (c) probabilistic political economy, (d) profitability analyses and (e) analysis of classical-Marxian growth, distribution and biased technical change. The choice of these topics derives from my own research interests and expertise. Naturally, then, many other interesting and important lines of empirical research in Marxian political economy will not be surveyed in this chapter. That is why this is a selective survey, as the title of the chapter makes clear and so, I make no claims about comprehensiveness.
The rest of the chapter is organized as follows. In Section 2, I provide a quick review of theoretical debates in the labour theory of value that started with the so-called transformation problem in Volume III of Capital. I argue that the Sraffa-based critique of the 1970s was the culmination of a long tradition that had criticized Marx on his handling of the transformation problem, and, more importantly, that this episode was extremely productive for Marxist political economy. It challenged Marxist scholarship and elicited creative responses. I briefly outline five different Marxist responses to the Sraffa-based critique, and then spend more time, in subsequent sections, discussing two of these responses that have generated impressive quantitative empirical work. But before taking that up, I review research work, in Section 3, on a topic that has widespread acceptance among Marxist scholars, both as to its usefulness and to its broad methodology: construction of national accounts on the basis of Marxist principles.
In Section 4, I return to the value controversy and survey quantitative empirical research associated with the Standard Interpretation, where the primary issue under investigation is the deviation of prices from values. In Section 5, I continue discussion of the value controversy and review work that derives from a probabilistic approach to political economy. In the following two sections, I survey work on topics that have generated impressive research output but do not directly connect to the value controversy. Section 6 discusses the literature on profitability analysis, and Section 7 surveys empirical work related to the classical-Marxian theories of growth, distribution and technical change. In the concluding section, I summarize the main lines of the review and also highlight two interesting puzzles. Mathematical proofs and definitions are collected in an Online Appendix that is available from this book's website and/or from the author upon request.
2. The Value Controversy
The relationship between the ‘value’ and ‘price’ of commodities has been an important issue of investigation in the classical-Marxian tradition for more than two centuries. In the context of such discussions, ‘value’ is defined as the total socially necessary abstract labour time directly and indirectly needed to produce (and therefore embodied in) a commodity with current technology and average intensity of work effort. Thus, values of commodities are measured in units of time, for example, hours. On the other hand, the category of ‘price’ refers to the set of prices that would arise in the long run when rates of profit are equalized across all industries (these long-run equilibrium prices are referred to in the literature as prices of production, or production prices, or natural prices). The price of production, like any other price, of a commodity is measured in units of money, for example, U.S. dollars. Both Ricardo and Marx were aware of the fact that relative prices (of production) and relative values were related to each other in complicated ways and need not necessarily coincide. But they had different ways of understanding this relationship. That is where I start the story.
2.1 Ricardo, Marx and Bortkiewicz
Ricardo thought that the two ratios—relative prices and relative values—were approximately equal for individual commodities. After examining ample textual evidence, Stigler (1958) summarized this contention with the famous quip that Ricardo had a 93% labour theory of value, with the 93% figure capturing the approximation involved. On the other hand, Marx understood that profit rate equalization and different compositions of capital across industries would necessarily lead to a deviation of relative prices (of production) from relative values of individual commodities. Hence, he conceptualized the equivalence between values and prices at the aggregate level (Marx, 1991). For him, the process of equalization of the rate of profit was driven by the movement of capital across industries from lower (than average) to higher (than average) rates of profit. This process tended to push the economy, in the long run, towards a state where all industries earned a uniform rate of profit and commodities exchanged at prices of production. Since industries differed in their composition of capital, this meant that individual prices and values necessarily diverged from each other.
For Marx, emergence of a uniform rate of profit (and prices of production) was primarily a way of conceptualizing the redistribution of surplus value across industries enforced by competitive pressures. He thought that both surplus value and total value would be preserved in this process of ‘transformation’ of values into prices (of production). That is why he proposed the aggregate value–price equivalence as the cornerstone of his labour theory of value in Volume III of Capital: total value = total price, and total surplus value = total profits.
At this point, the reader might wonder as to how Marx could have claimed the equivalence between total value and total price (or total surplus value and total profits) when the quantities in the two sides of this equality are measured in different units. After all, as I have noted above, values are measured in units of (labour) hours and prices are measured in units of a currency (dollars, say). The answer lies in the fact that Marx implicitly used, all through the three volumes of Capital, what Duncan Foley (1982) has called a monetary expression of value (MEV) or what later theorists have called a monetary expression of labour time (MELT).1 The MELT is the quantity of money (i.e. units of the currency) that is equivalent to 1 hour of social labour. Thus, a value magnitude could be multiplied with the MELT to generate its price (monetary) equivalent. Using the MELT, Marx could freely move between values and prices so that when he discusses price–value deviations, both terms (of the equality or inequality) are expressed in terms of the same units.
With this small but necessary detour on units of measurement, let us return to the main narrative. Immediately upon the publication of Volume III of Capital in 1894, critics (like the Austrian economist Eugen von Böhm-Bawerk) discovered two problems in Marx's transformation procedure: prices of inputs had not been transformed (even as prices of outputs had been), and the rate of profit had been calculated in value terms (whereas a consistent procedure would need to calculate it in price terms). While the two errors in Marx's procedure could be easily corrected, as shown by the German statistician-economist Ladislaus von Bortkiewicz in 1907, it was no longer possible, using the correct procedure, to derive both aggregate value–price equalities that Marx had asserted. In a sense, this was the first step away from Marx's analysis: only one of the aggregate value–price equalities could hold (von Bortkiewicz, 1949).
2.2 The Standard Interpretation and the Sraffa-Based Critique
Revival of interest in Marxian economics in the 1960s and 1970s saw further development and elaboration of the Bortkiewicz argument in the works of, among others, Francis Seton, Nobuo Okishio and Michio Morishima. The Seton–Okishio–Morishima contribution recast the question in the Leontief-Sraffa input–output framework, thereby making explicit the use-value basis and sectoral interdependence of capitalist production. At the same time, it generalized the analysis of Marx (five industries) and Bortkiewicz (three departments) to an n-commodity world. The Seton–Okishio–Morishima contribution demonstrated that in a general circulating capital model, relative prices and a uniform rate of profit could be derived rigorously from data on technology and the real wage (commodity) bundle. But, an additional ‘normalization condition’ was needed to derive absolute prices, and either of Marx's aggregate value–price equalities could be used for the purpose (Seton, 1957; Okishio, 1963; Morishima and Catephores, 1978). This was the second step away from Marx's analysis: none of the aggregate value–price equalities could be derived; instead, one of them had to be assumed as a normalization condition.
The Seton–Okishio–Morishima framework of the labour theory of value, sometimes known as the Standard Interpretation, was subjected to a serious Sraffa-based critique in the 1970s, most prominently by Ian Steedman (1977). The main thrust of the critique was an argument of redundancy. Given data on technology and the real wage bundle, one could calculate the uniform rate of profit and prices of production. Hence, there was no need for value categories. Value was conceptually redundant. Even though this critique was not new—the same point had been made previously by Paul Samuelson (1971) and seven decades earlier by the Russian economist Dmitriev (1974/1902)—it was forceful and provocative. Paradoxically, the Sraffa-based critique was also extremely productive for Marxist political economy. In responding to the Sraffa-based critique, Marxist political economy renewed itself. By the early 1980s, one could discern several strands of Marxist political economy that had emerged as a response to the Sraffa-based critique. Many of these strands opened up new, or continued older, lines of scholarly work and research. Without claiming to be comprehensive, I would direct the attention of readers to five strands.
2.3 Marxist Responses to the Sraffa-Based Critique
The first response that developed in the 1970s through the work of scholars like Ben Fine, Laurence Harris, Simon Mohun and others emphasized the difference between the Ricardian understanding of value as ‘embodied labour’ and the Marxian understanding as ‘abstract labour’. While this strand opened up interesting theoretical questions, to the best of my knowledge, it did not materialize into a progressive research program with quantitative empirical work (for a recent exposition of this strand, see Fine et al., 2004).
The second response came from within the Seton–Okishio–Morishima framework in the form of the Fundamental Marxian Theorem (FMT). The FMT demonstrated that positive profits can arise if and only if there is positive surplus value. Since it is a ‘if and only if’ claim, the FMT is a weak response to the Sraffa-based critique. It shows that surplus value is necessary for profits, but equally well that profits are necessary for surplus value. Moreover, the FMT did not lead to any empirical work.
The third response emerged in the work of Anwar Shaikh (1977, 1984), who continued to use a Standard Interpretation of the labour theory of value. His main claim was similar to Ricardo's: value and price magnitudes are approximately equal at the level of individual commodities. In his 1984 paper, Shaikh developed a theoretical argument demonstrating that the deviation of prices from values would be ‘small’ and then used data from the Italian and U.S. economies to show that his claim is empirically valid. Anwar Shaikh's work on this question has given rise to a large literature that I will review below in the section on ‘classical theories of relative prices’.
The fourth response came from the work of two mathematicians, Emmanuel Farjoun and Moshé Machover, who brought a probabilistic approach to political economy. Farjoun and Machover (1983) argued that most economic variables—like price, rate of profit and wage—are non-degenerate random variables, each with their own probability distribution functions. This means that equilibrium in a capitalist economy should be characterized by a distribution of the rate of profit, instead of a single, uniform rate of profit. Looked at from within a probabilistic perspective, the Sraffa-based critique is based on the erroneous postulate of a uniform rate of profit as characterizing long-run equilibrium; hence, its conclusions are invalid. In addition to offering a rebuttal of the Sraffa-based critique, Farjoun and Machover (1983) also developed a positive theory of the distribution of the rate of profit and value–price deviations. This approach, which I will call Probabilistic Political Economy, has seen some recent interesting work that significantly extends the original work of Farjoun and Machover (1983). I review some of this literature below in the section on ‘probabilistic political economy’.
The final response to the Sraffa-based critique came through the New Interpretation (NI) of Marxian economics, developed independently by Duncan Foley and Gérard Duménil in the late 1970s. The NI emphasized Marx's insistence that the value–price equivalence be conceptualized at the aggregate level only. But instead of trying to derive such equivalence from more primitive principles, the NI defined the labour theory of value to be that equivalence. The twin conceptual innovations of ‘value of money’ and ‘value of labour power’ anchored the aggregate equivalence, and created a theoretically informed and consistent accounting framework (for details, see Section B of the Online Appendix). While this aggregate accounting framework does not rule it out, the NI has not generated any work that directly addresses the value–price relationship at lower levels of aggregation. Instead, researchers who adhere to the NI have used the consistent accounting framework as a springboard for interesting empirical work in other areas like profitability analysis, analysis of biased technical change, etc.
Before I review the empirical work related to the classical theory of prices, the probabilistic interpretation of value theory, profitability analysis and biased technical change, I would like to acquaint readers with an important body of empirical work in the Marxist tradition: construction of National Accounts using a consistent classical-Marxist framework.
3. Marxian National Accounts
The aim of Marxian national accounts is to generate estimates of the total value produced in an economy over a period of time, as also its component parts—constant capital, variable capital and surplus value. There is a long tradition that has attempted this task, including Mage (1963), Wolff (1977), Moseley (1982), Shaikh and Tonak (1994), Mohun (2005), Olsen (2011) and Paitaridis and Tsoulfidis (2012). In this paper, I will focus my comments on the ground-breaking work of Shaikh and Tonak (1994), which is, in a sense, a culmination of the previous literature on this issue and also the most comprehensive work to date.2 Traditional national accounts provide the basic data source for constructing Marxian national accounts. But to use the data from traditional national accounts for estimating Marxian value categories, two important distinctions have to be conceptualized and empirically operationalized: (a) the distinction between production and nonproduction activities; and (b) the distinction between productive and unproductive labour.
3.1 Theoretical Considerations
To understand the first distinction, we can divide the basic activities of social reproduction into two mutually exclusive and exhaustive groups: production and non-production. The difference between the two is crucial: while production results in the creation of new use values (wealth) on a net basis, non-production uses up wealth without creating new wealth. Non-production activities can, in turn, be divided into three mutually exclusive and exhaustive groups: distribution, social maintenance and personal consumption. Distribution involves activities that transfer use values, titles to use values or sums of money from one set of economic agents to another. Social maintenance refers to all activities that are geared towards the maintenance and reproduction of the social order. Personal consumption includes all activities involved in the maintenance and reproduction of individuals within the social order.
All schools of economic thought distinguish between production and consumption. Moreover, they agree that production creates wealth and consumption uses up wealth. The difference between the neoclassical and classical-Marxian traditions arises from the characterization of the activities of distribution and social maintenance. For the neoclassical (and Keynesian) tradition, these activities are understood as production as long they are marketable and some entity is willing to pay for the activity or the product arising therefrom. The classical-Marxian tradition differs sharply by arguing that distribution and social maintenance should not be understood as production; rather, they should be understood as social consumption. This is because they use up rather than creating new use values.
These alternative classifications of the basic activities of social reproduction by the neoclassical/Keynesian and classical-Marxian traditions can be summarized in Figure 1. For the neoclassical/Keynesian tradition, personal consumption is coterminous with total consumption and total production is the sum of distribution, social maintenance and production. In sharp contrast, for the classical-Marxian tradition, distribution and social maintenance together make up social consumption, and the sum of social and personal consumption gives total consumption. Total production, on the other hand, is just production proper.
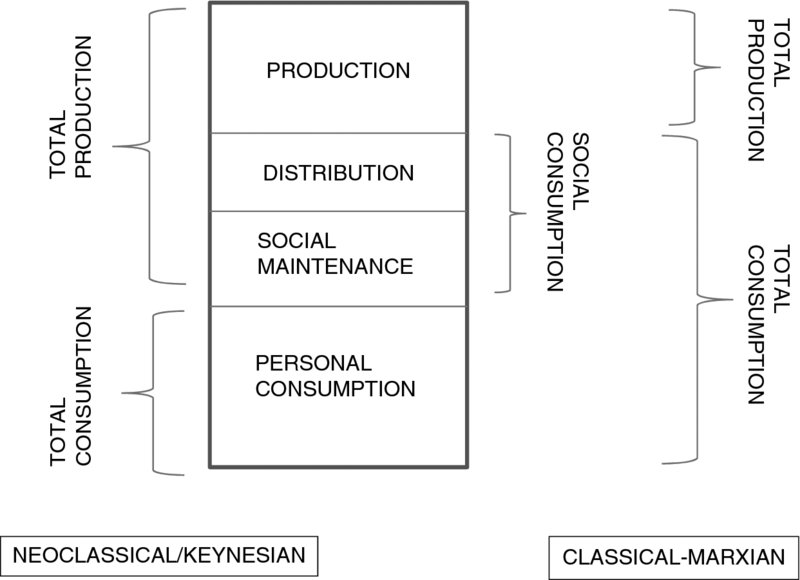
Figure 1. Alternative Classifications of the Four Basic Activities of Social Reproduction in the Neoclassical/Keynesian and Classical-Marxian traditions.
To grasp the second distinction, that is, the distinction between productive and unproductive labour, we can begin by noting that production, distribution and social maintenance can each involve three different types of labour—labour that creates use values for direct use, labour that creates use values for sale for income and labour that creates use values for sale for profit. The classical-Marxian framework argues that the first type of labour creates use values, the second type creates use values and value and the third type creates use values, value and surplus value. With this understanding, the classical-Marxian tradition defines productive labour as all labour that produces surplus value. All other labour is defined to be unproductive because it does not produce surplus value (and capital).3
3.2 Empirical Operationalization
The empirical operationalization of Marxian national accounts for the U.S. economy relies on three data sources: (a) input–output (IO) tables for benchmark years, (b) national income and product accounts (NIPA) for non-benchmark years and (c) Bureau of Labour Statistics (BLS) data for all years.
Traditional IO tables contain comprehensive information about two types of interindustry flows in an economy over a period of time (usually a year). First, for each industry they provide information about the inputs used up and the value added created, the sum of the two being the gross output (revenue). Second, they provide information about the precise manner in which the gross product of any industry is used, that is, either as an intermediate input in some industry or for a final use (personal consumption, investment, government purchases or net export).
Therefore, the first step in the construction of Marxian national accounts is to start with data from the published IO tables, re-classify industries to operationalize the distinction between production and nonproduction activities and add the gross output for all industries in the former category to arrive at an estimate of total value produced. To do so, a researcher needs to answer the following question: which industries should be included in the production sector? To answer this question, we need to keep a peculiarity of IO tables in mind. They record transactions in terms of producers’ prices, instead of purchasers’ prices. Hence, the value of a commodity gets realized in two steps. In the first step, the producer sells the commodity to a wholesaler or retailer, and in the second step, the wholesaler or retailer sells it to the final user. Thus, the sum of the gross output of production and trade activities provide an estimate of the total value produced in the economy.4
To be more precise, the production sector includes three types of industries: all industries that produce goods like agriculture, mining, manufacturing, etc.; all productive services industries like transportation, entertainment, lodging, cooking, healthcare, education, utilities, etc.; and all government enterprises. On the other hand, the trade sector includes the wholesale and retail trade industries, including government trading enterprises, and a part of the real estate sector—the part that deals with building, equipment and car rentals (because rental sale is akin to selling the commodity piecemeal over its lifetime).
Following Shaikh and Tonak (1994), we can call the production and trade sector together as the ‘primary flows’ sector and note that the gross output of this sector is the total value produced in the economy. While industries in the primary flows sector derive their revenues from the production and sale of the commodity product, revenues of all other industries—which take the form of ground rent, finance charges and fees, interest charges, royalties of various types, insurance charges and taxes—are derivatives of primary flows in the following sense: they are either a recirculation of money flows generated by primary flows, or are a circulation of socially validated claims upon parts of primary flows, or both. Hence, we can club together all other industries into the ‘secondary flows’ sector and note that their ‘output’ cannot be counted as creating new value.
With an estimate of the total value (TV*) as the sum of the gross output of the industries in the primary flows sector (production, GOp, and trade, GOt)
we move to the next step and estimate the constant capital (C*) as the sum of material inputs (M′p) and depreciation (Dp) of the production sector
It is worth pointing out that while we have included the gross output of the trade sector in the computation of total value, we have excluded the material inputs (M′t) and depreciation (Dt) of the trade sector from the calculation of constant capital. To understand the reason for this let us compare two scenarios.
In the first scenario, producers directly sell commodities to final users; in the second scenario, producers sell commodities to wholesaler/retailers at the ‘producers’ price’, and the latter then sell the commodities to final users at the ‘purchasers’ price’. Note that there is no difference between the two scenarios as far as the process of production is concerned. Since a classical-Marxian perspective assumes that value can only be produced in the sphere of production, the total value and its components—constant capital, variable capital and surplus value—are going to be the same in the two scenarios. The only difference between the two scenarios arises with regard to the distribution of surplus value. In the first scenario, the total surplus value is realized as the profit of the producer. In the second scenario, the total surplus value is realized as the profit of the producer and the total trade margin, that is, the total revenue of the trade sector. Total trade margin, in turn, is the sum of intermediate inputs, wages and profits of the trade sector. Hence, when we calculate total value, we need to add the gross output of production and trade, but when we compute constant (and variable) capital, we need to exclude the trade sector (because the value of intermediate inputs in the trade sector is part of surplus value and not constant capital).
With estimates of total value and constant capital, we can compute Marxian value added (MVA*) as
So far, we have not yet had to use the distinction between productive and unproductive labour, but in the next step, when we compute variable capital, it will become salient. Variable capital (V*) is defined as the total wage bill of the productive workers in the production sector. Thus, the first task in computing variable capital is to separate out the productive and unproductive workers in the production sector.
The primary source of information on employment for the U.S. economy is the NIPA, which provides data on persons engaged in production (PEP) for all industries. PEP is the sum of full-time equivalent employees (FEE) and self-employed persons (SEP). The NIPA data do not contain any information to distinguish productive and unproductive labour. Hence, we turn to employment data provided by the BLS, which distinguishes between supervisory workers and production/non-supervisory workers. Using the ratio of the latter to total employment is a good estimate of the share of productive workers in any industry. Hence, if j indexes industries in the production sector, then an estimate of productive workers in industry j is given by
where ρj is the ratio of productive workers to total employment in industry j (from BLS), and PEPj is the total employment in industry j (from NIPA). Then, the sum total of all productive workers in production is given by
where the index j runs over all industries in the production sector.
With an estimate of total productive workers in production in place, the next task is to compute their wage bill (or employee compensation). To do so, we need to draw on data from both the NIPA and BLS. Unit wage of productive (production and non-supervisory) workers is available from the BLS. But BLS wage data do not include wage supplements like employer contributions to social security and pension funds. Since the cost of labour power should include total wage and wage equivalents, we turn to data on employee compensation from the NIPA that includes supplements to wages. We can use both sets of information to define employee compensation for productive workers in industry j as
where w′p is the unit wage of production and non-supervisory workers (from BLS), EC is the employee compensation (from NIPA), and WS is wage and salary accruals (from NIPA). The product of employee compensation and productive labour summed over all industries in the production sector provides an estimate of variable capital
where the index j runs over all industries in the production sector, and Lpj is the productive labour in industry j.5
The final step is to calculate the surplus value as
which allows us to compute the rate of surplus value as
and the rate of profit as
where K is the total stock of fixed non-residential gross private capital valued at replacement cost.
Using the methodology outlined above, Shaikh and Tonak (1994) report several interesting findings about the U.S. economy over the period from 1948 to 1989. First, they find that there is a dramatic increase in the share of non-production workers in the total pool of workers. This reflects the corresponding increase in the share of non-production activities in the aggregate economy. Shaikh and Tonak (1994) offer the increase of non-production activities as a possible explanation of the productivity slowdown in the U.S. economy from the early 1970s.6 Second, they find that the rate profit has a pronounced tendency to fall over the period of analysis. This, according to them, supports Marx's hypothesis about the tendency for the rate of profit to fall over time (I will have more to say on this important topic in Section 6.2). The third striking finding from Marxian national accounts is that the ‘social wage’ of production workers have been negative for most of the post-war period. This means that production workers, as a group, have paid more taxes to the State than they have received back in benefits.7 The final interesting finding is that values are ‘close to’ prices, a finding that I will examine in greater detail in Section 4.
The usefulness of the classical-Marxian idea of distinguishing between production and non-production activities, and between productive and unproductive labour is also highlighted in recent work on the employment-output linkage. Basu and Foley (2013) note that one of the ways in which received wisdom on economics was taken by surprise in and after the financial and economic crisis of 2008–2009 was with regard to predicting the depth of the downturn and the weakness of the recovery. While there was some discussion of jobless recoveries, the mainstream literature has not been able to appreciate the significant weakening of the linkage between output growth, as measured by the growth rate of real GDP, and changes in the unemployment rate over the whole business cycle. Thus, not only does unemployment fall by much less during recoveries than would be predicted by the past (jobless recoveries), it also increases by much more during recessions than would be predicted by past trends (severe job loss downturns).
Basu and Foley (2013) demonstrate that this weakening of the linkage between measured aggregate output and employment has been gathering pace since the early 1980s. One way to understand this weakening is to realize that the standard national accounts overestimate value added (real GDP) because they fail to exclude sectors that do not produce value—like finance, insurance and real estate—from the ambit of calculation. Basu and Foley (2013) use a simple classical-Marxian methodology to re-calculate value added by excluding the finance, insurance and real estate from the standard measures of aggregate real GDP. They call this the ‘measurable value added’ and show that it tracks movements in the unemployment rate much better than the standard measures of aggregate output. While this partly accounts for the weakening of the linkage between measured aggregate output and employment (driven by the growth to dominance of the financial sector in the post-war U.S. economy), Basu and Foley (2013) also discuss other issues, like globalization of production and flexibilization of employment, as possible contributing factors.
4. Classical Theory of Relative Prices
The basic framework for empirical analysis of the value–price relationship in the Standard Interpretation literature derives from a theoretical relationship between relative prices and relative values mediated by ratios of integrated capital–labour ratios. I will give a very brief sketch of the argument here; for details see Section A of the Online Appendix and Shaikh (1984).
Let ![]() and
and ![]() be the relative price and relative value of commodity i and j, respectively; then
be the relative price and relative value of commodity i and j, respectively; then
where r and w refer to the uniform rate of profit and wage rate, respectively, and
is the (vertically) integrated capital–labour ratio, that is, the ratio of integrated capital stock, KTi, and integrated labour, LTi (Pasinetti, 1973). The integrated labour, LTi, is the sum of the direct labour required to produce commodity i, and the sum of the labour required to produce the means of production required in the production of commodity i, and the labour required to produce the means of production of the means of production required in the production of commodity i, and so on (integrated capital, KTi, is defined in an analogous manner).
The theoretical results contained in equations (11) and (12) have two important implications. First, the result was derived without imposing any aggregate normalization condition. In particular, it avoids imposing either of the aggregate equalities that Marx thought would hold: total prices = total value, and total surplus value = total profits. This increases the generality and applicability of the result, and also distinguishes it from the NI, where an aggregate value–price equality is the labour theory of value.
Second, it offers a partial rebuttal of the claim that price and values must diverge from each other because sectoral organic compositions are very different from each other. It is partial because it accepts that prices and values will diverge, and it is a rebuttal because it shows that the divergence will be small. To see the latter claim, note that the integrated capital–labour ratio is a weighted average of actual capital–labour ratios for all stages of production going back indefinitely. Hence, its variation across sectors is bound to be much smaller than variation in actual capital labour ratios. To be more precise, this argument suggests that even when actual capital–labour ratios ki and kj are very different from each other, we can have kTi≅kjTas long as the economy is sufficiently interdependent. This means that the term multiplying relative values on the Right hand side (RHS) of equation (11) is ‘close’ to unity. Hence, this opens up the possibility that relative prices and relative values might be ‘close’ to each other even when there is large variation in capital–labour ratios across sectors.
The model in equations (11) and (12) is also the basis of empirical analysis of the claim that values and prices are approximately equal. There are two methods of analysis that have been used in the literature, a regression-based method and a non-regression-based method.
4.1 Regression-Based Methodology
Taking logarithms of equation (11) gives the bivariate regression model that has been widely used for empirical analysis
where a comparison with equation (11) suggests that
A high value of R2 (the coefficient of determination) from the estimation of equation (13)—most researchers using this method have found values of the R2 in excess of 0.9—is interpreted as evidence in support of the Standard Interpretation (or Ricardian) hypothesis that relative values and relative prices are approximately equal (Shaikh, 1984; Cockshott and Cottrell, 1997; Tsoulfidis and Maniatis, 2002).
There seems to be a methodological problem in this approach because the magnitude of the R2 is not the correct way to test the underlying theory. To see this, note that the theory in equations (11) and (12) does not have any implications for the R2 in the bivariate regression model (13) estimated by OLS. Instead, the theory suggests that kTi≅kjT so that the researcher needs to test whether

which is equivalent to testing if

Hence, because the expected value of the error term in equation (13) is zero by construction, the theory in equation (11) would lead to the test of the following joint null hypothesis
with respect to the parameters in equation (13) and can be conducted as a F-test. Moreover, the test of the null hypothesis in equation (16) has a straightforward graphical interpretation: in a bivariate regression of log relative prices on log relative values, as represented by equation (13), the regression line passes through the origin and has a slope of unity.8 None of the papers that have used this methodology have tested the null hypothesis in equation (16), including Shaikh (1984), Petrovic (1987), Cockshott and Cottrell (1997) and Tsoulfidis and Maniatis (2002). This lacuna could be addressed in future research.
4.2 Non-Regression-Based Methodologies
Non-regression-based methodologies have proceeded by constructing various measures of ‘distance’ between the vector of prices and the vector of values. To operationalize this methodology let us define the following n-vector (assuming that there are n sectors in the economy):
Each element of the n-vector is the ratio of the price—price of production, or market price or some other price—and the value of the product in that sector in the economy.9 If the vector x was the unit vector i (which is an n-vector of ones), then for all the n sectors, values and prices would be identically equal. Hence, the basic method of analysis in this approach is to define a measure of ‘distance’ between x and the unit vector i (which represents the benchmark case where the equality of value and price holds completely) and see whether it is relatively small.
Petrovic (1987) uses a measure of distance called root-mean-square-per-cent-error (RMS%E), which is the (positive) square root of the (arithmetic) mean squared (per cent) deviation between x and i:
Ochoa (1989) uses a similar measure of distance called mean absolute deviation (MAD), which is the (arithmetic) mean of the absolute deviation between elements of x and i
and Shaikh (1998) uses a related measure called mean absolute-weighted deviation (MAWD), which is an weighted average of the absolute deviation between elements of x and i
where μj = λjzj/∑λjzj is the weight applied to the jth term, and z denotes the integrated profit–wage ratio (for an exact definition of z, see A.11 and A.12 in Section A of the Online Appendix).
All these measures suffer from the problem that their value depends on the choice of the numeraire. To deal with this problem, Steedman and Tomkins (1998) propose an alternative measure of distance:
where α is the angle between the vectors x and i. Motivated by the discussion in Steedman and Tomkins (1998), Fröhlich (2013) uses the tangent of the angle between the vectors x and i as his preferred measure of (angular) distance: ![]() , where σx and μx are the standard deviation and mean, respectively, of the elements of the vector x. In line with this literature, Shaikh (2016) proposes another unit-independent and scale-free measure, which he calls the classical distance measure, as
, where σx and μx are the standard deviation and mean, respectively, of the elements of the vector x. In line with this literature, Shaikh (2016) proposes another unit-independent and scale-free measure, which he calls the classical distance measure, as
where ![]() and μ denotes the monetary equivalent of total labour time (ratio of aggregate value added measured in monetary units and total labour time),
and μ denotes the monetary equivalent of total labour time (ratio of aggregate value added measured in monetary units and total labour time), ![]() denotes the jth sector's relative wage (ratio of wage in sector j to the total wage in the whole economy), λj denotes, as before, the value of commodity j and
denotes the jth sector's relative wage (ratio of wage in sector j to the total wage in the whole economy), λj denotes, as before, the value of commodity j and ![]() .
.
The general finding in this literature is that the distance measure attains ‘small’ values for a whole range of capitalist economies for which these distance measures have been computed. For instance, the smallest value of RMS%E in table 1 in Petrovic (1987) is 4.45% (for the Yugoslav economy in 1978); similarly, the smallest value of α in table A1 in Fröhlich (2013) is 3.16 degrees (for the German economy). In a similar vein, Shaikh (2016) finds that the classical distance measure evaluated with prices of production and values (what he calls direct prices) for the U.S. economy over the period 1947–1998 attains a value of about 13% (table 9.16, Shaikh, 2016). These are interesting findings and seem to support Ricardo's claim that values and prices of production are approximately equal.
5. Probabilistic Political Economy
Classical economists have conceptualized competition in capitalist economies as a complex and turbulent process. Their distinct and powerful conception of capitalist competition was formulated through the theory of capital mobility. They argued that in capitalist economies, individual capitals, that is, individual capitalist firms, are constantly under pressure to move from industries with lower than (economy-wide) average rate of profits towards industries with above average rates of profit. While the entry of capital into high profit industries would increase industry-level output and put downward pressure on prices and profit rates, the exit of capital from low profit industries would reduce industry-level output and push up prices and the rate of profit. Hence, the process of capital mobility would manifest itself as a pervasive tendency for the rate of profit to equalize across industries.
It is possible to interpret the tendency for profit rate equalization across industries as a description of the long-run behaviour of capitalist economies, as Marx did in Volume III of Capital. Understanding the long run as an ideal state of rest—the state towards which the economy is driven over very long periods of time—one can compute the set of prices that prevail in the long run as ‘prices of production’ using a single profit rate for all industries. Later theorists like Piero Sraffa used this procedure, and a large literature has followed him in studying classical questions about prices (of production), technology and profitability in this framework (see, for instance, Kurz and Salvadori, 1995; Shaikh, 2016).10
An alternative way to approach the mobility of capital is to interpret the tendency of profit rate equalization in a probabilistic framework. As the economy is buffeted by demand and supply shocks and as the flow of information is always less than perfect, the incessant movement of individual capitals in search of higher profit rates never settles down. Hence, the manifestation of capitalist competition should be visualized not as the emergence of a uniform rate of profit across all industries but as the generation of a stable probability distribution of industry-level profit rates.
5.1 Probabilistic Political Economy, Mark I
Farjoun and Machover (1983) proposed such a probabilistic interpretation of capital mobility in capitalist economies and developed arguments to derive the equilibrium distribution of two key variables of interest to Marxist political economy, the rate of profit and what they call the ‘specific price’ (which is defined as the price per unit of embodied labour). The empirical work that follows from this framework relates to testing whether actually observed profit rates and specific prices have the distribution that is posited by the theoretical arguments.
What is the distribution of the rate of profit in capitalist economies? Based on an analogy from statistical mechanics, Farjoun and Machover (1983) hypothesize that the rate of profit has a gamma distribution (details of the two-parameter gamma distribution can be found in Section C1 of the Online Appendix).
In seeking theoretical expression for the distribution of R [rate of profit], a useful heuristic guide is provided by statistical mechanics. In a gas at equilibrium, the total kinetic energy of all the molecules is a given quantity. It can be shown that the ‘most chaotic’ partition of this total kinetic energy among the molecules results in a gamma distribution. Now, if we consider that in any given short period, there is a more-or-less fixed amount of social surplus … and that capitalist competition is a very disorderly mechanism for partitioning this surplus among capitalists in the form of profit, then the analogy of statistical mechanics suggests that R may also have a gamma distribution. (Farjoun and Machover, 1983, p. 68)
Their next task was to derive the distribution of the specific price
where i indexes transactions taking place in some period T, p(i) is the price paid in transaction i and Λ(i) is the total amount of human labour embodied in the commodities that participated in transaction i. Thus, the specific price, Ψ(i), is the price paid per unit of labour content in transaction i. An argument that relies on decomposing total price of any commodity into the sum of non-labour inputs, labour input and profit, and iterating back through the various stages of production of the non-material inputs can be used to show that the numerator in equation (22) is the sum of two terms
where w(i) is the sum of total wages paid to all workers who participated directly and indirectly in the production of commodities involved in transaction i, and π(i) is the sum of total profits earned by all firms directly and indirectly involved in the production of commodities involved in transaction i.11 If there are m firms in the economy, then the sum in equation (23) can be broken into value-added contributions (because value added is the sum of wages and profits) coming from each of these firms (some of which may be zero). Moreover, since this logic holds for each transaction, we can dispense with the index i. Thus,
where the sum in equation (24) runs over the total number of firms in the economy. Since any capitalist economy will have a large number of firms, some version of the central limit theorem can be invoked on equation (24) to suggest that the specific price is distributed as a normal random variable. Farjoun and Machover (1983) also derive the mean and variance of Ψ as ![]() , and
, and ![]() , and thus propose that
, and thus propose that
What does the distribution of the observed rate of profit look like? Farjoun and Machover (1983, Ch. 8) present data on profit rates in the British non-oil manufacturing Industry in 1972 and 1981. After plotting the empirical distribution (figures 5 and 7), they impose a gamma distribution with shape and scale parameters 4.72 and 32, respectively, on top. The empirical distribution seems to visually match the imposed gamma distribution. This can be interpreted as suggestive evidence in support of the claim that the rate of profit is distributed as a gamma random variable.
In a recent study of the German economy for 2000 and 2004, Fröhlich (2013) has strengthened the visual results in Farjoun and Machover (1983) with more rigorous statistical tests. He finds that the empirical distribution of the rate of profit in Germany is well approximated by a gamma distribution with shape and scale parameters of 2.78 and 20.29 in 2004, and 2.03 and 15.65 in 2000. Moreover, a two-sample Kolmogorov–Smirnov test is not able to reject the null hypothesis that rate of profit data in 2000 and 2004 were drawn from the same continuous distribution (p-value = 0.74).12 Fröhlich (2013) also tests the proposition that the ‘specific price’ (price per unit of labour content) is distributed as ![]() . He finds that the mean of specific price is close to 2 in both 2000 and 2004. But the distribution is better approximated as log-normal instead of normal. His results suggest that the logarithm of specific price is distributed as
. He finds that the mean of specific price is close to 2 in both 2000 and 2004. But the distribution is better approximated as log-normal instead of normal. His results suggest that the logarithm of specific price is distributed as ![]() .
.
5.2 Probabilistic Political Economy, Mark II
The key shortcoming of Farjoun and Machover's (1983) analysis was that it used ad hoc arguments to derive the equilibrium distribution of the rate of profit; thus, it was not clear why the profit rate should have a gamma distribution. An alternative, but related, tradition in probabilistic political economy has built on the innovative ideas of statistical equilibrium developed in Foley (1994) to address this problem. This relatively recent literature has replaced the ad hoc arguments of Farjoun and Machover (1983) with a rigorous derivation of the equilibrium distribution (see Alfarano et al., 2012; Scharfenaker and Semieniuk, 2016).
The key idea used to derive the equilibrium distribution is the principle of maximum entropy (PME), which Foley (1994) had taken from the work of the physicist E. T. Jaynes (1957, 1978), and which was implicitly present in the informal arguments of Farjoun and Machover (1983). For a continuous random variable, X, with a probability density function, f(x), defined over the whole real line, entropy is defined as − ∫∞− ∞f(x)log (f(x))dx. This is understood as the degree of uncertainty associated with the possible realizations of the random variable, X. Interpreted as a principle of statistical inference, PME states that the random variable should be assigned a probability distribution that maximizes entropy subject to relevant constraints. Intuitively, maximizing entropy is akin to maximizing the uncertainty about the realizations of the random variable, and equivalently minimizing the informational bias of the inference procedure.
Information theory provides a constructive criterion for setting up probability distributions on the basis of partial knowledge, and leads to a type of statistical inference which is called the maximum-entropy estimate. It is the least biased estimate possible on the given information; i.e., it is maximally noncommittal with regard to missing information. (Jaynes, 1957)
The probability distribution that emerges as the solution to the maximum entropy program, which we can call the maximum entropy distribution, is the best prediction we can make about the distribution of the random variable in question given our informational limitations (captured by the constraints). The constraint that the probabilities sum to unity, ∫∞− ∞f(x)dx = 1, will always be applicable, and with this as the only constraint the uniform distribution will be the maximum entropy distribution. Specific problems might furnish additional constraints, which will then give rise to other maximum entropy distributions.
Alfarano et al. (2012) use data from Thomson Datastream on 623 long-lived publicly traded non-bank U.S. firms, that is, those firms which were present in every year in the dataset over their period of study, 1980–2006, to plot empirical densities of the annual rate of profit (ratio of operating income and total assets). Yearly plots of the empirical densities show a tent-shaped distribution on a semi-log scale for most years, indicating that the Laplace distribution might be a good benchmark for the profit rate of long-lived firms (figure 3, Alfarano et al., 2012). Various goodness-of-fit tests on the empirical distribution functions suggest that the hypothesis of a Laplace distribution cannot be rejected in most cases (appendix A, Alfarano et al., 2012). In a follow-up exercise, Alfarano et al. (2012) expand their sample to all firms and plot empirical densities conditional on survival spans of firms for at least T years. They find that for small T, the distributions are asymmetric and much more leptokurtic to the left of the mode (figure 6, Alfarano et al., 2012). In a similar contribution, Scharfenaker and Semieniuk (2016) use data for U.S. firms from the Compustat/CRSP Annual Northern American Fundamentals database for the period between 1962 and 2014, to show that firm-level profit rate distributions are approximated well with a Laplace distribution before 1980 and with an asymmetric Laplace distribution in the period since then. What could explain the increasing asymmetry of the Laplace distribution since 1980? An interesting hypothesis would be to use information from the conditional density plots from Alfarano et al. (2012), which suggests that in Scharfenaker and Semieniuk's (2016) sample, the proportion of short-lived firms might have increased since the early 1980s. Thus, neoliberalism might have had a negative impact on the average lifespan of firms.
To derive the empirically observed probability distributions of the rate of profit, Scharfenaker and Semieniuk (2016) and Alfarano et al. (2012) adopt different strategies. Scharfenaker and Semieniuk (2016) derive equilibrium distributions of the profit rate as the solution to maximum entropy programs with suitable constraints. The Laplace distribution (which is relevant for the period 1962–1980) arises as a maximum entropy distribution when there are two constraints: the probabilities sum to unity, ∫∞− ∞f(x)dx = 1; and the mean of the absolute deviation of the profit rate from an exogenous measure of central tendency is a constant, ∫∞− ∞|x − μ|f(x)dx = c,
subject to
The asymmetric Laplace distribution (which is relevant for the period 1980–2014) emerges as the maximum entropy distribution when there are three constraints, instead of two: the probabilities sum to unity, ∫∞− ∞f(x)dx = 1; and, the infra-modal observations have a different mean constraint from the supra-modal observations, that is, ∫μ− ∞(μ − x)f(x)dx = c1 and ∫∞μ(x − μ)f(x)dx = c2, which provides another two constraints.
In these maximum entropy programs, argue Scharfenaker and Semieniuk (2016), the constraints are supposed to summarize our understanding about the process of capitalist competition. While these constraints can be seen as necessary to generate the maximum entropy distributions that the researcher is looking for (in this case the Laplace distributions), they are not fine grained enough to capture any intuitions about the process of competition. For instance, why should the mean constraint be specified in absolute deviation form and not in squared deviation form? Our understanding of competition does not allow us to choose between, for instance, these two specifications.
One way to proceed is to derive the maximum entropy distributions from a more primitive process that captures our intuitions about capitalist competition a little better. Alfarano et al. (2012) take this more ambitious route and derive the equilibrium distribution as a diffusion process. This is a continuous time stochastic process, Xt, which emerges as a solution to the following stochastic differential equation:
where D is a constant diffusion parameter, α, σ > 0, ![]() and Wt is a Brownian motion (for a very brief introduction to diffusion processes, see Section C2 of the Online Appendix). The advantage of deriving the equilibrium distribution as a diffusion process is that this formulation allows the competitive process to be decomposed into a drift function and a diffusion function, with the drift function capturing the tendency for equalization of profit rates that operate on all firms and the diffusion function capturing idiosyncratic, firm-level forces.
and Wt is a Brownian motion (for a very brief introduction to diffusion processes, see Section C2 of the Online Appendix). The advantage of deriving the equilibrium distribution as a diffusion process is that this formulation allows the competitive process to be decomposed into a drift function and a diffusion function, with the drift function capturing the tendency for equalization of profit rates that operate on all firms and the diffusion function capturing idiosyncratic, firm-level forces.
I would like to end this brief review of probabilistic political economy with two critical comments. First, the classical view of competition as the mobility of capitals across industries and sectors seem to have implications about the distribution of the industry-level rate of profit, not the firm-level rate of profit. The tendency of the rate of profit to equalize operates at the level of industries and sectors and not firms. Thus, it might be useful to complement the existing analysis of the distribution of firm-level profit rates with an analysis of the distribution of industry-level profit rates. Second, the probabilistic approach to capitalist competition seems to boil down to the following: (a) identifying the theoretical distribution function that best describes the empirical distribution of the rate of profit; (b) identifying the constraint(s) that can be imposed on a maximum entropy program to get the theoretical distribution that was identified in the previous step as the maximand distribution; or, identifying a stochastic differential equation that can give the theoretical distribution identified in the previous step as its solution; and (c) using economic theory to motivate or justify the specific constraint(s) that was used in maximum entropy program or the specific stochastic differential equation that was used in the previous step. Thus, the burden of economic reasoning now falls squarely on some moment constraints in a maximum entropy program or a specific form of the drift and diffusion function defining a diffusion process. On this score, much work needs to be done to convince researchers that some new insight is gained from this approach about the real capitalist economy.
6. Profitability Analysis
Marxian political economy understands capitalism as a system driven by the logic of capital accumulation. Since the rate of profit is a key determinant of capital accumulation, a large Marxist literature has developed around the analysis of profitability, with at least two sub-strands. The first strand focuses on what we may call decomposition analysis, where short- or medium-run temporal movements in the rate of profit are, on the one hand, used to explain key developments in capitalist economies, and on the other, explained by movements of its components, suitably defined. One of the key substantive issues motivating this strand of profitability analysis has been the possible link between the rate of profit and structural crises of capitalism. A second, more recent, strand analyses long-run movements in the rate of profit and has used econometric analysis to empirically address Marx's law of the tendential fall in the rate of profit (understood as a long-run phenomenon).
6.1 Decomposition Analysis
Decomposition analysis comes in two varieties, determined by the time span of analysis, a medium-run analysis and a short-run analysis.
6.1.1 Medium-Run Decomposition Analysis
When a medium-run perspective is adopted, fluctuations of aggregate demand are abstracted from. Hence, to study the drivers of profitability over a medium-run time scale, a decomposition of the rate of profit into the share of profit and the output–capital ratio is typically used, that is,
where r is the rate of profit, Π is total profits, K is the stock of fixed capital and Y is value added. In the decomposition in equation (28), the profit share, Π/Y represents income distribution between capitalists and workers, and technology is represented by the output–capital ratio Y/K. Changes in the two factors are used to explain the observed movements of the rate of profit. This is followed by a detailed analysis of the evolution of both these components by further decomposing them into sub-components. To do so, the profit share is decomposed as follows:
where W is the total wage bill, w = W/(L*Py) is the real product wage, y = Y/(L*Py) is the real labour productivity and Py is some index of the price of value added (e.g. GDP deflator); and the output–capital ratio is decomposed as
where Yr is real value added, Kr is real capital stock, Py is an index of the price of value added and Pk is an index of the price of capital stock. Dividing real value added and the real capital stock by the total labour input (measured in hours of number of workers) in the expression for the output–capital ratio in equation (30), we see that it is the product of a real ratio and a price ratio. The real ratio has real labour productivity in the numerator and a measure of the ‘composition of capital’ in the denominator. The price ratio has an index of the price of output in the numerator, and a price of capital stock in the denominator. Hence, changes in the real ratio can be conceptualized in terms of the effect of changes in the composition of capital on labour productivity, an approach that Marx often adopted.
Change in, or the growth rate of, each of the components in these decompositions is studied and then related to changes in broader political economic factors like the contours of class struggle, evolution of state policies, cross-border mobility of capital and other relevant factors. This approach has been used to study medium-run capitalist evolution, as also episodes of crises under capitalism (Duménil et al., 1984, 1985; Michl, 1988; Duménil and Lévy, 1993; Foley and Michl, 1999; Duménil and Lévy, 2004; Marquetti et al., 2010; Duménil and Lévy, 2011; Basu and Vasudevan, 2013; Mohun, 2013).
6.1.2 Short-Run Decomposition Analysis
When a short-run profitability analysis is of interest, the profit rate decomposition includes three terms. In addition to technology and distribution, capacity utilization rate is used as a variable to capture the effect of fluctuations in aggregate demand. Letting Z refer to capacity output, the three-part decomposition can be written as
where the first term on the right Π/Y is the profit share, the second term Y/Z is the capacity utilization rate and the last term Z/K is the capacity–capital ratio. Just like in the medium-run analysis, each of the three terms in the decomposition is further decomposed into its real and nominal components for further, and detailed, study. Following the pioneering work of Weisskopf (1979), many scholars have used and extended this strand of the literature (e.g. Henley, 1987; Bakir and Campbell, 2009; Kotz, 2009; Izquierdo, 2013; Basu and Das, 2015).
6.2 Econometric Analysis of the LTFRP
Marx's claim in Volume III of Capital that the rate of profit has a tendency to fall with capitalist development, which he called the law of the tendential fall in the rate of profit (LTFRP), has generated an enormous literature over the past decades. While the theoretical literature has developed sophisticated arguments, the empirical literature on this issue, till very recently, was relatively less developed. Many researchers merely used exploratory data analysis, like visual inspection of time series plots or fitting trend lines to the profit rate series, to test the validity of the LTFRP.
Basu and Manolakos (2013) pointed out that there were two important shortcomings of this empirical literature. First, it did not take account of the time series properties of the rate of profit. This was important because whether the profit rate series was stationary or non-stationary would have important implications on empirical analyses of its long-run behaviour, including the validity of the LTFRP. Second, Marx's account of the LTFRP accorded an important role to counteracting factors but none of the existing studies took this into account.13 Basu and Manolakos (2013) argued that failure to account for the effect of the counteracting factors on the observed time series of the rate of profit would invalidate any tests of the LTFRP.
The second point is important and bears some discussion. In Volume III, Marx offered a simple and powerful argument for the LTFRP. Capitalist competition and the struggle between capital and labour push capitalist firms to adopt labour-saving technical changes. The pronounced bias of technical change under capitalism expresses itself as the inexorable mechanization of the production process. This results in the continuous growth of the organic composition of capital, which pushes down the rate of profit. After outlining this argument for the LTFRP, Marx immediately notes the presence of powerful ‘counteracting factors’ in capitalist economies that would halt or even reverse the LTFRP: (1) the increasing intensity of exploitation of labour, which could increase the rate of surplus value; (2) the relative cheapening of the elements of constant capital; (3) the deviation of the wage rate from the value of labour power; (4) the existence and increase of a relative surplus population; and (5) the cheapening of consumption and capital goods through imports. Marx also mentioned an increase in share capital as a sixth counteracting influence. Yet the relationship between share capital and the rate of profit is not clear and therefore we can abstract from this variable, following Foley (1986).
The important point is that in periods when the counteracting factors were weak, the rate of profit would fall; when the counteracting factors were strong, the rate of profit would stop falling and might even rise. The result is that the observed profit rate series would not display a secularly declining trend. Hence, neither visual inspection of time series plots nor fitting trend lines to the profit rate series were the correct ways to test the validity of the LTFRP. To test the LTFRP, a researcher would first need to remove the effect of the counteracting factors from the profit rate series and only then investigate for the presence of a downward long-run trend. This is precisely what a regression analysis could do. Hence, Basu and Manolakos (2013) developed an econometric model to test the LTFRP where they regressed the logarithm of the rate of profit on a constant and a linear time trend, and controlled for the effect of the counteracting factors by including them in the model as additional covariates. After dealing with the possibility of a spurious regression and using data for the U.S. economy for the period, 1948–2007, they find evidence in support of the LTFRP: the rate of profit declined by 0.2% per annum over the period of analysis after counteracting factors had been controlled for.
7. Classical-Marxian Theories of Growth, Distribution and Technical Change
Over the past few decades, an impressive body of research has developed a classical-Marxian framework for studying growth, distribution and patterns of technical change in capitalist economies (see, for instance, Duménil and Lévy, 1995; Foley and Marquetti, 1997; Foley and Michl, 1999, 2004; Michl, 1999, 2002, 2009; Duménil and Lévy, 2003; Foley and Taylor, 2006). A key feature of this literature is that, having taken the Cambridge capital controversy seriously, it eschews the use of a smooth production function. This is an important contribution to the development of a framework for the analysis of growth of capitalist economies that is an alternative to the neoclassical framework.
This alternative framework recognizes the importance of biased technical change in capitalist economies. It has been observed that technical change is biased in capitalist economies, in the sense that labour and capital productivity does not grow symmetrically through time. In fact for a large group of capitalist countries and over long periods of time, labour productivity has been observed to have increased even as the output–capital ratio (capital productivity) has declined (or stagnated). In the language of macroeconomics, such a pattern of technical change would be characterized as labour-saving and capital-using. Interestingly, it also matches the depiction of the process of technical change under capitalism developed by Marx. Hence, Foley and Michl (1999) call this Marx-biased technical change (MBTC) and Duménil and Lévy (2003) describe it as trajectories à la Marx.
There are two reasons why such patterns of biased technical change might be interesting from a Marxist perspective. First, since the share of profits in national income has been relatively stable over long periods of time, especially before the 1980s, periods of rising labour productivity and declining output–capital ratio—the pattern seen with MBTC—puts downward pressure on the rate of profit and could precipitate a period of crisis. Hence, MBTC can become an important component of explanations of crisis tendencies in capitalist economies. Second, MBTC gives rise to an important proposition relating to the viability of technical change, that is, whether a new technique of production will be adopted by profit-maximizing capitalist firms, that can be used to derive competing testable implications about income distribution corresponding to a neoclassical and a classical-Marxian viewpoint. Hence, MBTC can be used to devise a test between the neoclassical and classical-Marxian theories of growth and distribution.
To get a handle on the second point, let us recall some definitions. A technique of production is the pair (x, ρ), where x is labour productivity and ρ is the output–capital ratio. The set of all currently existing techniques of production represents ‘technology’, and technological progress is addition of new techniques to technology. In a capitalist society, the distribution of income between the two fundamental classes—the wage rate w and the rate of profit v—can be represented by
where w is the wage rate and k = x/ρ is the capital intensity of a technique of production.14 Represented in v − w space, the relationship in equation (32) is a downward sloping straight line with an intercept x and slope − k, as depicted in Figure 2. We can call it the distribution schedule because it represents the class struggle over the distribution of income in capitalism.

Figure 2. Marx-Biased Technical Change and the Choice of Technique.
To pose the question about the choice of technique, suppose the current best-practice technique of production is given by (x, ρ) and a new technique (x′, ρ′) becomes available with x′ = x(1 + γ), and ρ′ = ρ(1 = χ). Note that each technique of production corresponds to a different distribution schedule in Figure 2. Now, suppose the current (real) wage rate is w and further that capitalist firms expected it to grow at some positive rate η > 0, so that w′ = w(1 + η), and let π denote the current profit share, that is, π = (1 − w/x). Is the new technique of production ‘viable’, that is, would a profit-maximizing capitalist firm choose the new technique of production?
Let ven denote the expected rate of profit that would arise if the new technique of production were to be adopted. Then,
If, on the other hand, the current technique of production continues to be used but the wage rate increases to w′, the profit rate would be
If the expected wage rate w′ is bigger than the ‘switch point’ wage rate (the wage rate given by the intersection of the two distribution schedules)
then the corresponding relationship among the profit rates is given by
That is, the expected profit rate when using the new technique of production is higher than the expected profit rate with the old technique. Hence, profit-maximizing capitalist firms will adopt the new technique of production, that is, the new technique of production will be viable. A little algebra shows that equation (36) will be satisfied if the following holds:
In the above analysis, the switch point wage rate (w*) plays an important role. If the expected wage rate is higher than w* then the firm will switch from the old to the new technique of production; if the expected wage rate is lower than or equal to w*, then the firm will continue using the old technique. It is in this sense that the intersection of the two distribution schedules is a switch point.
But how does this relate to the neoclassical model? Recall that in a neoclassical framework, technology is represented by a smooth production function, for example, a Cobb–Douglas production function. In such a set-up, even a small change in the wage rate leads to a new technique of production being chosen. This is because in a neoclassical set-up the curve that represents the north–east frontier of the intersection of the two distribution schedules—the curve ABC—would be a smooth convex (to the origin) curve. Hence, every point on such a curve would be a switch point. Thus, in terms of the classical-Marxian model, the neoclassical position is represented by the condition that w′ = w* or π = π*, whereas the Marxian position is that w′ > w* or π < π*.
Basu (2010) considers two variants of the model in equations (35)–(37). The first variant has zero expected growth in the real wage rate, that is, η = 0; and the second has the expected real wage rate growing in tandem with labour productivity, that is, γ = η. The second variant is more realistic because it accords well with historical data suggesting roughly equal growth rate of productivity and wages before the 1980s. Hence, Basu (2010) uses the second variant to conduct empirical analysis in a cross-country regression framework with the following model
To test the neoclassical versus the classical-Marxian models, he tests the joint null hypothesis
with an F-test. Since the neoclassical model suggests that the viability parameter and the actual profit share are equal, rejection of the null hypothesis in equation (39) can be interpreted as evidence against the neoclassical model.
Using data from the Extended Penn World tables 2.1, Basu (2010) conducts the test for the period 1963–2000 for two sets of countries: (a) 25 OECD countries; and (b) 117 developed and developing countries (which include the 25 OECD countries). He reports high values of the F-statistic (which are significant at standard levels) for both sets of countries and concludes that there is strong evidence against the neoclassical viewpoint. Using data from the period 1963–1998, Michl (2009) also finds strong evidence—from cross-sectional, time series and pooled regressions—against the neoclassical model.
An alternative approach to test for the existence of MBTC is explored in Marquetti (2004) and by de Souza (2016). The basic idea used in these papers is the following. The incentive for labour-saving technical change increases under high wage pressure. Hence, there should be a causal relationship running from real wages to labour productivity. Since both real wages and labour productivity are unit root non-stationary variables, an eminently plausible hypothesis is that they are co-integrated, implying that there is a long-run relationship between the two variables. Moreover, it is this long-run relationship that, driven by MBTC, gives rise to non-trending profit and wage shares. Marquetti (2004) uses this methodology with time series data on the U.S. economy for the period 1869–1999 and finds evidence in favour of MBTC. de Souza (2016) extends the analysis to a panel data setting for manufacturing industries. Using the EU-Klems dataset covering 11 industries in 19 developed countries, and the UNIDO dataset covering 22 industries in 30 developing countries, he finds evidence of MBTC.
8. Conclusion
In this chapter I have reviewed some recent strands of quantitative empirical research in Marxist political economy. I started out by providing a quick overview of the debate surrounding the value controversy. Value is a foundational concept in Marxian political economy, and its interpretation and relationship to observable variables denominated in prices has been a source of lively debate and, often, bitter controversy. Starting almost immediately with the publication of Volume III of Capital in 1894, critics have argued that Marx's work in the three volumes of Capital does not provide an internally consistent labour theory of value. Repeating points made earlier by critics like Dmitriev and Samuleson, Ian Steedman (1977) elaborated this critique—what he called a Sraffa-based critique—in a forceful manner in the 1970s. The main claim in the critique was that value categories are redundant to the analysis of capitalism because prices of production and a uniform rate of profit can be computed directly from data on technology and distribution (the real wage bundle).
One can discern at least five different responses to the Sraffa-based critique that I have briefly indicated in Section 2.3. In this chapter, I have focused on the three Marxist strands that have not only responded to the redundancy critique but also opened up progressive research programs with nontrivial empirical components: the Standard Interpretation as developed by Anwar Shaikh; the Probabilistic Interpretation developed by Farjoun and Machover; and the New Interpretation developed by Duncan Foley and Gerard Dumenil. Each of these responses accepts the fact that prices of production and a uniform rate of profit can be computed from data on technology and distribution. But, each argue in their own way, that this does not make value categories redundant.
Before reviewing this literature, I took a detour by reviewing a literature that has wide acceptance—both as to its necessity and basic methodology—in the Marxist tradition, viz., construction of national accounts that is consistent with Marxist political economy. Starting with traditional input–output (and national accounts) data, the operationalization of two key conceptual features can take us to Marxist national accounts: the distinction between production and nonproduction activities, and the distinction between productive and non-productive labour.
There is a long and distinguished literature that has worked on this issue, including Mage (1963), Wolff (1977) and Moseley (1982), and has culminated in Shaikh and Tonak (1994). There is an urgent need to carry this work forward by applying Shaikh and Tonak's (1994) methodology, with certain modifications that may be necessary (e.g. Mohun, 2005), to construct and disseminate Marxist national accounts for as many countries as data limitations make possible. This is an area that can fruitfully engage future Marxist scholars and it is encouraging to see that work on these issues is being continued (e.g. Paitaridis and Tsoulfidis, 2012; Rotta, 2014).
Returning to the value controversy, I first discussed the response to the Sraffa-based critique developed in and through the work of Anwar Shaikh in the late 1970s. The argument contained in Shaikh (1984) provides, to my mind, a partial rebuttal of the Sraffa-based critique by converting the question into an empirical one. According to this ‘standard interpretation’ response, the interesting question is not that values and prices diverge, which is uncontroversial, but by how much? In essence, this strand advances Ricardo's neglected claim that values and prices are approximately equal. In Shaikh (1984), a theoretical argument is constructed to show that even in the face of wide divergence of organic composition of capital across sectors, relative prices can be ‘close’ to relative values because they depend on vertically integrated capital labour ratios and not actual capital–labour ratios. Using data from several capitalist economies, this strand then demonstrates that relative values and relative prices are strongly correlated, or that a suitable measure of distance between the vector of prices and values is small.
The second response to the Sraffa-based critique that I discuss emerged from the work of Farjoun and Machover (1983), who argued for a probabilistic approach to Marxist political economy. Farjoun and Machover's rebuttal of the Sraffa-based critique rested on asking a simple question: is there any justification for the assumption of a single, uniform rate of profit? The answer is: no. Empirical evidence shows that in any economy at any point in time, there is a distribution of the rate of profit, rather than a single value of the rate of profit. Thus, long-run equilibrium of capitalist economies is characterized by equilibrium distributions of the rate of profit, and not a single uniform rate of profit. Once the assumption of a uniform rate of profit is abandoned, the whole Sraffa-based critique collapses.
In addition to the rebuttal of the Sraffa-based critique, Farjoun and Machover (1983) also develop a positive program of probabilistic political economy. They argue that the rate of profit follows a gamma distribution, and develop an elaborate argument to show that the specific price (price per unit of labour embodied) follows a normal distribution. While the distribution of the rate of profit is derived on the basis of an analogy from statistical mechanics, the distribution of the specific price is derived by taking recourse to some central limit theorem. Evidence presented by Fröhlich (2013) for the German economy shows that the rate of profit does indeed follow a gamma distribution but that the specific price follows a log-normal distribution (instead of a normal distribution). This strand of the literature has been significantly extended in recent work by Alfarano et al. (2012) and Scharfenaker and Semieniuk (2016), both of which open up interesting avenues for future research.
The third response to the Sraffa-based critique that I discuss emerged as the ‘new interpretation’ of Marx's value theory, developed independently by Foley (1982) and Duménil (1983/1984). The new interpretation's rebuttal of the Sraffa-based critique relies on developing a theoretically informed, internally consistent ex post accounting framework. Two definitions anchor this accounting framework. First, the value of money is defined as the ratio of the total labour embodied in the net output (measured in labour time units) and the money value added (measured in prices). Second, the value of labour power is defined as the product of the nominal money wage and the value of money. These two definitions imply that profits are proportion to unpaid labour time, and value added is proportional to total labour time (the latter by definition). This is the way in which the redundancy argument is addressed in the NI: since value and price is equal at the aggregate level, the question of redundancy itself becomes redundant.
Even though the deviation of individual values and prices could be investigated in the NI framework, researchers adhering to this interpretation have studied other questions. One issue that has been studied extensively is the evolution of the rate of profit rate in relation to developments in the economy, followed by a decomposition analysis to study factors that drive medium- and/or short-run dynamics. Another issue has been to study the validity of Marx's law of the tendential fall in the rate of profit using modern econometric methods. A third issue that has been investigated relates to patterns of growth, distribution and technical change in capitalist economies.
This brief review of recent quantitative empirical research in Marxist political economy has highlighted some of the interesting issues that are currently being investigated in this tradition. When we look at all the existing approaches at once, some puzzles and conundrums do emerge. I would like to end this review by highlighting two of these intriguing issues. My hope is that these real and challenging puzzles will pique the interest of new generations of researchers and help in the effort to move Marxian political economy beyond mere discussions of what Marx ‘really’ meant.
The first puzzling issue comes to the fore when we think of the conclusions of Section 3 (Marxian national accounts) and Section 4 (classical theory of price–value deviation) together. The literature reviewed in Section 4 suggests that prices of production and values are approximately equal. When we juxtapose this with the work reported in Section 3, it seems that national monetary aggregates do reflect national labour values, at both aggregate and disaggregated levels (to the extent allowed by IO tables). If this is correct, then what are the implications of this for unequal exchange through the balance of payments? Is this just a matter of differences in national vertically integrated labour–capital ratios? Or, are the principles governing the flows recorded in the balance of payments outside the equilibrating logic underlying the prices of production? What is the implication of this for theories of imperialism that hinge on the notion of unequal exchange between countries (or blocs of countries)?
The second puzzle emerges from a juxtaposition of the discussion in Section 4 (classical theory of price–value deviation) and the NI (which I have briefly outlined in Section 2.3 and in Section B of the Online Appendix). Unequal exchange at the micro-level is central to the vision of the NI. It underlies the metaphor—first developed by Baumol (1974)—that all capitals contribute to a world pool of surplus value according to the labour they exploit, and draw from it according to their competitive edge. The key mechanism that effects this redistribution of surplus value is the price mechanism, that is, the deviation of market prices from values. For the net value added, these deviations must sum to zero, as the NI emphasizes. If sectoral price–value deviations are also small, as the literature on classical price–value deviations reviewed in Section 4 claims, then this raises a puzzle. How do we explain the incomes of commercial capital and financial capital in terms of the process of circulation?
Acknowledgements
I have benefitted from comments from two anonymous referees of this journal. I would also like to thank, without implicating in any way for the content of this paper, Duncan Foley, Tom Michl, Simon Mohun and Anwar Shaikh for comments on an earlier version.
Notes
References
- Alfarano, S., Milaković, M., Irle, A. and Kauschke, J. (2012) A statistical equilibrium model of competitive firms. Journal of Economic Dynamics and Control 36(1): 136–149.
- Bakir, E. and Campbell, A. (2009) The effect of neoliberalism on the fall in the rate of profit in business cycles. Review of Radical Political Economics 38(3): 365–373.
- Basu, D. (2010) Marx-biased technical change and the neoclassical view of income distribution. Metroeconomica 61(4): 593–620.
- Basu, D. and Das, D. (2015) Profitability in India's organized manufacturing sector: the role of technology, distribution and demand. Working Paper 380, Political Economy Research Institute, University of Massachusetts Amherst.
- Basu, D. and Foley, D.K. (2013) Dynamics of output and employment in the US economy. Cambridge Journal of Economics 37(5): 1077–1106.
- Basu, D. and Manolakos, P.T. (2013) Is there a tendency for the rate of profit to fall? Econometric evidence from the US economy, 1948–2007. Review of Radical Political Economics 45(1): 75–94.
- Basu, D. and Vasudevan, R. (2013) Technology, distribution and the rate of profit: understanding the current crisis. Cambridge Journal of Economics 37(1): 57–89.
- Baumol, W.J. (1974) The transformation of values: what Marx “Really” meant (an interpretation). Journal of Economic Literature 12(1): 51–62.
- Cockshott, W.P. and Cottrell, A.F. (1997) Labour time versus alternative value bases: a research note. Cambridge Journal of Economics 21(4): 545–549.
- de Souza, J.P.A. (2016) Real wages and labour-saving technical change: evidence from a panel of manufacturing industries in mature and labour surplus economies. International Review of Applied Economics. Published online 25 August. https://doi.org/10.1080/02692171.2016.1225017
- Dmitriev, V.K. (1974 [1902]) Economic Essays on Value, Competition and Utility. Edited with an Introduction by D.M. Nuti. Translated by D. Fry. Cambridge, UK: Cambridge University Press.
- Duménil, G. (1983/1984) Beyond the transformation riddle: a labour theory of value. Science & Society 47(4): 427–450.
- Duménil, G. and Lévy, D. (1987) The dynamics of competition: a restoration of the classical analysis. Cambridge Journal of Economics 11(2): 133–164.
- Duménil, G. and Lévy, D. (1993) The Economics of the Profit Rate: Competition, Crises, and Historical Tendencies in Capitalism. Aldershot, UK: Edgar Elgar.
- Duménil, G. and Lévy, D. (1995) A stochastic model of technical change: an application to the US economy (1869–1989). Metroeconomica 46(3): 213–245.
- Duménil, G. and Lévy, D. (2003) Technology and distribution: historical trajectories à la Marx. Journal of Economic Behavior and Organization 52(2): 201–233.
- Duménil, G. and Lévy, D. (2004) Capital Resurgent: Roots of the Neoliberal Revolution. Translated by D. Jeffers. Cambridge, MA: Harvard University Press.
- Duménil, G. and Lévy, D. (2011) The Crisis of Neoliberalism. Cambridge, MA: Harvard University Press.
- Duménil, G., Glick, M. and Rangel, J. (1984) The tendency of the rate of profit to fall in the United States, part 1. Contemporary Marxism 9: 148–164.
- Duménil, G., Glick, M. and Rangel, J. (1985) The tendency of the rate of profit to fall in the United States, part 2. Contemporary Marxism 11: 138–52.
- Farjoun, E. and Machover, M. (1983) Laws of Chaos: A Probabilistic Approach to Political Economy. London, UK: Verso.
- Feldstein, M. and Summers, L. (1977) Is the rate of profit falling? Brookings Papers on Economic Activity 1: 211–228.
- Fine, B., Lapavitsas, C. and Saad-Filho, A. (2004) Transforming the transformation problem: why the “new interpretation” is a wrong turning. Review of Radical Political Economics 36(3): 3–19.
- Foley, D.K. (1982) The value of money, the value of labour power and the Marxian transformation problem. Review of Radical Political Economics 14(2): 37–47.
- Foley, D.K. (1986) Understanding Capital: Marx's Economic Theory. Cambridge, MA: Harvard University Press.
- Foley, D.K. (1994) A statistical equilibrium theory of markets. Journal of Economic Theory 62(2): 321–345.
- Foley, D.K. and Marquetti, A. (1997) Economic growth from a classical perspective. In J. Texeira (ed.), Proceeding: International Colloquium on Money, Growth, Distribution and Structural Change: Contemporaneous Analysis. Department of Economics, University of Brasilia, Brazil.
- Foley, D.K. and Michl, T.R. (1999) Growth and Distribution. Cambridge, MA: Harvard University Press.
- Foley, D.K. and Michl, T.R. (2004) A classical alternative to the neoclassical growth model. In G. Argyros, M. Forstater and G. Mongiovi (eds.), Growth, Distribution and Effective Demand: Alternatives to Economic Orthodoxy. Essays in Honor of Edward J. Nell. Armonk, NY: M. E. Sharpe.
- Foley, D.K. and Taylor, L. (2006) A heterodox growth and distribution model. In N. Salvadori (ed.), Economic Growth and Distribution: On the Nature and Causes of the Wealth of Nations. Cheltenham, UK: Edward Elgar.
- Fröhlich, N. (2013) Labour values, prices of production and the missing equalization tendency on profit rates: evidence from the German economy. Cambridge Journal of Economics 37(5): 1107–1126.
- Glick, M. (1985) Competition versus monopoly: profit rate dispersion in US manufacturing industries. Ph.D. Dissertation, New School for Social Research, New York.
- Henley, A. (1987) Labour's share and profitability crisis in the US: recent experience and post-war trends. Cambridge Journal of Economics 11(4): 315–330.
- Izquierdo, S.C. (2013) The cyclical decline of the profit rate as the cause of crises in the United States (1947–2011). Review of Radical Political Economics 45(4): 463–471.
- Jaynes, E.T. (1957) Information theory and statistical mechanics. The Physical Review 106(4): 620–630.
- Jaynes, E.T. (1978) Where do we stand on maximum entropy? In: R.D. Rosenkrantz and E.T. Jaynes (eds.), Papers on Probability, Statistics and Statistical Physics. Dordrecht, Netherlands: Kluwer Academic Publishers.
- Kotz, D. (2009) Economic crises and institutional structures: a comparison of regulated and neoliberal capitalism in the US. In J. Goldstein and M. Hillard (eds.), Heterodox Macroeconomics: Keynes, Marx, and Globalization (pp. 176–188). London and New York: Routledge.
- Kurz, H.D. and Salvadori, N. (1995) Theory of Production: A Long Period Analysis. Cambridge: Cambridge University Press.
- Mage, S.H. (1963) The law of the falling tendency of the rate of profit: it's place in the Marxian theoretical system and relevance to the United States. Ph.D. Dissertation, Department of Economics, Columbia University.
- Marquetti, A. (2004) Do rising real wages increase the rate of labour-saving technical change?: Some econometric evidence. Metroeconomica 55(4): 432–441.
- Marquetti, A., Filho, E.M. and Lautert, V. (2010) The profit rate in Brazil, 1953–2003. Review of Radical Political Economics 42(4): 485–504.
- Marx, K. 1990 [1867] Capital: A Critique of Political Economy. Volume I. Translated by B. Fowkes. London, UK: Penguin Books.
- Marx, K. 1991 [1894] Capital: A Critique of Political Economy. Volume III. Translated by D. Fernbach. London, UK: Penguin Books.
- Michl, T.R. (1988) The two-stage decline in US nonfinancial corporate profitability, 1948–86. Review of Radical Political Economics 20(4): 1–22.
- Michl, T.R. (1999) Biased technical change and the aggregate production function. International Review of Applied Economics 13(2): 193–206.
- Michl, T.R. (2002) The fossil production function in a vintage model. Australian Economic Papers 41: 53–68.
- Michl, T.R. (2009) Capitalists, Workers and Fiscal Policy: A Classical Model of Growth and Distribution. Cambridge, MA: Harvard University Press.
- Mohun, S. (2005) On measuring the wealth of nations: the US economy, 1964–2001. Cambridge Journal of Economics 29(5): 799–815.
- Mohun, S. (2013) Rate of profit and crisis in the US economy: a class perspective. In L. Taylor, A. Rezai and T.R. Michl (eds.), Social Fairness and Economics: Economic Essays in the Spirit of Duncan Foley (pp. 171–198). London and New York: Routledge.
- Mohun, S. (2014) Unproductive labour in the US economy, 1964–2010. Review of Radical Political Economics 46(3): 355–379.
- Morishima, M. and Catephores, G. (1978) Value, Exploitation, Growth: Marx in the Light of Modern Economic Theory. London, UK: McGraw-Hill Book Co.
- Moseley, F.B. (1982) The rate of surplus-value in the United States: 1947–77. Ph.D. Dissertation, Department of Economics, University of Massachusetts, Amherst.
- Moseley, F.B. (2000) The “new solution” to the transformation problem: a sympathetic critique. Review of Radical Political Economics 32(2): 282–316.
- Ochoa, E.M. (1989) Values, prices, and wage-profit curves in the US economy. Cambridge Journal of Economics 13(3): 413–430.
- Okishio, N. (1963) A mathematical note on Marxian theorems. Weltwirtschaftliches Archiv 91: 289–299.
- Olsen, E.K. (2011) Modeling the economic surplus in a SAM framework. American Journal of Economics and Sociology 70(5): 1175–1207.
- Paitaridis, D. and Tsoulfidis, L. (2012) The growth of unproductive activities, the rate of profit, and the phase-change of the U.S. economy. Review of Radical Political Economics 44(2): 213–233.
- Pasinetti, L. (1973) The notion of vertical integration in economic analysis. Metroeconomica 25: 1–29.
- Petrovic, P. (1987) The deviation of production prices from labour values: some methodology and empirical evidence. Cambridge Journal of Economics 11(3): 197–210.
- Rotta, T.N. (2014) Productive stagnation and unproductive accumulation in the United States, 1947–2011. Ph.D. Dissertation, Department of Economics, University of Massachusetts, Amherst.
- Samuelson, P.A. (1971) Understanding the Marxian notion of exploitation: a summary of the so-called transformation problem between Marxian values and competitive prices. Journal of Economic Literature, 9(2): 399–431.
- Scharfenaker, E., and Semieniuk, G. (2016) A Statistical Equilibrium Approach to the Distribution of Profit Rates. Metroeconomica. https://doi.org/10.1111/meca.12134
- Semmler, W. (1982) Competition, monopoly and differentials of profit rates: theoretical considerations and empirical evidence. Review of Radical Political Economics 15(2): 125–133.
- Seton, F. (1957) The “transformation problem”. The Review of Economic Studies 24(3): 149–160.
- Shaikh, A. (1977) Marx's theory of value and the transformation problem. In J. Schwartz (ed.), The Subtle Anatomy of Capitalism. Santa Monica, CA: Goodyear Publishing Co.
- Shaikh, A. (1984) The transformation from Marx to Sraffa. In E. Mandel and A. Freeman (eds.), Ricardo, Marx, Sraffa. London, UK: Verso.
- Shaikh, A. (1998) The empirical strength of the labour theory of value. In R. Bellofiore (ed.), Marxian Economics: A Reappraisal. Essays on Volume III of Capital. Volume 2: Profits, Prices and Dynamics. New York, NY: St. Martin's Press.
- Shaikh, A. (2016) Capitalism: Competition, Conflict, Crises. Cambridge, UK: Cambridge University Press.
- Shaikh, A. and Tonak, E.A. (1994) Measuring the Wealth of Nations: The Political Economy of National Accounts. Cambridge, UK: Cambridge University Press.
- Steedman, I. (1977) Marx after Sraffa. London, UK: New Left Books.
- Steedman, I. and Tomkins, J. (1998) On measuring the deviations of prices from values. Cambridge Journal of Economics 22(3): 379–385.
- Stigler, G.J. (1958) Ricardo and the 93% labour theory of value. American Economic Review 48: 357–367.
- Tsoulfidis, L. and Maniatis, T. (2002) Values, prices of production and market prices: some more evidence from the Greek economy. Cambridge Journal of Economics 26(3): 359–369.
- von Bortkiewicz, L. (1949 [1907]) On the correction of Marx's fundamental theoretical construction in the Third Volume of Capital. In P.M. Sweezy (ed.), Karl Marx and the Close of his System by Eugen von Böhm-Bawerk & Böhm-Bawerk's Criticism of Marx by Rudolf Hilferding. New York: Augustus M. Kelley. 199–221.
- Weisskopf, T.E. (1979) Marxian crisis theory and the rate of profit in the post-war US economy. Cambridge Journal of Economics 3(4): 341–378.
- Wolff, E.N. (1977) Unproductive labour and the rate of surplus value in the United States, 1947–67. In P. Zarembka (ed.), Research in Political Economy (Vol. 1). Greenwich, CT: JAI Press.
- Wolff, R.D., Roberts, B. and Callari, A. (1982) Marx's (not Ricardo's) ‘transformation problem’: a radical reconceptualization. History of Political Economy 14(4): 564–582.