
Chapter 12: Performance Optimization in Angular
Performance is always a concern in any product that you build for end users. It is a critical element in increasing the chances of someone using your app for the first time becoming a customer. Now, we can't really improve an app's performance until we identify potential possibilities for improvement and the methods to achieve this. In this chapter, you'll learn some methods to deploy when it comes to improving Angular applications. You'll learn how to analyze, optimize, and improve your Angular app's performance using several techniques. Here are the recipes we're going to cover in this chapter:
- Using OnPush change detection to prune component subtrees
- Detaching the change detector from components
- Running async events outside Angular with runOutsideAngular
- Using trackBy for lists with *ngFor
- Moving heavy computation to pure pipes
- Using web workers for heavy computation
- Using performance budgets for auditing
- Analyzing bundles with webpack-bundle-analyzer
Technical requirements
For the recipes in this chapter, make sure you have Git and Node.js installed on your machine. You also need to have the @angular/cli package installed, which you can do with npm install -g @angular/cli from your terminal. The code for this chapter can be found at the following link: https://github.com/PacktPublishing/Angular-Cookbook/tree/master/chapter12.
Using OnPush change detection to prune component subtrees
In today's world of modern web applications, performance is one of the key factors for a great user experience (UX) and, ultimately, conversions for a business. In this recipe, being the first recipe of this chapter, we're going to discuss the fundamental or the most basic optimization you can do with your components wherever it seems appropriate, and that is by using the OnPush change-detection strategy.
Getting ready
The project we are going to work with resides in Chapter12/start_here/using-onpush-change-detection, inside the cloned repositor:
- Open the project in Visual Studio Code (VS Code).
- Open the terminal and run npm install to install the dependencies of the project.
- Run the ng serve -o command to start the Angular app and serve it on the browser. You should see the app, as follows:
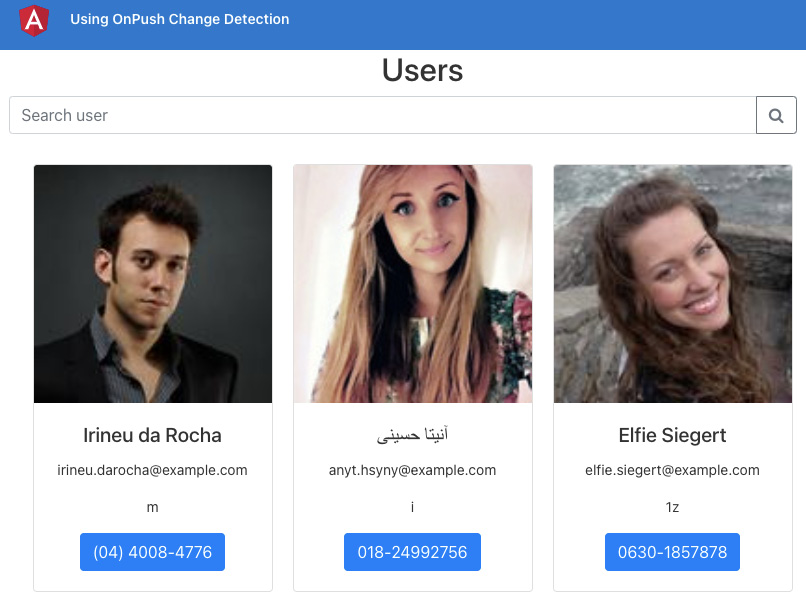
Figure 12.1 – App using OnPush change detection running at http://localhost:4200
Now that we have the project served on the browser, let's see the steps of the recipe in the next section.
How to do it…
The app we're working with has some performance issues, particularly with the UserCardComponent class. This is because it is using the idUsingFactorial() method to generate a unique ID to show on the card. We're going to experience and understand the performance issue this causes. We will try to fix the issue using the OnPush change-detection strategy. Let's get started:
- First, try to search for a user named Elfie Siegert by entering their name in the search box. You'll notice that the app immediately hangs and that it takes a few seconds to show the user. You'll also notice that you don't even see the typed letters in the search box as you type them.
Let's add some logic to the code. We'll check how many times Angular calls the idUsingFactorial() method when the page loads.
- Modify the app/core/components/user-card/user-card.component.ts file, updating it as follows:
...
@Component({...})
export class UserCardComponent implements OnInit {
...
constructor(private router: Router) {}
ngOnInit(): void {
if (!window['appLogs']) {
window['appLogs'] = {};
}
if (!window['appLogs'][this.user.email]) {
window['appLogs'][this.user.email] = 0;
}
}
...
idUsingFactorial(num, length = 1) {
window['appLogs'][this.user.email]++;
if (num === 1) {...} else {...}
}
}
- Now, refresh the app and open the Chrome DevTools and, in the Console tab, type appLogs and press Enter. You should see an object, as follows:
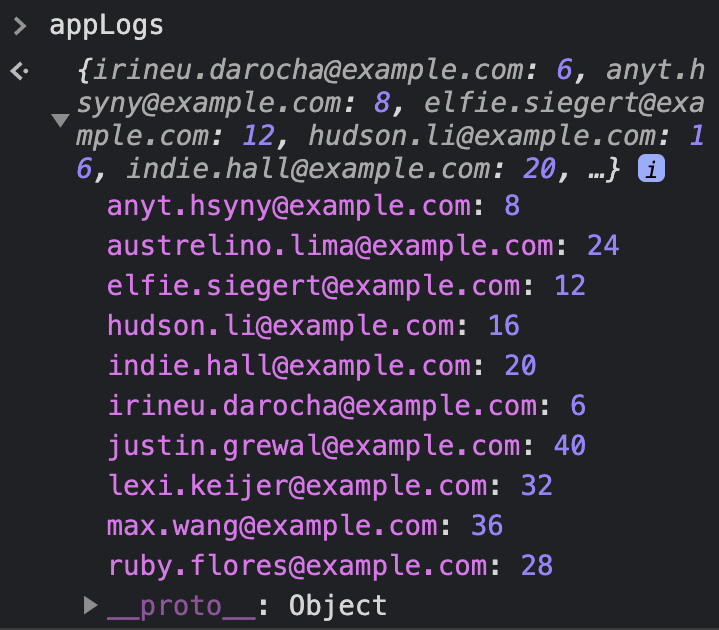
Figure 12.2 – Logs reflecting number of calls to idUsingFactorial() method
- Now, type the name Elfie Siegert again in the search box. Then, type appLogs again in the Console tab and press Enter to see the object again. You'll see that it has some increased numbers. If you didn't make a typo while entering the name, you should see something like this:
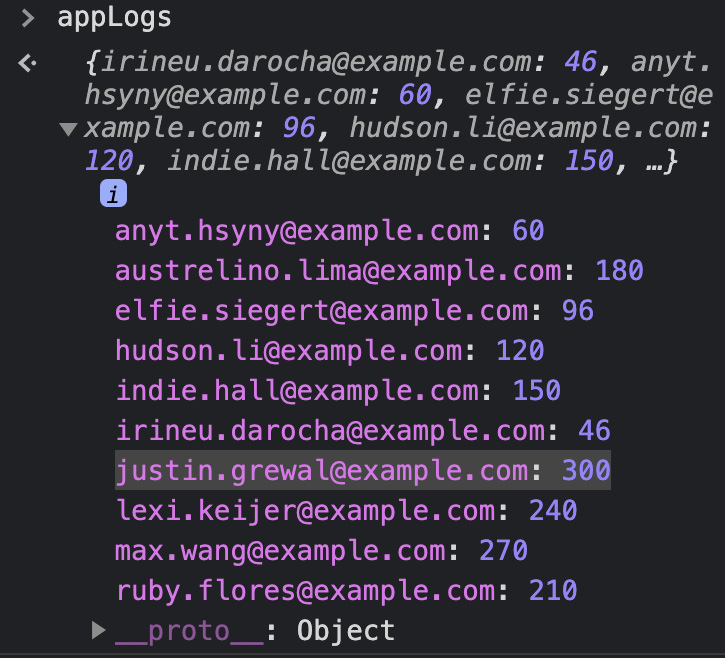
Figure 12.3 – Logs after typing the name Elfie Siegert
Notice the count when calling the idUsingFactorial() method for [email protected]. It has increased from 40 to 300 now, in just a few key presses.
Let's use the OnPush change-detection strategy now. This will avoid the Angular change-detection mechanism running on each browser event, which currently causes a performance issue on each key press.
- Open the user-card.component.ts file and update it, as follows:
import {
ChangeDetectionStrategy,
Component,
...
} from '@angular/core';
...
@Component({
selector: 'app-user-card',
templateUrl: './user-card.component.html',
styleUrls: ['./user-card.component.scss'],
changeDetection: ChangeDetectionStrategy.OnPush,
})
export class UserCardComponent implements OnInit {
...
}
- Now, try typing the name Elfie Siegert again in the search box. You'll notice that you can now see the typed letters in the search box, and it doesn't hang the app as much. Also, if you look at the appLogs object in the Console tab, you should see something like this:

Figure 12.4 – Logs after typing the name Elfie Siegert with OnPush strategy
Notice that even after refreshing the app, and after typing the name Elfie Siegert, we now have a very low number of calls to the idUsingFactorial() method. For example, for the [email protected] email address, we only have 20 hits, instead of the initial 40 hits shown in Figure 12.2, and 300 hits, as shown in Figure 12.3, after typing.
Great! Within a single step, by using the OnPush strategy we were able to improve the overall performance of our UserCardComponent. Now you know how to use this strategy, see the next section to understand how it works.
How it works…
Angular by default uses the Default change-detection strategy—or technically, it is the ChangeDetectionStrategy.Default enum from the @angular/core package. Since Angular doesn't know about every component we create, it uses the Default strategy to not encounter any surprises. But as developers, if we know that a component will not change unless one of its @Input() variables changes, we can—and we should—use the OnPush change-detection strategy for that component. Why? Because it tells Angular to not run change detection until an @Input() variable for the component changes. This strategy is an absolute winner for presentational components (sometimes called dumb components), which are just supposed to show data using @Input() variables/attributes, and emit @Output() events on interactions. These presentational components usually do not hold any business logic such as heavy computation, using services to make HyperText Transfer Protocol (HTTP) calls, and so on. Therefore, it is easier for us to use the OnPush strategy in these components because they would only show different data when any of the @Input() attributes from the parent component change.
Since we are now using the OnPush strategy on our UserCardComponent, it only triggers change detection when we replace the entire array upon searching. This happens after the 300ms debounce (line 28 in the users.component.ts file), so we only do it when the user stops typing. So, essentially, before the optimization, the default change detection was triggering on each keypress being a browser event, and now, it doesn't.
Important note
As you now know that the OnPush strategy only triggers the Angular change-detection mechanism when one or more of the @Input() bindings changes, this means that if we change a property within the component (UserCardComponent), it will not be reflected in the view because the change-detection mechanism won't run in this case, since that property isn't an @Input() binding. You would have to mark the component as dirty so that Angular could check the component and run change detection. You'll do this using the ChangeDetectorRef service—specifically, with the .markForCheck() method.
See also
- Angular ChangeDetectionStrategy official documentation (https://angular.io/api/core/ChangeDetectionStrategy)
- markForCheck() method official documentation (https://angular.io/api/core/ChangeDetectorRef#markforcheck)
Detaching the change detector from components
In the previous recipe, we learned how to use the OnPush strategy in our components to avoid Angular change detection running unless one of the @Input() bindings has changed. There is, however, another way to tell Angular to not run change detection at all, in any instance. This is handy when you want full control on when to run change detection. In this recipe, you'll learn how to completely detach the change detector from an Angular component to gain performance improvements.
Getting ready
The project for this recipe resides in Chapter12/start_here/detaching-change-detecto:
- Open the project in VS Code.
- Open the terminal and run npm install to install the dependencies of the project.
- Run the ng serve -o command to start the Angular app and serve it on the browser. You should see the app, as follows:

Figure 12.5 – App detaching-change-detector running at http://localhost:4200
Now that we have the project served on the browser, let's see the steps of the recipe in the next section.
How to do it…
We have the same users list application but with a twist. Right now, we have the UserSearchInputComponent component that holds the search input box. This is where we type the username to search for it in the users list. On the other hand, we have the UserCardListComponent component that has a list of users. We'll first experience the performance issues, and then we'll detach the change detector smartly to gain performance improvements. Let's get starte:
- Refresh the app in the browser, then just click inside the search input, and then click outside the search input to first trigger a focus event on the input and then to trigger a blur event. Repeat this two times more, and then, on the console inside the Chrome Dev Tools, check the value of the appLogs object. You should see something like this:
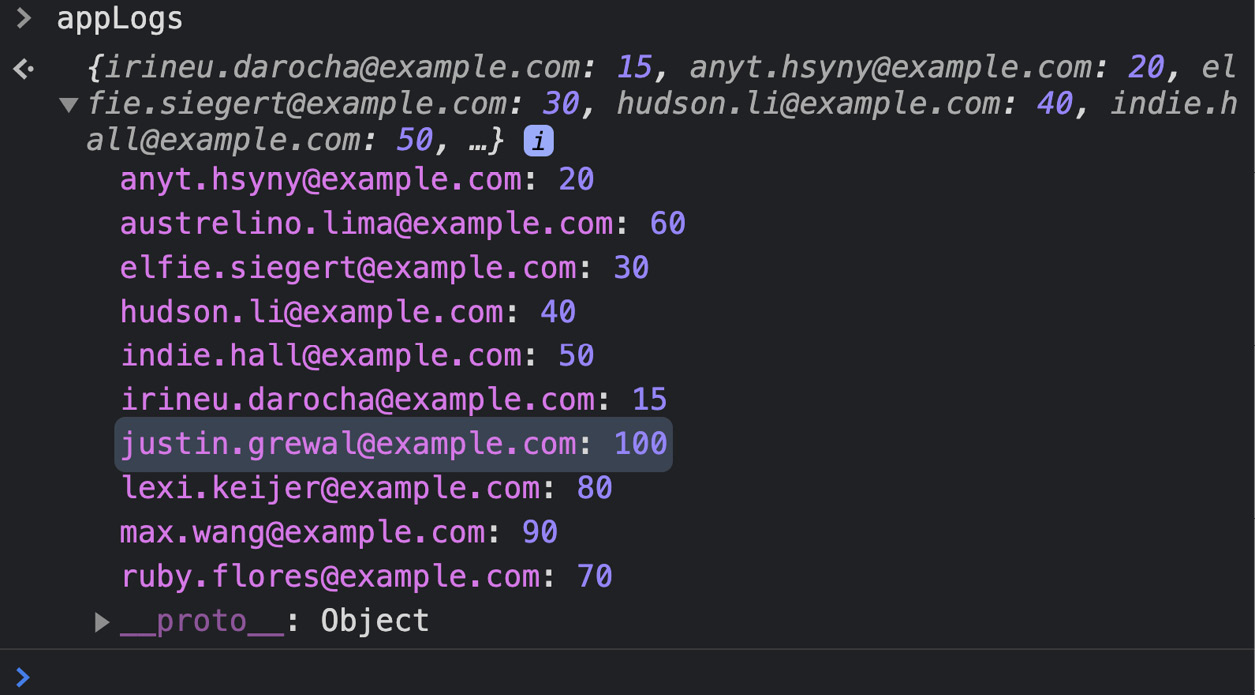
Figure 12.6 – Logs after performing focus and blur three times on the search input
The preceding screenshot shows that the idUsingFactorial() method in the UserCardComponent class for the [email protected] user has been called about 100 times, just in the steps we've performed so far.
- Now, try to search for the elfie user by entering the name quickly in the search box.
You'll notice that the app immediately hangs, and it takes a few seconds to show the user. You'll also notice that you don't even see the letters being typed in the search box as you type them. If you've followed Step 1 and Step 2 correctly, you should see an appLogs object, as follows:
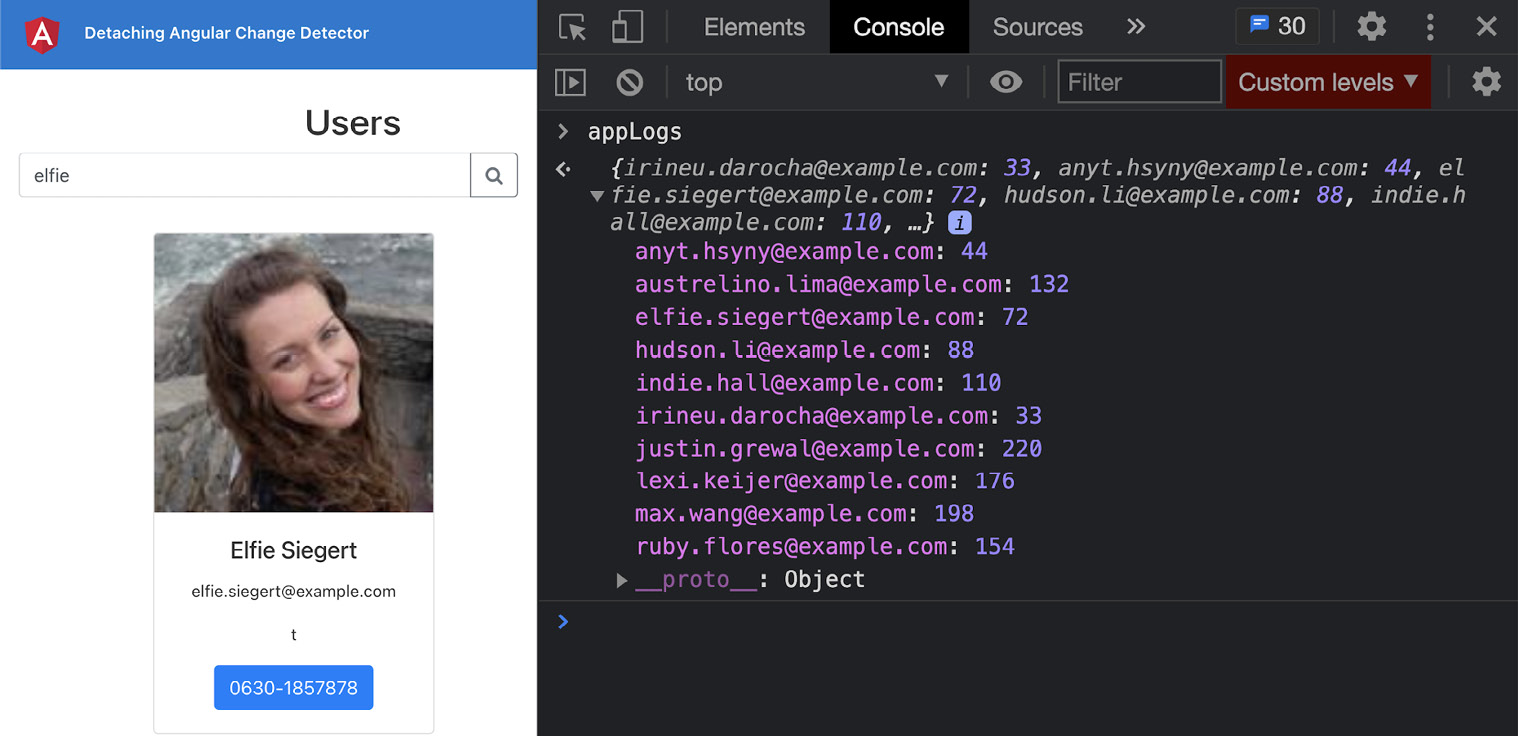
Figure 12.7 – Logs after typing elfie in the input search box
You can see in the preceding screenshot that the idUsingFactorial() method for the [email protected] user has now been called about 220 times.
- In order to improve performance, we'll use the ChangeDetectorRef service in this recipe to completely detach the change detector from the UsersComponent component, which is our top component for the Users page. Update the users.component.ts file, as follows:
import { ChangeDetectorRef, Component, OnInit} from '@angular/core';
...
@Component({...})
export class UsersComponent implements OnInit {
users: IUser[];
constructor(
private userService: UserService,
private cdRef: ChangeDetectorRef
) {}
ngOnInit() {
this.cdRef.detach();
this.searchUsers();
}
}
If you refresh the app now, you'll see… Actually, you won't see anything, and that's fine—we have more steps to follow.
- Now, since we want to run change detection only when we have searched the users—that is, when the users array changes in the UsersComponent class—we can use the detectChanges() method of the ChangeDetectorRef instance. Update the users.component.ts file again, as follows:
...
@Component({...})
export class UsersComponent implements OnInit {
...
searchUsers(searchQuery = '') {
this.userService.searchUsers(
searchQuery).subscribe((users) => {
this.users = users;
this.cdRef.detectChanges();
});
}
...
}
- Now, try performing the actions again—that is, refresh the page, focus in on the input, focus out, focus in, focus out, focus in, focus out, and then type elfie in the search input. Once you've followed the steps, you should see the appLogs object, as follows:
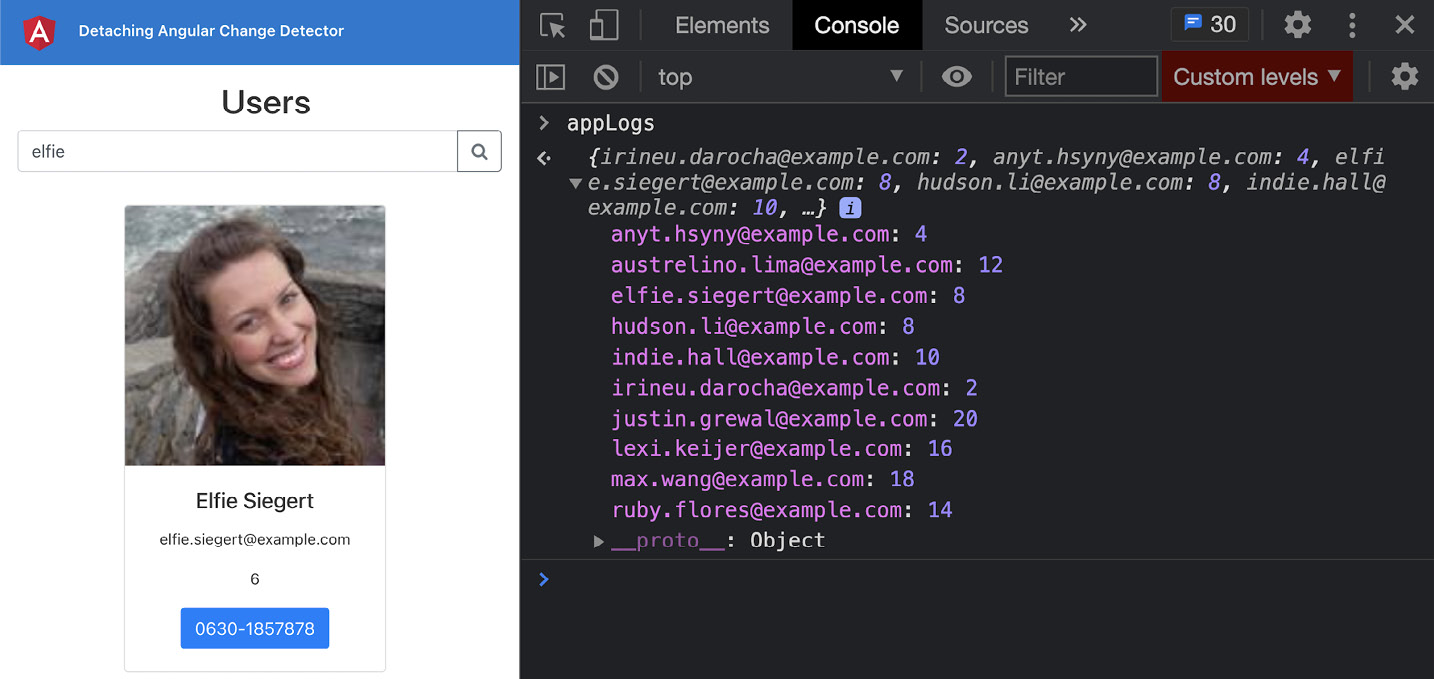
Figure 12.8 – Logs after performing the test steps and using ChangeDetectorRef.detach()
You can see in the preceding screenshot that even after performing all the actions mentioned in Step 1 and Step 2, we have a very low count of the change-detection run cycle.
Awesomesauce! You've just learned how to detach the Angular change detector using the ChangeDetectorRef service. Now that you've finished the recipe, see the next section to understand how it works.
How it works…
The ChangeDetectorRef service provides a bunch of important methods to control change detection completely. In the recipe, we use the .detach() method in the ngOnInit() method of the UsersComponent class to detach the Angular change-detection mechanism from this component as soon as it is created. As a result, no change detection is triggered on the UsersComponent class, nor in any of its children. This is because each Angular component has a change-detection tree in which each component is a node. When we detach a component from the change-detection tree, that component (as a tree node) is detached, and so are its child components (or nodes). By doing this, we end up with absolutely no change detection happening for the UsersComponent class. As a result, when we refresh the page nothing is rendered, even after we've got the users from the application programming interface (API) and have got them assigned to the users property inside the UsersComponent class. Since we need to show the users on the view, which requires the Angular change-detection mechanism to be triggered, we use the .detectChanges() method from the ChangeDetectorRef instance, right after we've assigned the users data to the users property. As a result, Angular runs the change-detection mechanism, and we get the user cards shown on the view.
This means that in the entire Users page (that is, on the /users route) the only time the Angular change-detection mechanism would trigger after the UsersComponent class has initiated is when we call the searchUsers() method, get the data from the API, and assign the result to the users property, thus creating a highly controlled change-detection cycle, resulting in much better performance overall.
See also
- ChangeDetectorRef official documentation (https://angular.io/api/core/ChangeDetectorRef)
Running async events outside Angular with runOutsideAngular
Angular runs its change-detection mechanism on a couple of things, including—but not limited to—all browser events such as keyup, keydown, and so on. It also runs change detection on setTimeout, setInterval, and Ajax HTTP calls. If we had to avoid running change detection on any of these events, we'd have to tell Angular not to trigger change detection on them—for example, if you were using the setTimeout() method in your Angular component, it would trigger an Angular change detection each time its callback method was called. In this recipe, you'll learn how to execute code blocks outside of the ngZone service, using the runOutsideAngular() method.
Getting ready
The project for this recipe resides in Chapter12/start_here/run-outside-angula:
- Open the project in VS Code.
- Open the terminal and run npm install to install the dependencies of the project.
- Run the ng serve -o command to start the Angular app and serve it on the browser. You should see the app, as follows:
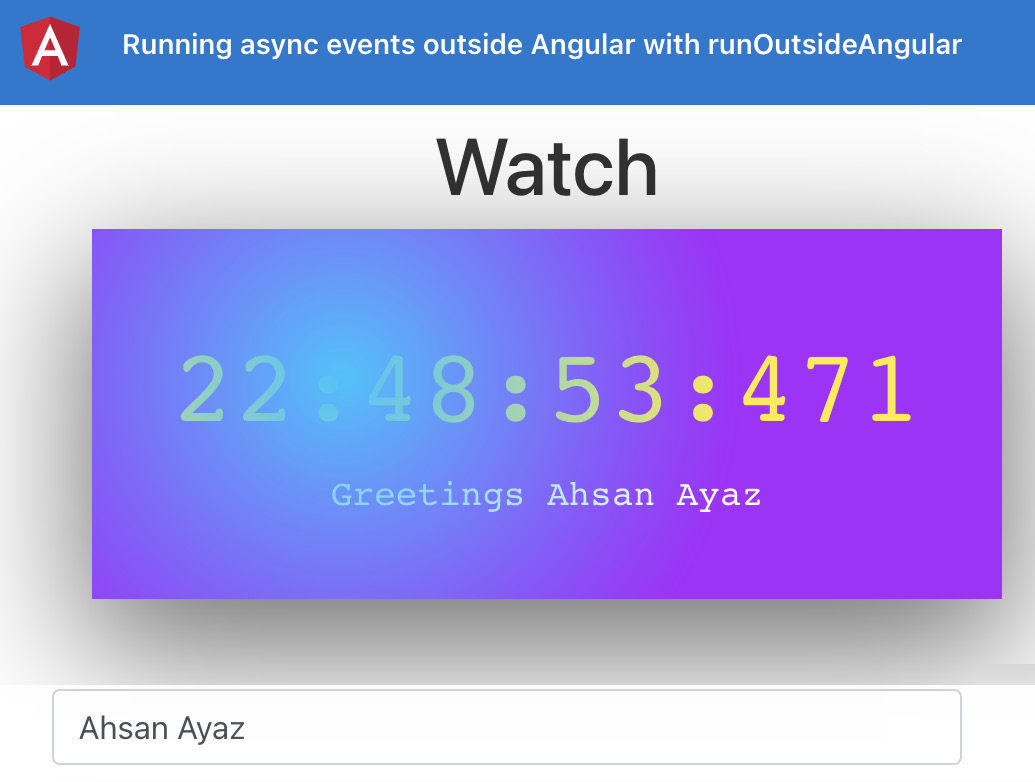
Figure 12.9 – App run-outside-angular running on http://localhost:4200
Now that we have the app running, let's see the steps of the recipe in the next section.
How to do it…
We have an app that shows a watch. However, the change detection right now in the app is not optimal, and we have plenty of room for improvement. We'll try to remove any unnecessary change detection using the runOutsideAngular method from ngZone. Let's get starte:.
- The clock values are constantly updating. Thus, we have change detection running for each update cycle. Open the Chrome DevTools and switch to the Console tab. Type appLogs and press Enter to see how many times change detection has run for the hours, minutes, seconds, and milliseconds components. It should look like this:
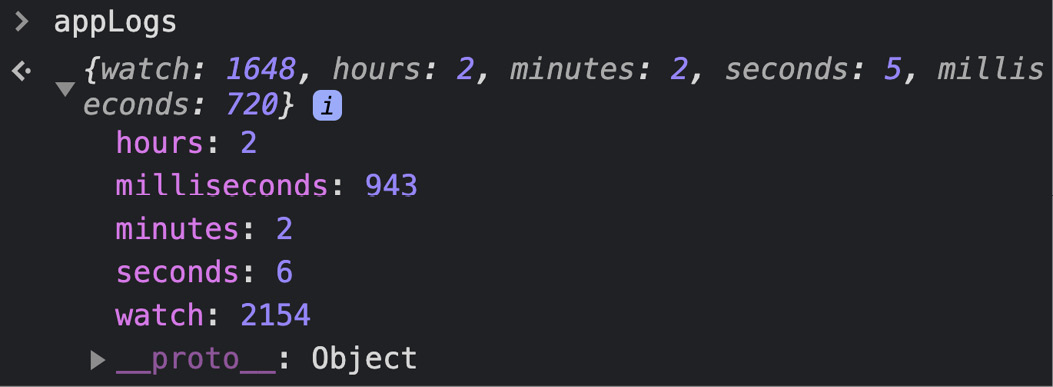
Figure 12.10 – The appLogs object reflecting number of change-detection runs
- To measure performance, we need to see the numbers within a fixed time period. Let's add some code to turn off the interval timer in 4 seconds from the app's start for the clock. Modify the watch-box.component.ts file, as follows:
...
@Component({...})
export class WatchBoxComponent implements OnInit {
...
ngOnInit(): void {
this.intervalTimer = setInterval(() => {
this.timer();
}, 1);
setTimeout(() => {
clearInterval(this.intervalTimer);
}, 4000);
}
...
}
- Refresh the app and wait for 4 seconds for the clock to stop. Then, type appLogs multiple times in the Console tab, press Enter, and see the results. The clock stops but the animation is still running. You should see that change detection for the watch key still increases, as follows:
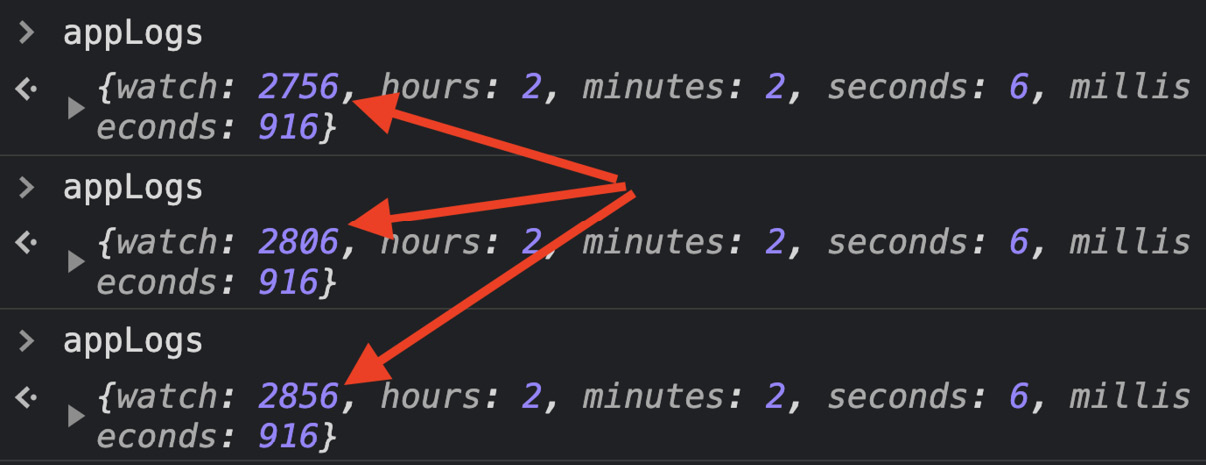
Figure 12.11 – Change detection still running for the watch component
- Let's also stop the animation inside the watch after 4 seconds. Update the watch.component.ts file, as follows:
...
@Component({...})
export class WatchComponent implements OnInit {
...
ngOnInit(): void {
this.intervalTimer = setInterval(() => {
this.animate();
}, 30);
setTimeout(() => {
clearInterval(this.intervalTimer);
}, 4000);
}
...
}
Refresh the app and wait for the animation to stop. Have a look at the appLogs object in the Chrome DevTools. You should see that change detection stops for the watch key, as follows:

Figure 12.12 – Change detection stops after we stop the animation interval
- We want the animation to run but without causing additional change-detection runs. This is because we want to make our app more performant. So, let's just stop the clock for now. To do that, update the watch-box.component.ts file, as follows:
...
@Component({...})
export class WatchBoxComponent implements OnInit {
...
ngOnInit(): void {
// this.intervalTimer = setInterval(() => {
// this.timer();
// }, 1);
// setTimeout(() => {
// clearInterval(this.intervalTimer);
// }, 4000);
}
}
Since we've now stopped the clock, the values for appLogs for the watch key are now only based on the animation for these 4 seconds. You should now see a value between 250 and 260 for the watch key.
- Let's avoid running change detection on the animation by running the interval outside the ngZone service. We'll use the runOutsideAngular() method for this. Update the watch.component.ts file, as follows:
import {
...
ViewChild,
NgZone,
} from '@angular/core';
@Component({...})
export class WatchComponent implements OnInit {
...
constructor(private zone: NgZone) {
...
}
ngOnInit(): void {
this.zone.runOutsideAngular(() => {
this.intervalTimer = setInterval(() => {
this.animate();
}, 30);
setTimeout(() => {
clearInterval(this.intervalTimer);
}, 2500);
});
}
...
}
Refresh the app and wait for about 5 seconds. If you check the appLogs object now, you should see a decrease in the overall number of change-detection runs for each of the properties, as follows:
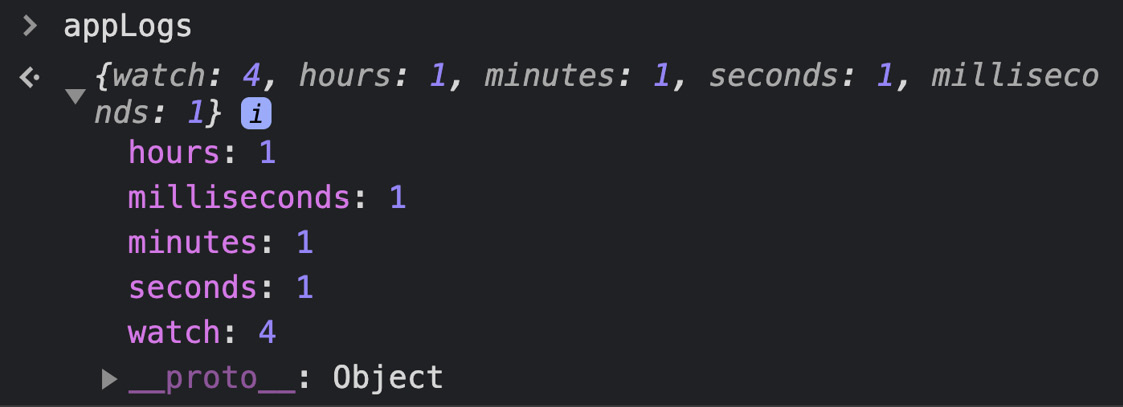
Figure 12.13 – The appLogs object after using runOutsideAngular() in WatchComponent
Yayy! Notice that the value for the watch key in the appLogs object has decreased from about 250 to 4 now. This means that our animation now doesn't contribute to change detection at all.
- Remove the usage of clearInterval() from the animation for the WatchComponent class. As a result, the animation should keep running. Modify the watch.component.ts file, as follows:
...
@Component({...})
export class WatchComponent implements OnInit {
...
ngOnInit(): void {
...
this.ngZone.runOutsideAngular(() => {
this.intervalTimer = setInterval(() => {
this.animate();
}, 30);
setTimeout(() => { // ← Remove this block
clearInterval(this.intervalTimer);
}, 4000);
});
}
...
}
- Finally, remove the usage of clearInterval() from the WatchBoxComponent class to run the clock. Update the watch-box.component.ts file, as follows:
import { Component, OnInit } from '@angular/core';
@Component({
selector: 'app-watch-box',
templateUrl: './watch-box.component.html',
styleUrls: ['./watch-box.component.scss'],
})
export class WatchBoxComponent implements OnInit {
name = '';
time = {
hours: 0,
minutes: 0,
seconds: 0,
milliseconds: 0,
};
intervalTimer;
constructor() {}
ngOnInit(): void {
this.intervalTimer = setInterval(() => {
this.timer();
}, 1);
setTimeout(() => { // ← Remove this
clearInterval(this.intervalTimer);
}, 4000);
}
...
}
Refresh the app and check the value of the appLogs object after a few seconds, multiple times. You should see something like this:
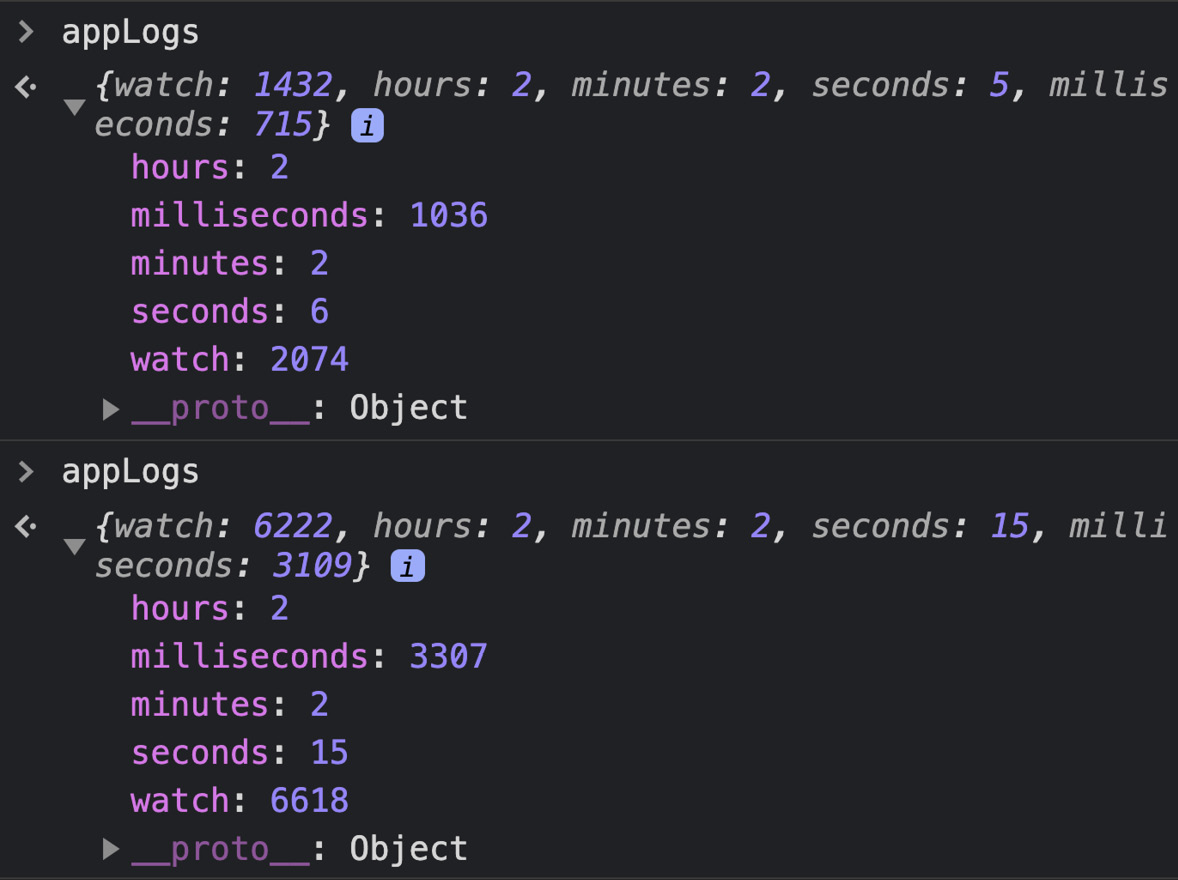
Figure 12.14 – The appLogs object after performance optimization with runOutsideAngular()
Looking at the preceding screenshot, you'd be like: "Ahsan! What is this? We still have a huge number for the change-detection runs for the watch key. How is this performant exactly?" Glad you asked. I will tell you the why in the How it works… section.
- As a final step, stop the Angular server and run the following command to start the server in production mode:
ng serve --prod
- Navigate to https://localhost:4200 again. Wait for a few seconds and then check the appLogs object in the Console tab multiple times. You should see the object, as follows:
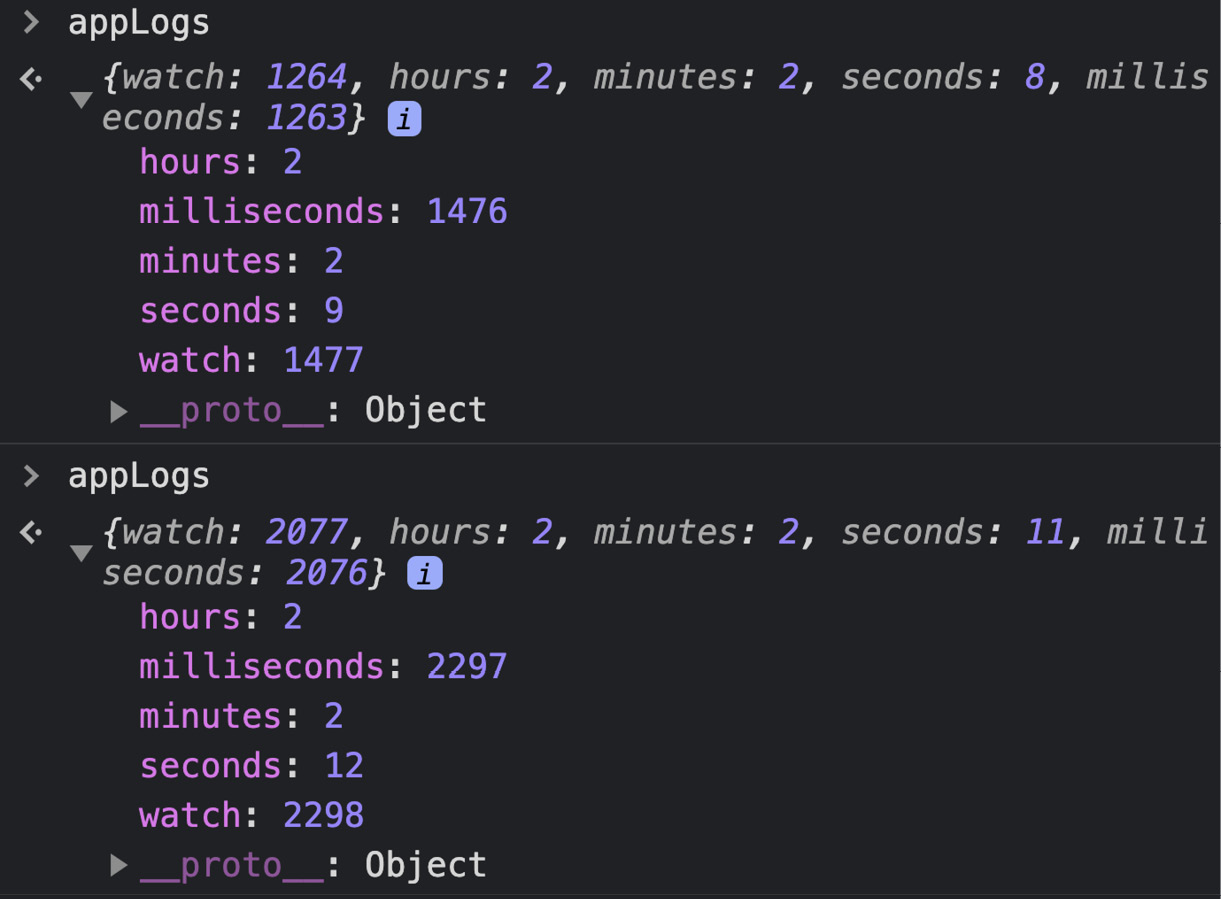
Figure 12.15 – The appLogs object using the production build
Boom! If you look at the preceding screenshot, you should see that the change-detection run count for the watch key is always just one cycle more than the milliseconds key. This means that the WatchComponent class is almost only re-rendered whenever we have the value of the @Input() milliseconds binding updated.
Now that you've finished the recipe, see the next section to understand how it all works.
How it works…
In this recipe, we begin by looking at the appLogs object, which contains some key-value pairs. The value for each key-value pair represents the number of times Angular ran change detection for a particular component. The hours, milliseconds, minutes, and seconds keys represent the WatchTimeComponent instance for each of the values shown on the clock. The watch key represents the WatchComponent instance.
At the beginning of the recipe, we see that the value for the watch key is more than twice the value of the milliseconds key. Why do we care about the milliseconds key at all? Because the @Input() attribute binding milliseconds changes most frequently in our application—that is, it changes every 1 millisecond (ms). The second most frequently changed values are the xCoordinate and yCoordinates properties within the WatchComponent class, which change every 30 ms. The xCoordinate and yCoordinate values aren't bound directly to the template (the HyperText Markup Language (HTML)) because they change the Cascading Style Sheets (CSS) variables of the stopWatch view child. This happens inside the animate() method, as follows:
el.style.setProperty('--x', `${this.xCoordinate}px`);
el.style.setProperty('--y', `${this.yCoordinate}px`);
Thus, changing these values shouldn't actually trigger change detection at all. We begin by limiting the clock window, using the clearInterval() method in the WatchBoxComponent class so that the clock stops within 4 seconds and we can evaluate the numbers. In Figure 12.11, we see that even after the clock stops, the change-detection mechanism keeps triggering for the WatchComponent class. This increases the count for the watch key in the appLogs object as time passes. We then stop the animation by using clearInterval() in the WatchComponent class. This stops the animation after 4 seconds as well. In Figure 12.12, we see that the count for the watch key stops increasing after the animation stops.
We then try to see the count of change detection only based on the animation. In Step 6, we stop the clock. Therefore, we only get a count based on the animation in the appLogs object for the watch key, which is a value between 250 and 260.
We then introduce the magic runOutsideAngular() method into our code. This method is part of the NgZone service. The NgZone service is packaged with the @angular/core package. The runOutsideAngular() method accepts a method as a parameter. This method is executed outside the Angular zone. This means that the setTimeout() and setInterval() methods used inside the runOutsideAngular() method do not trigger the Angular change-detection cycle. You can see in Figure 12.13 that the count drops to 4 after using the runOutsideAngular() method.
We then remove the clearInterval() usage from both the WatchBoxComponent and the WatchComponent classes—that is, to run the clock and the animation again, as we did in the beginning. In Figure 12.14, we see that the count for the watch key is almost twice the value of the milliseconds key. Now, why is that double exactly? This is because in development mode, Angular runs the change-detection mechanism twice. Therefore, in Step 9 and Step 10, we run the application in production mode, and in Figure 12.15, we see that the value for the watch key is just one greater than the value for the milliseconds key, which means that the animation does not trigger any change detection for our application any more. Brilliant, isn't it? If you found this recipe useful, do let me know on my socials.
Now that you understand how it works, see the next section for further reading.
See also
- NgZone official documentation (https://angular.io/api/core/NgZone)
- Angular ChangeDetectorRef official documentation (https://angular.io/api/core/ChangeDetectorRef)
Using trackBy for lists with *ngFor
Lists are an essential part of most of the apps we build today. If you're building an Angular app, there's a great chance you will use the *ngFor directive at some point. We know that *ngFor allows us to loop over arrays or objects generating HTML for each item. However, for large lists, using it may cause performance issues, especially when the source for *ngFor is changed completely. In this recipe, we'll learn how we can improve the performance of lists using the *ngFor directive with the trackBy function. Let's get started.
Getting ready
The project for this recipe resides in Chapter12/start_here/using-ngfor-trackb:
- Open the project in VS Code.
- Open the terminal and run npm install to install the dependencies of the project.
- Run the ng serve -o command to start the Angular app and serve it on the browser. You should see the app, as follows:
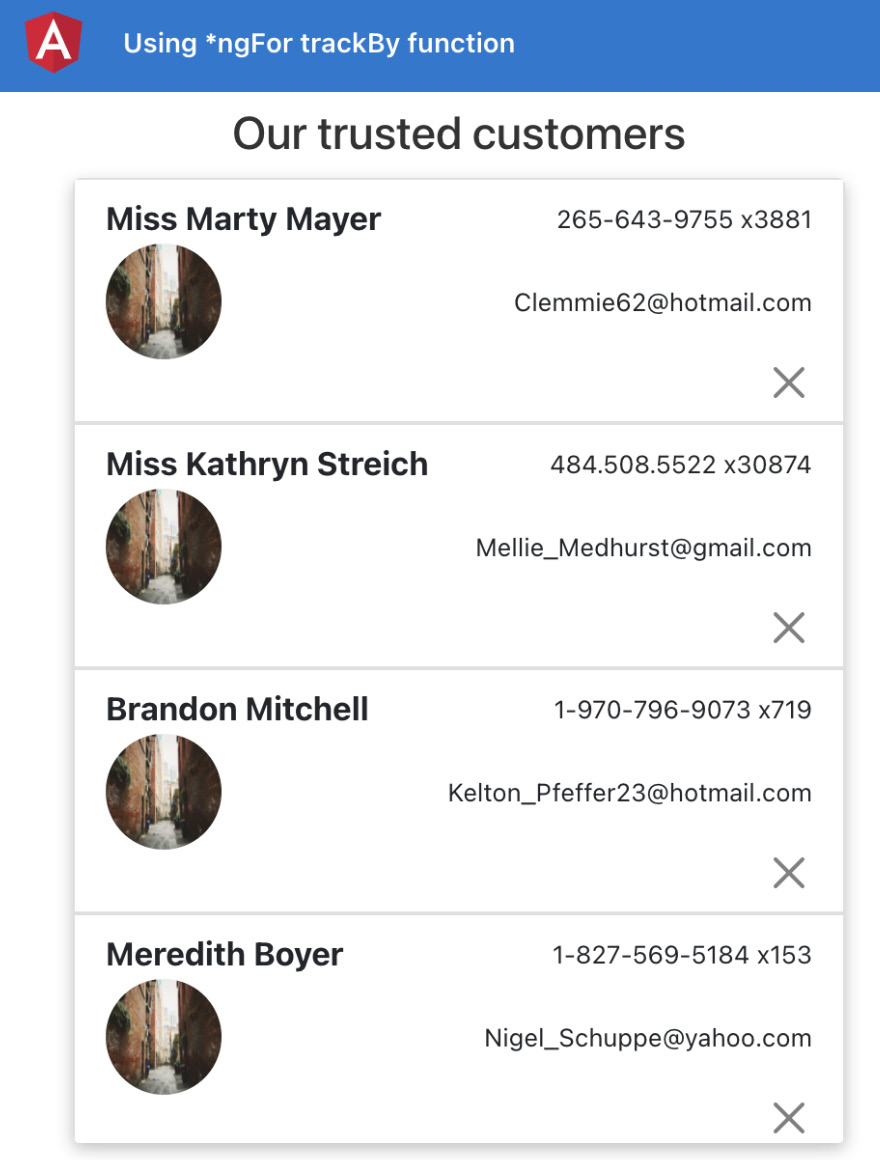
Figure 12.16 – App using-ngfor-trackby running on http://localhost:4200
Now that we have the app running, let's see the steps of the recipe in the next section.
How to do it…
We have an app that has a list of 1,000 users displayed on the view. Since we're not using a virtual scroll and a standard *ngFor list, we do face some performance issues at the moment. Notice that when you refresh the app, even after the loader is hidden, you see a blank white box for about 2-3 seconds before the list appears. Let's start the recipe to reproduce the performance issues and to fix them.
- First of all, open the Chrome DevTools and look at the Console tab. You should see a ListItemComponent initiated message logged 1,000 times. This message will be logged any time a list-item component is created/initiated.
- Now, delete the first item by using the cross button on it. You should see the same message logged again about 999 times now, as shown in the following screenshot. This means we recreate the list-item component for the remaining 999 items:
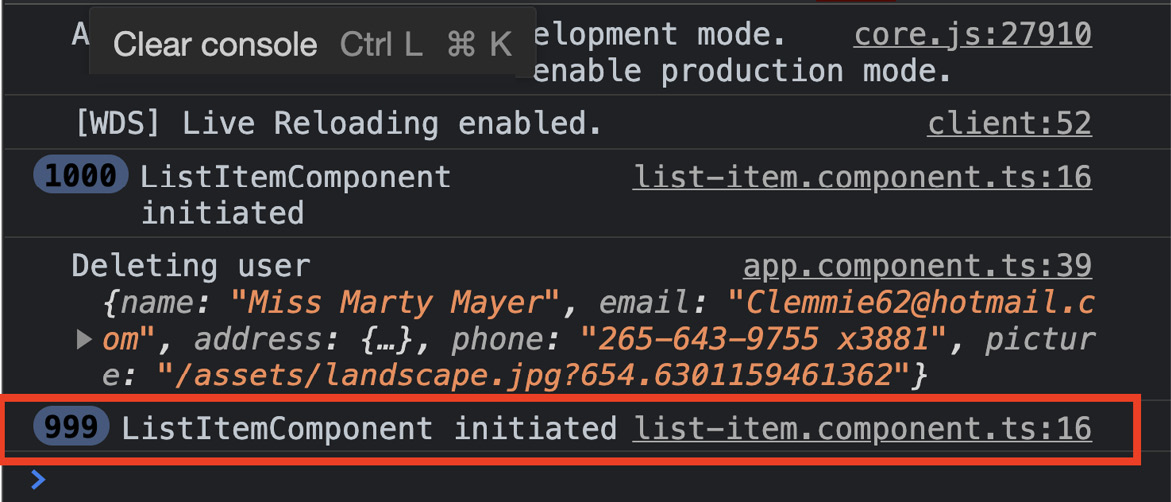
Figure 12.17 – Logs shown again after deleting an item
- Now, refresh the app and tap on the first list item. You should see the ListItemComponent initiated logs again, as shown in the following screenshot. This means we recreate all the list items on an item update. You will notice that the update to the first item's name in the user interface (UI) is reflected in about 2-3 seconds:

Figure 12.18 – Logs shown again after updating an item
- Now, let's fix the performance issue by using the trackBy function. Open the the-amazing-list.component.ts file and update it, as follows:
...
@Component({...})
export class TheAmazingListComponent implements OnInit {
...
ngOnInit(): void {}
trackByFn(_, user: AppUserCard) {
return user.email;
}
}
- Now, update the the-amazing-list.component.html file to use the trackByFn() method we just created, as follows:
<h4 class="heading">Our trusted customers</h4>
<div class="list list-group">
<app-list-item
*ngFor="let item of listItems; trackBy: trackByFn"
[item]="item"
(itemClicked)="itemClicked.emit(item)"
(itemDeleted)="itemDeleted.emit(item)"
>
</app-list-item>
</div>
- Now, refresh the app, and click the first list item to update it. You will notice that the item is updated immediately and we don't log the ListItemComponent initiated message again anymore, as shown in the following screenshot:
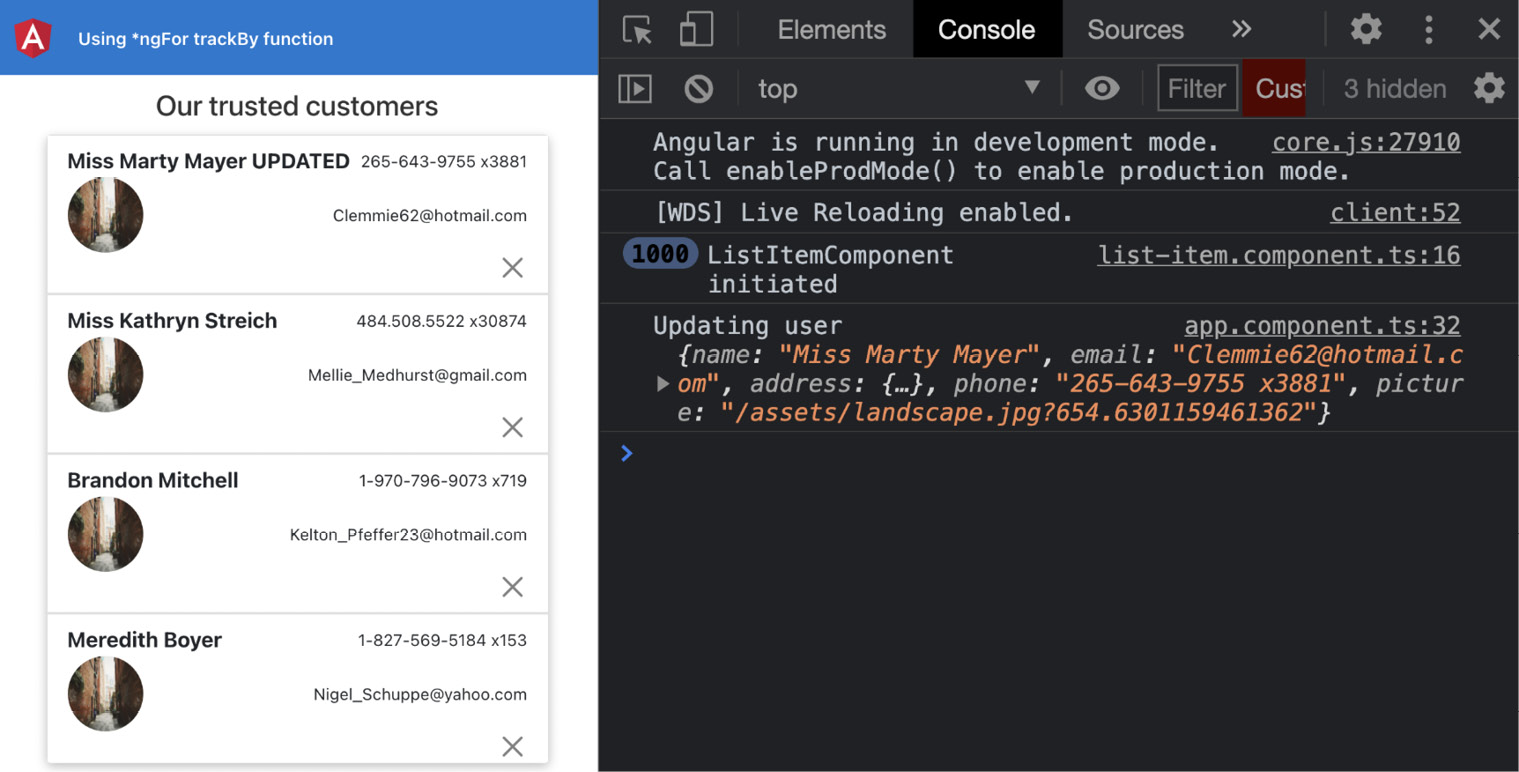
Figure 12.19 – No further logs after updating an item using the trackBy function
- Delete an item as well now, and you will see we do not log the ListItemComponent initiated message again in this case, as well.
Great!! You now know how to use the trackBy function with the *ngFor directive to optimize the performance of lists in Angular. To understand all the magic behind the recipe, see the next section.
How it works…
The *ngFor directive by default assumes that the object itself is its unique identity, which means that if you just change a property in an object used in the *ngFor directive, it won't re-render the template for that object. However, if you provide a new object in its place (different reference in memory), the content for the particular item will re-render. This is what we actually do in this recipe to reproduce the performance-issue content. In the data.service.ts file, we have the following code for the updateUser() method:
updateUser(updatedUser: AppUserCard) {
this.users = this.users.map((user) => {
if (user.email === updatedUser.email) {
return {
...updatedUser,
};
}
// this tells angular that every object has now a different reference
return { ...user };
});
}
Notice that we use the object spread operator ( { … } ) to return a new object for each item in the array. This tells the *ngFor directive to re-render the UI for each item in the listItems array in the TheAmazingListComponent class. Suppose you send a query to the server to find or filter users. The server could return a response that has 100 users. Out of those 100, about 90 were already rendered on the view, and only 10 are different. Angular, however, would re-render the UI for all the list items because of the following potential reasons (but not limited to these):
- The sorting/placement of the users could have changed.
- The length of the users could have changed.
Now, we want to avoid using the object reference as the unique identifier for each list item. For our use case, we know that each user's email is unique, therefore we use the trackBy function to tell Angular to use the user's email as the unique identifier. Now, even if we return a new object for each user after a user update from the updateUser() method (as previously shown), Angular doesn't re-render all the list items. This is because the new objects (users) have the same email and Angular uses it to track them. Pretty cool, right?
Now that you've learned how the recipe works, see the next section to view a link for further reading.
See also
- NgForOf official documentation (https://angular.io/api/common/NgForOf)
Moving heavy computation to pure pipes
In Angular, we have a particular way of writing components. Since Angular is heavily opinionated, we already have a lot of guidelines from the community and the Angular team on what to consider when writing components—for example, making HTTP calls directly from a component is considered a not-so-good practice. Similarly, if we have heavy computation in a component, this is also not considered a good practice. And when the view depends upon a transformed version of the data using a computation constantly, it makes sense to use Angular pipes. In this recipe, you'll learn how to use Angular pure pipes to avoid heavy computation within components.
Getting ready
The project we are going to work with resides in Chapter12/start_here/using-pure-pipes, inside the cloned repositor:
- Open the project in VS Code.
- Open the terminal and run npm install to install the dependencies of the project.
- Run the ng serve -o command to start the Angular app and serve it on the browser. You should see the app, as follows:
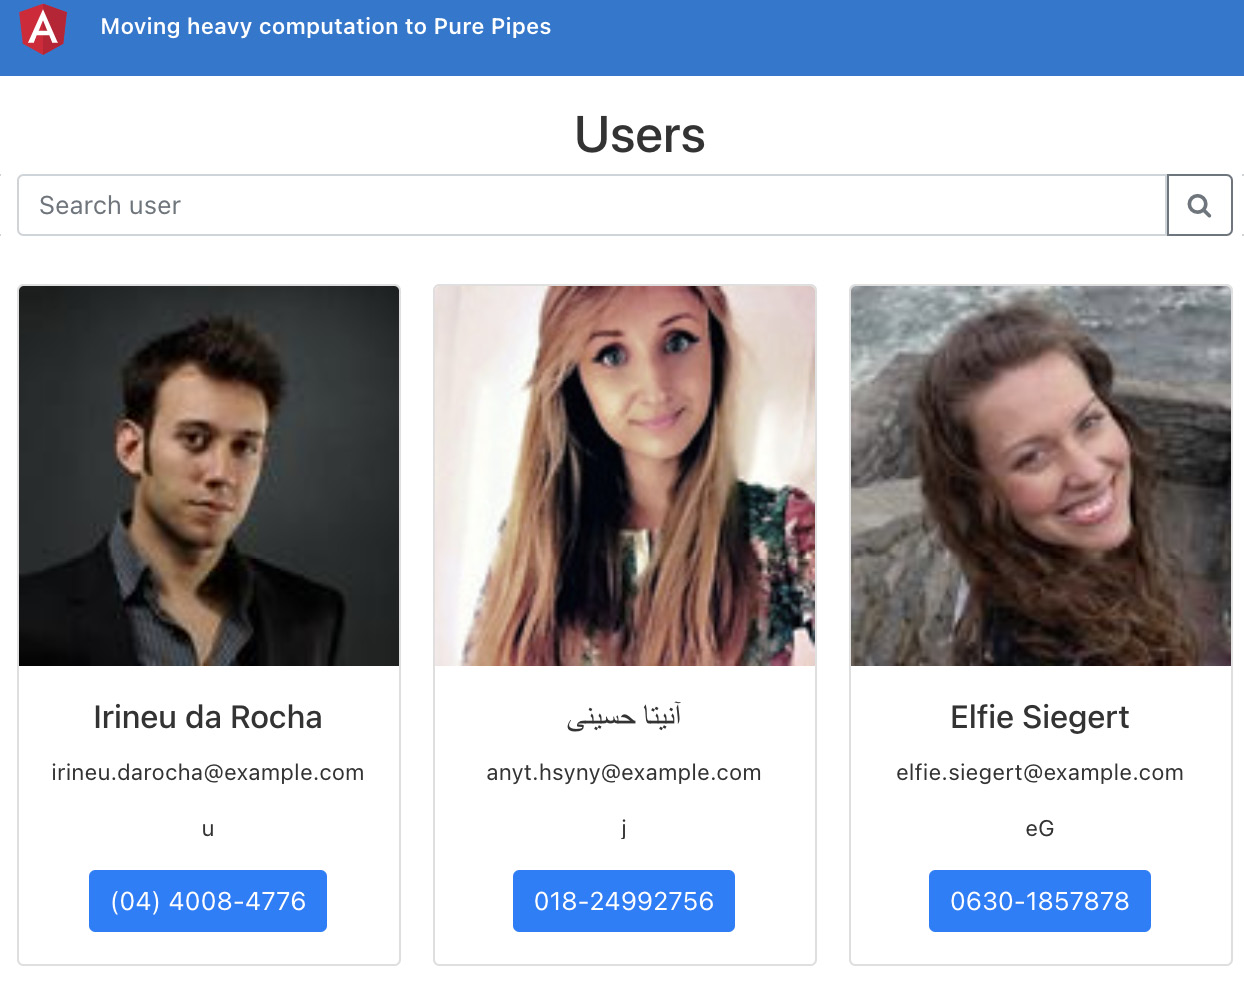
Figure 12.20 – using-pure-pipes app running at http://localhost:4200
Now that we have the project served on the browser, let's see the steps of the recipe in the next section.
How to do it…
The app we're working with has some performance issues, particularly with the UserCardComponent class because it uses the idUsingFactorial() method to generate a unique ID to show on the card. You'll notice that if you try typing 'irin' in the search box, the app hangs for a while. We're not able to see the letters being typed instantly in the search box, and it takes a while before the results show. We will fix the issues by moving the computation in the idUsingFactorial() method to an Angular (pure) pipe. Let's get starte:
- Let's create an Angular pipe. We'll move the computation for generating a unique ID for this pipe to later code. In the project root, run the following command in the terminal:
ng g pipe core/pipes/unique-id
- Now, copy the code for the createUniqueId() method from the user-card.component.ts file and paste it into the unique-id.pipe.ts file. We'll also modify the code a bit, so it should now look like this:
...
@Pipe({...})
export class UniqueIdPipe implements PipeTransform {
characters = 'ABCDEFGHIJKLMNOPQRSTUVWXYZabcdef ghijklmnopqrstuvwxyz0123456789';
createUniqueId(length) {
var result = '';
const charactersLength = this.characters.length;
for (let i = 0; i < length; i++) {
result += this.characters.charAt(
Math.floor(Math.random() * charactersLength)
);
}
return result;
}
...
transform(index: unknown, ...args: unknown[]): unknown {
return null;
}
}
- Now, also copy the idUsingFactorial() method from the user-card.component.ts file to the unique-id.pipe.ts file and update the file, as follows:
import { Pipe, PipeTransform } from '@angular/core';
@Pipe({
name: 'uniqueId',
})
export class UniqueIdPipe implements PipeTransform {
...
idUsingFactorial(num, length = 1) {
if (num === 1) {
return this.createUniqueId(length);
} else {
const fact = length * (num - 1);
return this.idUsingFactorial(num - 1, fact);
}
}
transform(index: number): string {
return this.idUsingFactorial(index);
}
}
- Now, update the user-card.component.html file to use the uniqueId pipe instead of the component's method. The code should look like this:
<div class="user-card">
<div class="card" *ngIf="user" (click)="cardClicked()">
<img [src]="user.picture.large" class="card-img-top" alt="..." />
<div class="card-body">
<h5 class="card-title">{{ user.name.first }} {{ user.name.last }}</h5>
<p class="card-text">{{ user.email }}</p>
<p class="card-text unique-id" title="{{ index | uniqueId }}">
{{ index | uniqueId }}
</p>
<a href="tel: {{ user.phone }}" class="btn btn-primary">{{
user.phone
}}</a>
</div>
</div>
</div>
- Now, refresh the app and type the name Elfie Siegert in the search box. Notice that the UI is not blocked. We're able to see the typed letters immediately as we type them, and the search results are faster as well.
Boom! Now that you know how to optimize performance by moving heavy computation to pure Angular pipes, see the next section to understand how this works.
How it works…
As we know, Angular by default runs change detection on each browser event triggered in the app, and since we're using an idUsingFactorial() method in the component template (UI), this function runs each time Angular runs the change-detection mechanism, causing more computation and performance issues. This would also hold true if we used a getter instead of a method. Here, we use a method because each unique ID is dependent on the index and we need to pass the index in the method when calling it.
We can take a step back from the initial implementation and think what the method actually does. It takes an input, does some computation, and returns a value based on the input—a classic example of data transformation, and also an example of where you would use a pure function. Luckily, Angular pure pipes are pure functions, and they do trigger change detection unless the input changes.
In the recipe, we move the computation to a newly created Angular pipe. The pipe's transform() method receives the value to which we're applying the pipe, which is the index of each user card in the users array. The pipe then uses the idUsingFactorial() method and, ultimately, the createUniqueId() method to calculate a random unique ID. When we start typing in the search box, the values for the index do not change. This results in no change detection being triggered until we get back a new set of users as output. Therefore, there is no unnecessary computation run as we type the input into the search box, thus optimizing performance and unblocking the UI thread.
See also
- Angular pure and impure pipes official documentation (https://angular.io/guide/pipes#pure-and-impure-pipes)
Using web workers for heavy computation
If your Angular application does a lot of computation during an action, there's a great chance that it will block the UI thread. This will cause a lag in rendering the UI because it blocks the main JavaScript thread. Web workers allow us to run heavy computation in the background thread, thus freeing the UI thread as it is not blocked. In this recipe, we're going to use an application that does a heavy computation in the UserService class. It creates a unique ID for each user card and saves it into the localStorage. However, it loops a couple of thousand times before doing so, which causes our application to hang for a while. In this recipe, we'll move the heavy computation from the components to a web worker and will also add a fallback in case web workers aren't available.
Getting ready
The project we are going to work with resides in Chapter12/start_here/using-web-workers, inside the cloned repositor:
- Open the project in VS Code.
- Open the terminal and run npm install to install the dependencies of the project.
- Run the ng serve -o command to start the Angular app and serve it on the browser. You should see the app, as follows:

Figure 12.21 – App using-web-workers running at http://localhost:4200
Now that we have the app running, let's see the steps of the recipe in the next section.
How to do it…
Once you open the app, you'll notice that it takes some time before the user cards are rendered. This shows that the UI thread is blocked until we have the computation finished. The culprit is the saveUserUniqueIdsToStorage() method in the UserService class. This generates a unique ID a couple of thousands of times before saving it to the localStorage. Let's start the recipe, to improve the performance of the app. We'll start by implementing the web worke:
- We'll first create a web worker. Run the following command in the project root:
ng generate web-worker core/workers/idGenerator
- Now, copy the for loop from the saveUserUniqueIdsToStorage() method in the UserService class to the newly created id-generator.worker.ts file. The code should look like this:
/// <reference lib="webworker" />
import createUniqueId from '../constants/create-unique-id';
addEventListener('message', ({ data }) => {
console.log('message received IN worker', data);
const { index, email } = data;
let uniqueId;
for (let i = 0, len = (index + 1) * 100000; i < len; ++i) {
uniqueId = createUniqueId(50);
}
postMessage({ uniqueId, email });
});
- Now that we have the worker file created, let's create a single instance of a worker to use it in the next steps. Create a new file in the constants folder. Name it get-unique-id-worker.ts and add the following code inside the file:
let UNIQUE_ID_WORKER: Worker = null;
const getUniqueIdWorker = (): Worker => {
if (typeof Worker !== 'undefined' && UNIQUE_ID_WORKER === null) {
UNIQUE_ID_WORKER = new Worker('../workers/ id-generator.worker', {
type: 'module',
});
}
return UNIQUE_ID_WORKER;
};
export default getUniqueIdWorker;
- Now, we'll use the worker in the user.service.ts file. Update it, as follows:
...
import getUniqueIdWorker from '../constants/get-unique-id-worker';
@Injectable({...})
export class UserService {
...
worker: Worker = getUniqueIdWorker();
constructor(private http: HttpClient) {
this.worker.onmessage = ({ data: { uniqueId, email } }) => {
console.log('received message from worker', uniqueId, email);
const user = this.usersCache.find((user) => user. email === email);
localStorage.setItem(
`ng_user__${user.email}`,
JSON.stringify({
...user,
uniqueId,
})
);
};
}
...
}
- We'll update the file again to modify the saveUserUniqueIdsToStorage() method. We'll use the worker instead of using the existing code, if we have web workers available in the environment. Update the user.service.ts file, as follows:
...
@Injectable({...})
export class UserService {
...
saveUserUniqueIdsToStorage(user: IUser, index) {
let uniqueId;
const worker: Worker = getUniqueIdWorker();
if (worker !== null) {
worker.postMessage({ index, email: user.email });
} else {
// fallback
for(let i = 0, len = (index + 1) * 100000; i<len; ++i) {
uniqueId = createUniqueId(50);
}
localStorage.setItem(...);
}
}
...
}
- Refresh the app and notice how long it takes for the user cards to render. They should appear much faster than before. Also, you should be able to see the following logs reflecting the communication from the app to the web worker, and vice versa:
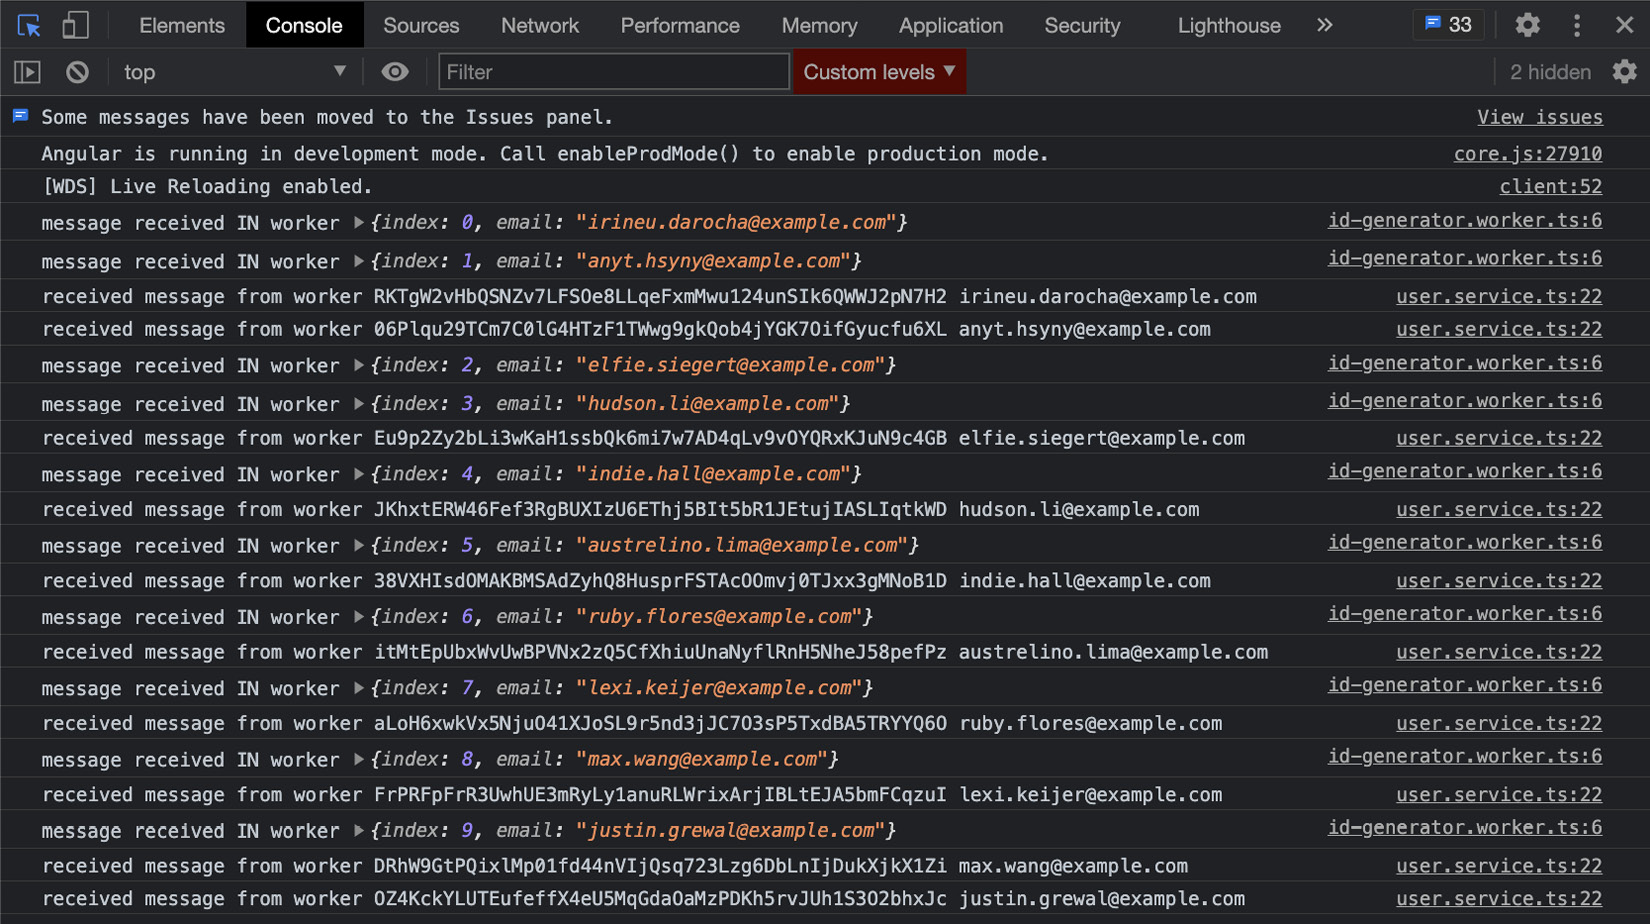
Figure 12.22 – Logs showing messages to and from the app to web workers
Woohoo!!! The power of web workers! And now you know how to use web workers in an Angular app to move heavy computation to them. Since you've finished the recipe, see the next section on how this works.
How it works…
As we discussed in the recipe's description, web workers allow us to run and execute code in a separate thread from the main JavaScript (or UI thread). At the beginning of the recipe, whenever we refresh the app or search for a user, it blocks the UI thread. This is until a unique ID is generated for each card. We begin the recipe by creating a web worker using the Angular command-line interface (CLI). This creates an id-generator.worker.ts file, which contains some boilerplate code to receive messages from the UI thread and to send a message back to it as a response. The CLI command also updates the angular.json file by adding a webWorkerTsConfig property. The value against the webWorkerTsConfig property is the path to the tsconfig.worker.json file, and the CLI command also creates this tsconfig.worker.json file. If you open the tsconfig.worker.json file, you should see the following code:
/* To learn more about this file see: https://angular.io/config/tsconfig. */
{
"extends": "./tsconfig.json",
"compilerOptions": {
"outDir": "./out-tsc/worker",
"lib": [
"es2018",
"webworker"
],
"types": []
},
"include": [
"src/**/*.worker.ts"
]
}
After creating a web worker file, we create another file named uniqueIdWorker.ts. This file exports the getUniqueIdWorker() method as the default export. When we call this method, it generates a new Worker instance if we don't have a worker generated already. The method uses the id-generator.worker.ts file to generate a worker. We also use the addEventListener() method inside the worker file to listen to the messages sent from the UI thread (that is, the UserService class). We receive the index of the user card and the email of the user as the data in this message. We then use a for loop to generate a unique ID (uniqueId variable), and once the loop ends, we use the postMessage() method to send the uniqueId variable and the email back to the UI thread.
Now, in the UserService class, we listen to messages from the worker. In the constructor() method, we check if web workers are available in the environment by checking the value from the getUniqueIdWorker() method, which should be a non-null value. Then, we use the worker.onmessage property to assign it a method. This is to listen to the messages from the worker. Since we already know that we get the uniqueId variable and the email from the worker, we use the email to get the appropriate user from the usersCache variable. Then, we store the user data with the uniqueId variable to the localStorage against the user's email.
Finally, we update the saveUserUniqueIdsToStorage() method to use the worker instance if it is available. Notice that we use the worker.postMessage() method to pass the index and the email of the user. Note also that we are using the previous code as a fallback for cases where we don't have web workers enabled.
See also
- Angular official documentation on web workers (https://angular.io/guide/web-worker)
- MDN web worker documentation (https://developer.mozilla.org/en-US/docs/Web/API/Worker)
Using performance budgets for auditing
In today's world, most of the population has a pretty good internet connection to use everyday applications, be it a mobile app or a web app, and it is fascinating how much data we ship to our end users as a business. The amount of JavaScript shipped to users has an ever-increasing trend now, and if you're working on a web app, you might want to use performance budgets to make sure the bundle size doesn't exceed a certain limit. With Angular apps, setting the budget sizes is a breeze. In this recipe, you're going to learn how to use the Angular CLI to set up budgets for your Angular apps.
Getting ready
The project for this recipe resides in Chapter12/start_here/angular-performance-budget:
- Open the project in VS Code.
- Open the terminal and run npm install to install the dependencies of the project.
- Run the ng build --configuration production command to build the Angular app in production mode. Notice the output on the console. It should look like this:
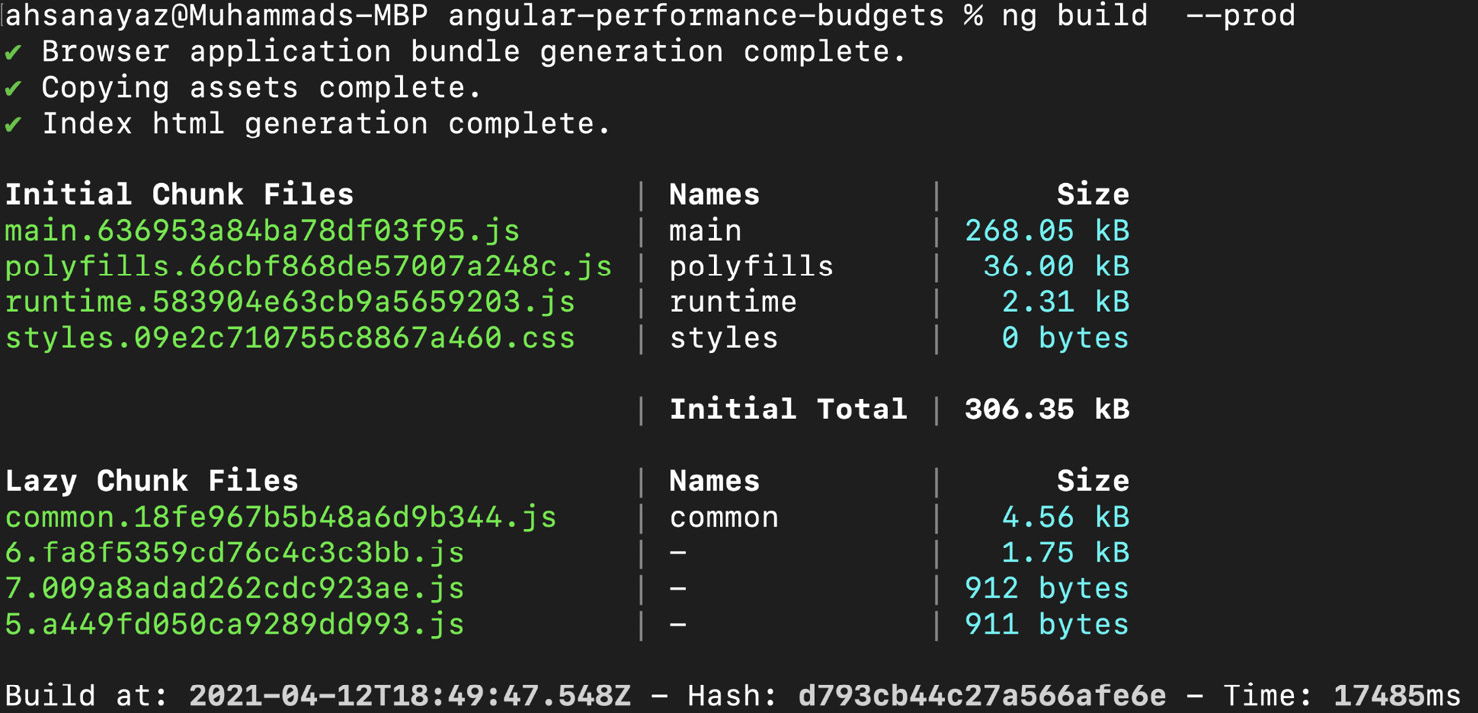
Figure 12.23 – Build output for production mode, without performance budgets
Notice that the bundle size for the main.*.js file is about 260 kilobytes (KB) at the moment. Now that we have built the app, let's see the steps of the recipe in the next section.
How to do it…
We have an app that is really small in terms of bundle size at the moment. However, this could grow into a huge app with upcoming business requirements. For the sake of this recipe, we'll increase the bundle size deliberately and will then use performance budgets to stop the Angular CLI from building the app for production if the bundle size exceeds the budget. Let's begin the recip:
- Open the app.component.ts file and update it, as follows:
...
import * as moment from '../lib/moment';
import * as THREE from 'three';
@Component({...})
export class AppComponent {
...
constructor(private auth: AuthService, private router: Router) {
const scene = new THREE.Scene();
console.log(moment().format('MMM Do YYYY'));
}
...
}
- Now, build the app again for production using the ng build --configuration production command. You should see that the bundle size for the main.*.js file is now 1.12 megabytes (MB). This is a huge increase in size compared to the original 268.05 KB, as you can see in the following screenshot:
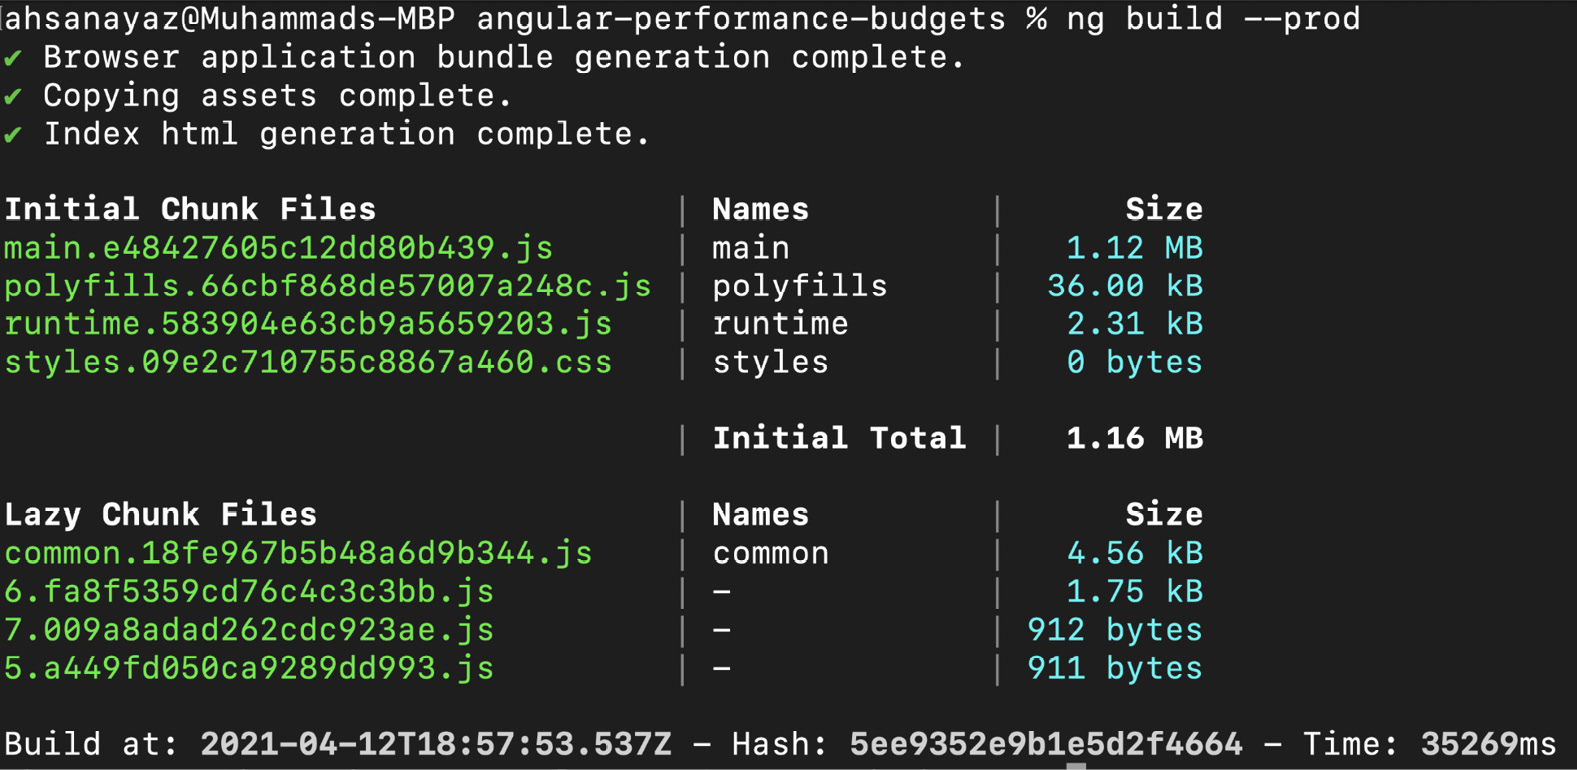
Figure 12.24 – The bundle size for main.*.js increased to 1.11 MB
Let's suppose our business requires us to not ship apps with main bundle sizes more than 1.0 MB. For this, we can configure our Angular app to throw an error if the threshold is met.
- Refresh the app, open the angular.json file, and update it. The property that we're targeting is projects.angular-performance-budgets.architect.build.configurations.production.budgets. The file should look like this:
...
{
"budgets": [
{
"type": "initial",
"maximumWarning": "800kb",
"maximumError": "1mb"
},
{
"type": "anyComponentStyle",
"maximumWarning": "6kb",
"maximumError": "10kb"
}
]
}
...
- Now that we have the budgets in place, let's build the app once again using the ng build --configuration production command. The build should fail and you should see both a warning and an error on the console, as follows:
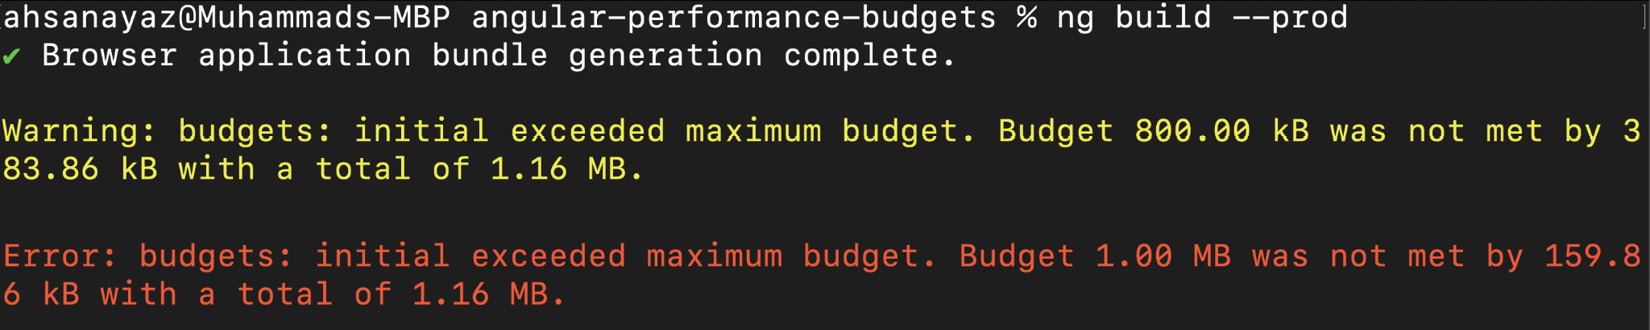
Figure 12.25 – Angular CLI throwing errors and warnings based on performance budgets
- Let's improve our application by not importing the entire libraries in the app.component.ts file, and use the date-fns package instead of moment.js to do the same thing. Run the following command to install the date-fns package:
npm install --save date-fns
- Now, update the app.component.ts file, as follows:
import { Component } from '@angular/core';
import { Router } from '@angular/router';
import { AuthService } from './services/auth.service';
import { format } from 'date-fns';
import { Scene } from 'three';
@Component({...})
export class AppComponent {
...
constructor(private auth: AuthService, private router: Router) {
console.log(format(new Date(), 'LLL do yyyy'));
const scene = new Scene();
}
...
}
- Run the ng build --configuration production command again. You should see a decreased bundle size, as follows:
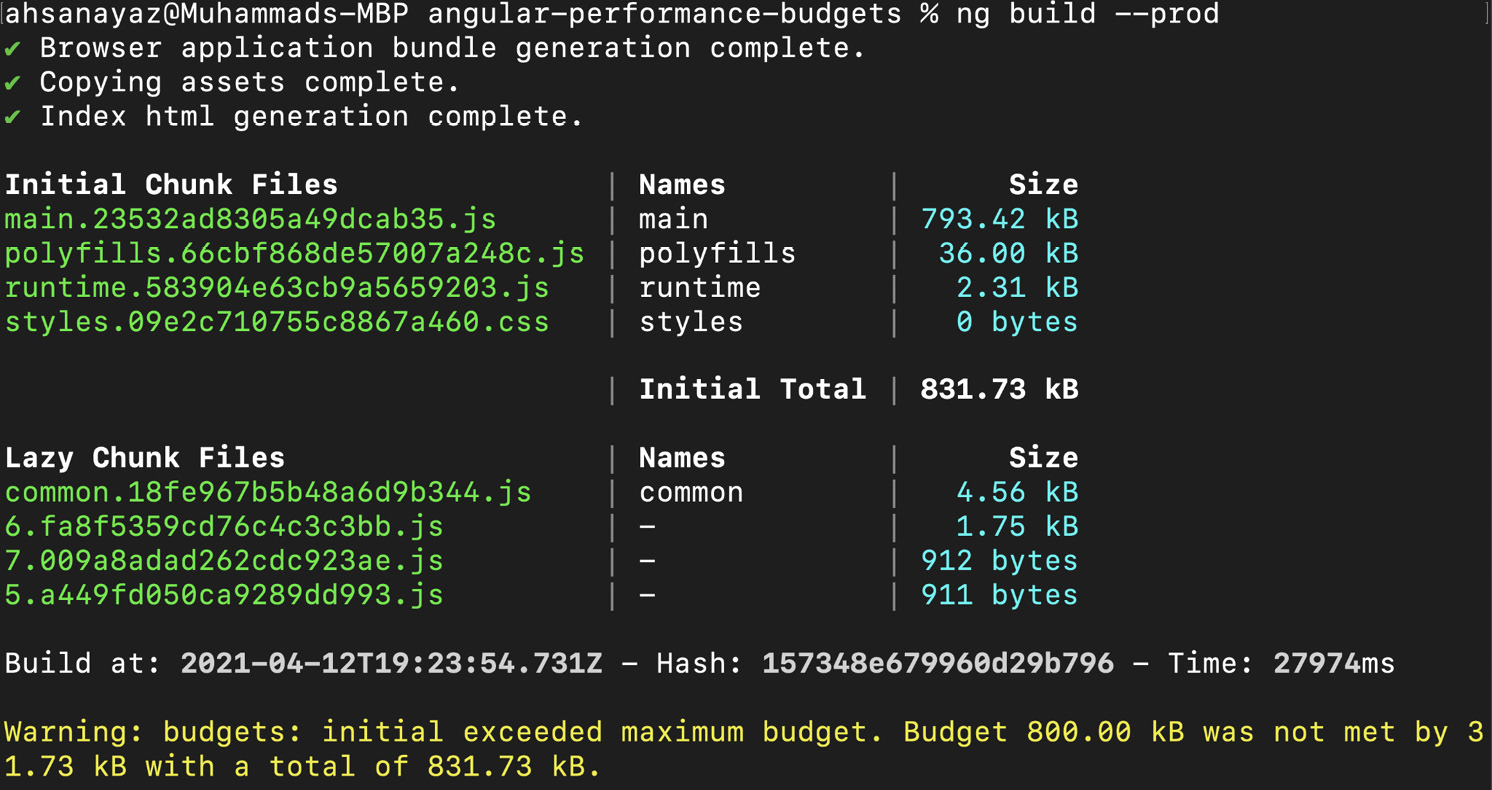
Figure 12.26 – Reduced bundle size after using date-fns and optimized imports
Boom!! You just learned how to use the Angular CLI to define performance budgets. These budgets can be used to throw warnings and errors based on your configuration. Note that the budgets can be modified based on changing business requirements. However, as engineers, we have to be cautious about what we set as performance budgets to not ship JavaScript over a certain limit to the end users.
See also
- Performance budgets with the Angular CLI official documentation (https://web.dev/performance-budgets-with-the-angular-cli/)
Analyzing bundles with webpack-bundle-analyzer
In the previous recipe, we looked at configuring budgets for our Angular app, and this is useful because you get to know when the overall bundle size exceeds a certain threshold, although you don't get to know how much each part of the code is actually contributing to the final bundles. This is what we call analyzing the bundles, and in this recipe, you will learn how to use webpack-bundle-analyzer to audit the bundle sizes and the factors contributing to them.
Getting ready
The project we are going to work with resides in Chapter12/start_here/using-webpack-bundle-analyzer, inside the cloned repositor:
- Open the project in VS Code.
- Open the terminal and run npm install to install the dependencies of the project.
- Run the ng serve -o command to start the Angular app and serve it on the browser. You should see the app, as follows:
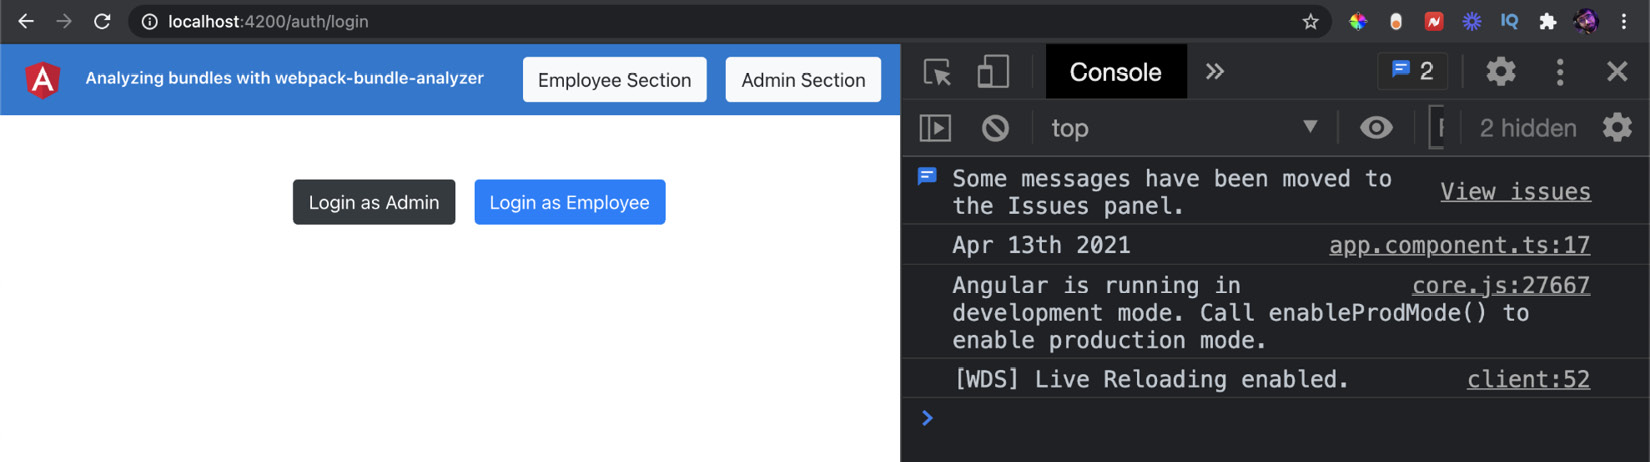
Figure 12.27 – App using-webpack-bundle-analyzer running at http://localhost:4200
- Now, build the app using the ng build --configuration production command to build the Angular app in production mode. You should see the following output:
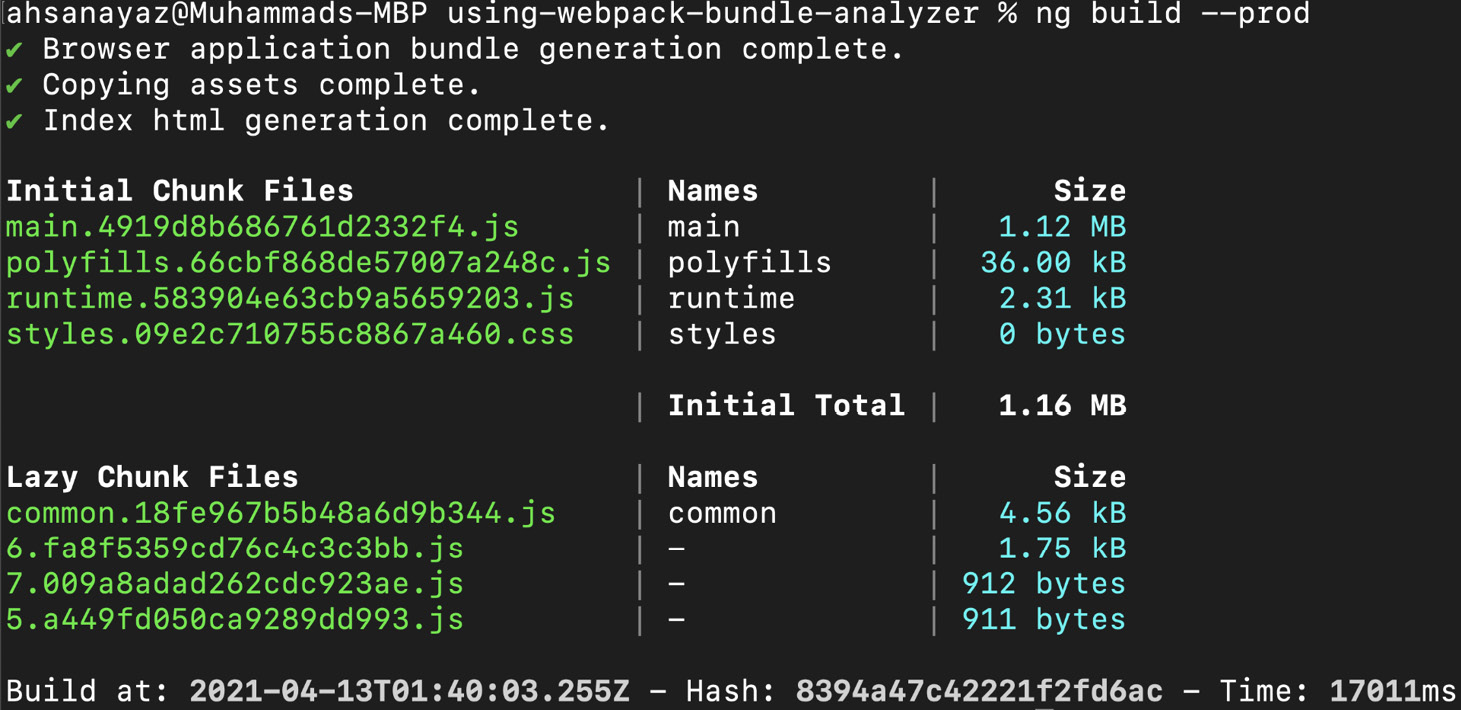
Figure 12.28 – The main bundle, having a size of 1.11 MB
Now that we have built the app, let's see the steps of the recipe in the next section.
How to do it…
As you may have noticed, we have a main bundle of size 1.12 MB. This is because we are using the Three.js library and the moment.js library in our app.component.ts file, which imports those libraries, and they end up being in the main bundle. Let's start the recipe to analyze the factors for the bundle size visuall:
- We'll first install the webpack-bundle-analyzer package. Run the following command in the project root:
npm install --save-dev webpack-bundle-analyzer
- Now, create a script in the package.json file. We'll use this script in the next steps to analyze our final bundles. Update the package.json file, as follows:
{
...
"scripts": {
"ng": "ng",
"start": "ng serve",
"build": "ng build",
"test": "ng test",
"lint": "ng lint",
"e2e": "ng e2e",
"analyze-bundle": "webpack-bundle-analyzer dist/using-webpack-bundle-analyzer/stats.json"
},
"private": true,
"dependencies": {... },
"devDependencies": {...}
}
- Now, build the production bundle again, but with an argument to generate a stats.json file as well. Run the following command from the project root:
ng build --configuration production --stats-json
- Now, run the analyze-bundle script to use the webpack-bundle-analyzer package. Run the following command from the project root:
npm run analyze-bundle
This will spin up a server with the bundle analysis. You should see a new tab opened in your default browser, and it should look like this:

Figure 12.29 – Bundle analysis using webpack-bundle-analyzer
- Notice that the lib folder takes a huge portion of the bundle size—648.29 KB, to be exact, which you can check by just doing a mouseover on the lib box. Let's try to optimize the bundle size. Let's install the date-fns package so that we can use it instead of moment.js. Run the following command from your project root:
npm install --save date-fns
- Now, update the app.component.ts file to use the date-fns package's format() method instead of using the moment().format() method. We'll also just import the Scene class from the Three.js package instead of importing the whole library. The code should look like this:
import { Component } from '@angular/core';
import { Router } from '@angular/router';
import { AuthService } from './services/auth.service';
import { format } from 'date-fns';
import { Scene } from 'three';
@Component({...})
export class AppComponent {
...
constructor(private auth: AuthService, private router: Router) {
const scene = new Scene();
console.log(format(new Date(), 'LLL do yyyy'));
}
...
}
- Run the ng build --configuration production --stats-json command, and then run npm run analyze-bundle.
Once webpack-bundle-analyzer runs you should see the analysis, as shown in the following screenshot. Notice that we don't have the moment.js file or the lib block anymore, and the overall bundle size has reduced from 1.15 MB to 831.44 KB:

Figure 12.30 – Bundle analysis after using date-fns instead of moment.js
Woohoo!!! You now know how to use the webpack-bundle-analyzer package to audit bundle sizes in Angular applications. This is a great way of improving overall performance, because you can identify the chunks causing the increase in the bundle size and then optimize the bundles.
See also
- Getting started with webpack (https://webpack.js.org/guides/getting-started/)
- webpack-bundle-analyzer—GitHub repository (https://github.com/webpack-contrib/webpack-bundle-analyzer)