Previous chapters describe how to create and use data sources and data sets and lay out and format report items. A single report developer with a requirement for only a few reports can use these approaches effectively. For a larger project, either one with more developers or one that requires more reports, many designs need to use the same elements or layouts. In these cases, manual techniques are cumbersome. Developing the same components repeatedly wastes time and is prone to errors. Even if you use the copy-and-paste features of BIRT Report Designer, a report design does not provide convenient access to standard elements and layouts.
BIRT provides the following solutions for designing reports that must conform to standards, including using common design elements and data sources:
A library
This type of file stores customized report features, such as data sources, data sets, visual report items, styles, and master pages. Use a library in a report design to access the customized report elements. You can use multiple libraries in a single report design. By using multiple libraries, you can separate the styles and functionality that different projects or processes need.
A library is a dynamic component of a report design. When a library developer makes changes to a library, the report design synchronizes itself with the changed library. In this way, changes propagate easily within a suite of report designs.
A template
This type of file provides a structure for a standard report layout. BIRT Report Designer provides a set of standard templates, such as Simple Listing and Grouped Listing report templates. A template can contain visual report items that appear in the report’s layout, data sources and data sets, and master page layouts. A template can also use one or more libraries in the same way that a report design does.
A template is a static framework on which to build a new report design. For this reason, a report design can derive from only one template. Additionally, when a template developer changes a template, report designs that are based on that template do not automatically reflect the changes to the template.
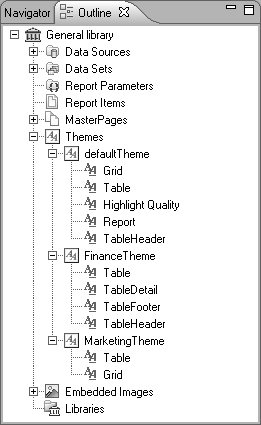
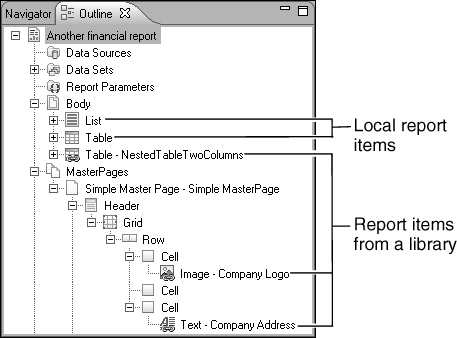
By reading the earlier chapters in this book, you became familiar with the concepts of developing a report design. Developing a library or a template uses similar skills. All these file types use the same report elements from the palette, the data explorer, and the outline view in BIRT Report Designer, but you use each type for a different purpose. Figure 23-1, which illustrates the simplest outlines for each file type, shows the structural differences.
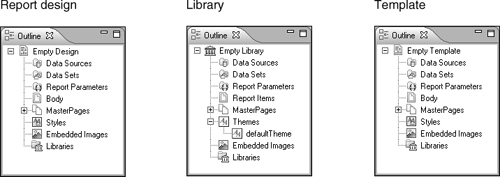
The following sections clarify the differences between these file types.
The main purpose of a report design file is to generate reports by retrieving data from a data set and formatting that data into a layout. The file-name extension for a report design file is .rptdesign.
A report design can contain any number of report features. Data sources, data sets, and report parameters are non-visual elements that you access in the data explorer. You place visual elements in the design by dragging them from the palette and dropping them in the layout. A report design can also include embedded images. You can access any element in a report design by using the outline view. To affect the appearance of the pages in a paginated report, you use the master page, and to ensure a consistent appearance for multiple parts of a report design, you can create and apply styles.
The main purpose of a library is to provide developers of report designs with a shared repository of predesigned report elements. The file-name extension for a library file is .rptlibrary.
Like a report design, a library can include any number of report elements and any type of report element. You add elements to a library by using the palette and the data explorer or by copying them from a report design. If you have a report design that contains all the report elements that you need in a particular library, you can even create a library directly from that report design. Because a library is not a design, there is no Body node in the outline. Instead, a library has a Report Items node, which contains all the visual report items in the library.
When you have added the components to the library, you group related styles into a theme. This grouping provides quick access to all of the necessary styles for that theme. The Themes node in a library takes the place of the Styles node in the other file types.
To share a library across a team of report developers, set the resource folder for each developer to the same shared location, then publish the library to that folder. The developer uses the library explorer to access report elements from the libraries.
The main purpose of a template is to provide a standard start position for a new report design. As such, the structure of a template file is identical to the structure of a report design file. The file-name extension for a template file is .rpttemplate.
A template includes the master pages that the report design uses and any number of report elements. In addition to standard report elements, a template file can include template report elements. These elements display instructions to the report developer about how to use the template. Designing a template is just the same as designing a report design. Indeed, you can create a report design, then save it as a template.
To share a template across a team of report developers, set the template folder for each developer to the same shared location, then publish the template to that folder. When a developer chooses File→New→Report, BIRT Report Designer lists all templates in that folder as well as the standard BIRT templates.
A library provides a straightforward way to use custom styles and report elements. You can make any change to the properties of a report element and copy the element to a library. When you do, the customized element is available to any report design that uses the library directly. When you use an element from a library in a report design, you can change any properties, but you cannot change the structure of the element. For example, if you use a table from a library, you can change the table’s style or data binding, but you cannot add or remove columns or groups.
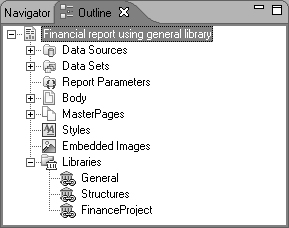
Figure 23-2 shows the structure of a report design that uses a library. The expanded Libraries item shows all the libraries that the report design uses. In this example, the report design uses three libraries.
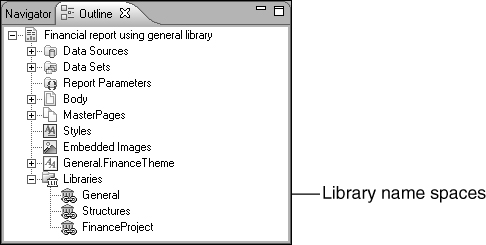
A report design can use multiple libraries, so you can separate logical sets of report elements. BIRT uses the concept of name space to identify the sets of report elements that each library contains. Using a separate name space for each library ensures that BIRT distinguishes between items that have the same name but appear in different libraries.
Table 23-1 describes some of the many possible uses of elements from a library. The table gives only one example use for each type of report element. When you start to design a suite of reports, you will find many more reasons to share report items.
Table 23-1. Examples of uses for shared report elements
Report element | Shared use |
|---|---|
Data source | Typically, provides data sources for a whole reporting project. Change the data source in the library from a test data source to the live data source when the project is deployed. |
Data set | Provides a data set for multiple reports that use the same data. For example, a suite of profit-and-loss reports can use the same tables. Take care when using a shared data set. You must ensure that a shared data set efficiently provides the correct rows for each report design that uses it. In some cases, using different data sets improves performance or accuracy. |
Label | Provides simply formatted, standard text for a report design. For example, a shared label can be a legal notice, such as “Company confidential” with the required font and size. |
Text | Provides standard text that needs complex formatting. For example, a text element can display your company’s standard terms and conditions of sale. |
Dynamic text | Provides formatted text from a data field or expression. For example, a dynamic text element can display notes about a customer’s order. |
Data | Provides data or expressions. For example, a data element can display the result of a common calculation, such as the extended price of a line item in a purchase order. |
Image | Provides a standard image, such as a company logo. |
Grid | Provides a container for other report items. For example, a grid can display a number of static items, such as a company logo in an image element or an address in a label or text element. |
List | Provides a container for data-driven report items. For example, a list can bind to a standard data set, such as customers or orders. |
Table | Provides a container for data-driven report items in columns. For example, a table can bind to a data set for orders and contain data elements that display order number, order status, and order date. |
Chart | Provides a graphical summary of data. For example, a bar chart can display its categories and series in a preferred arrangement. A report developer can use that chart from a library and bind the data fields without needing to know everything about how to design a chart. |
Style | Supports using standard style properties, such as company colors and fonts. |
A key feature of a library is that it is dynamic. This means that when you change a library, the same changes occur in report designs that use the library. For example, if the preferred font for your company changes from Times New Roman to Arial Unicode, you make the changes to styles in a library. When you generate a report from any design that uses styles from that library, or when you open or refresh the design in BIRT Report Designer, the changes take effect.
This dynamic behavior ensures that all report elements that derive from a library always use the current styles and properties. For this reason, when you implement a policy of using libraries, you must ensure that every custom element that more than one report design uses derives from a library element. If you use an element directly from the palette and customize it in the same way in multiple designs, the benefits of dynamic library updating are not available.
Sometimes, BIRT cannot apply changes from a modified library to a report design without additional action on the part of a report developer. The following list describes these situations:
The name of the library changes or the library no longer exists.
The library no longer contains an element that the report design uses.
The name of the element in the library changes.
The name of the element in the library refers to a different type of element.
If BIRT Report Designer opens a report design that has any of these problems, a warning message appears in the layout in place of the affected report element, as shown in Figure 23-3. To repair any of these conditions, you must delete the element that is causing the problem. Alternatively, if you are familiar with XML, you can edit the XML source of the report design. If you choose to edit the XML, you should back up the report design first.
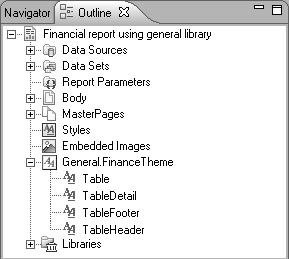
A library provides a flexible way to share sets of styles. A library groups styles into themes. In the outline view for a library, instead of Styles, you see Themes. In a newly created library, Themes contains one theme, defaultTheme. By default, the library uses the styles in this theme to display report items in the layout.
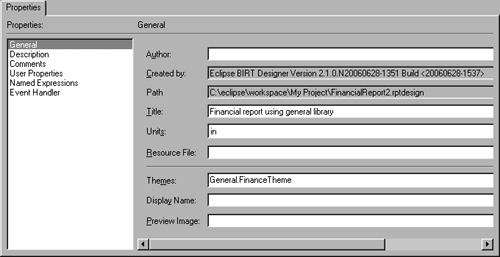
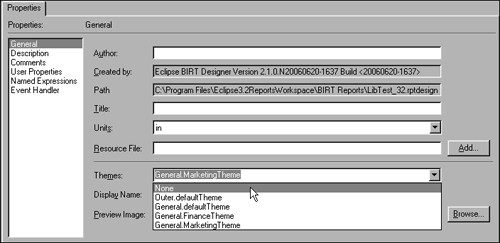
When you use a library in a report design, you can assign a single theme to the report design. The property editor shows the theme that the report design is using, as shown in Figure 23-4. To assign a theme to a report design, you drag the theme from the library in the library explorer and drop it onto the report design. This action makes all the styles in that theme available to items in the report design. Any predefined styles, such as grid, table, and so on, take effect immediately on items in the design. You can use custom styles from the theme in the same way that you use custom styles that are defined in the report design itself. If you define a style with the same name in the report design as one in the library, BIRT uses the style that you define in the report design.
You can create multiple themes in a single library. For example, you can create styles in the default theme for use in most report designs, then make special themes for financial and marketing report designs, as shown in Figure 23-5.
As discussed earlier in this section, a report design can use styles from only one theme. For this reason, if you need some styles to be the same for all themes, you can copy the style from the theme in which you create the style to the other themes.
Because a library is dynamic, when you add styles to a theme, they become available to a report design that uses that theme. For example, consider a theme that does not have a style called table. Tables in a report design that uses this theme use the default style. Later, a library developer adds a style called table to the theme. Now the appearance of the tables in that design match the style that is defined in the theme.
When you use a library in a report design, BIRT assigns a name space to the library. This name space identifies every report element from the library that the report design uses. By default, BIRT Report Designer bases the name space on the file name of the library. For example, if the name of the library is FinanceProject.rptlibrary, the name space is FinanceProject. In Figure 23-2, earlier in this chapter, you see an example of how BIRT Report Designer displays the name space in the outline view of a report design.
If you use more than one library with the same default name space, BIRT Report Designer prompts you for a name space for the second and subsequent libraries. In this case, provide a name space that distinguishes the library from the others but shows a relationship to the original library name.
A library is a key tool for achieving consistent appearance in a suite of report designs. A library also reduces the amount of repetitive work that report developers must complete.
To use libraries effectively, you should consider how to structure the libraries to make best use of their properties and functionality. Although you can use a single library that contains every custom component that your report designs need, this library could become very large and confusing for report developers.
One way to design a suite of libraries is first to make libraries that contain elements that are common to all reporting projects. After you create these general libraries, you can create a project-specific library for each reporting project. These project libraries can contain elements that are simple modifications of the standard report elements. They can also contain complex elements, such as tables nested within grids or lists.
For example, you can create the following libraries:
A general library that contains standard items that all projects use, such as themes, an image element for the company logo, a text element that contains a confidentiality agreement, and grid elements with standard contents for page headers and footers
A library that all projects use for complex items, for example, a table element with predefined behavior, such as highlighting
For each project, one or more libraries that contain elements that are specific to the project, such as data sources
By building suites of libraries in this way, you provide the building blocks for a standard appearance for all reports, then you package the behavior and appearance of report elements that are appropriate to each reporting project. You make the suite of libraries available to report developers by placing them in a repository that is known as the resource folder.
The final step in implementing libraries is to use a library in a report design. A report design can use any library in its project and in the resource folder. The design has access to all the customized elements in these libraries. Figure 23-6 shows a representation of an architecture for libraries and report designs.
The purpose of a general library is to provide a foundation for common elements that can appear in any report designs in any reporting project. A general library contains standard, simple items, such as a company logo image element. This library also contains a default theme that includes settings for predefined styles and any custom styles for all report designs. If multiple reporting projects need to use a different theme, place that theme in this library. Figure 23-5, earlier in this chapter, shows an example of such a library.
A structures library provides grids, lists, and tables to report designs. For example, imagine that most of your report designs use a table element. Initially, the table element in your library is identical in behavior to the table from the palette. Later, you discover a need to alternate the row colors for every table in every report design. You make the change to the tables in the library, and every report design that uses the table from the library now has the new feature. If your structures library did not contain table elements, you would have to make this change manually.
When you create grid, list, and table elements in a library, you need to consider the contents of the cells as well as the layout and behavior of the element itself. As discussed earlier in this chapter, when a report design uses an element from a library, the structure of the element is not modifiable. You can change only the properties of an element that is derived from an item in a library. For this reason, the recommended practice is to place a report item in every cell in a grid, list, or table that you define in a library. By changing the properties of the labels or data items after you place the element in a report design, you can use the same structure to achieve many different results.
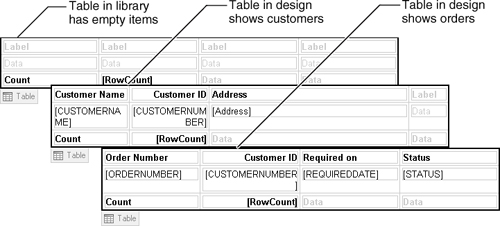
Figure 23-7 shows an example of this approach. The table in the library has four columns. The cells in the header row contain labels, the cells in the detail row contain data elements, and the cells in the footer row contain a label and data elements. A report design uses two copies of the library table. One copy modifies the cell contents to show a list of customers in three columns with a fourth empty column. The other copy uses all four columns to display order information.
The purpose of a project library is to provide customized report elements for report designs within a single reporting project.
The most common elements that are specific to a project are data sources. You can also include data sets in a project library, but, for best report generation speed, a report design should use a data set that is designed for its specific needs. A data set that a library provides is often too general for optimum efficiency, because it retrieves more fields from that data source than most report designs require.
Other simple elements that a project library can contain are project-specific image elements and text elements with standard wording and formatting. A project library can also contain complex, structured elements, such as tables with custom layout or behavior.
There are two ways to set up a project library:
Customizing only the project-specific report elements
Report developers use this library and the general libraries in every new report design for this project. They use the report items from the project library or from the palette.
Use this technique if the project customizes only a few elements or provides only complex structures to complement the elements from the palette.
Customizing every type of report element
Report developers use this library in every new report design for the project. Instead of using report items directly from the palette or the general libraries, they use report items from the project library.
Use this technique if the project customizes many elements or if the project’s requirements are likely to change frequently.
BIRT Report Designer uses the resource folder as a repository for libraries. The location of the resource folder is specified in the Preferences page, which you access by choosing Windows![]() Preferences from the main menu, then choosing the Report Design Resource item. Place general and project libraries in the resource folder. This folder should be one that all report developers can access, such as a directory on a shared network drive.
Preferences from the main menu, then choosing the Report Design Resource item. Place general and project libraries in the resource folder. This folder should be one that all report developers can access, such as a directory on a shared network drive.
If you have a large number of libraries, you can use subfolders to organize the libraries in a logical way. For example, the \SharedServerResourceGeneral folder can contain the general libraries, and \SharedServerResourceFinance can contain the Finance libraries.
To place a library into the resource folder, you can publish a library from your current workspace or you can add a library from an external location. Make sure that your library has a meaningful file name because BIRT Report Designer displays this name to the report developers who use the resource folder.
How to publish a library from your workspace
Open the library in BIRT Report Designer.
Choose File→ Publish Library to Resource Folder.
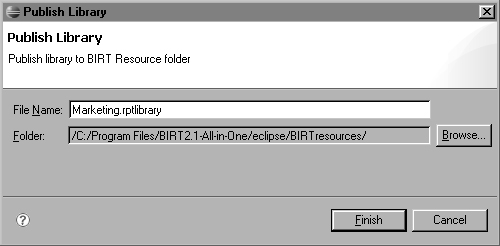
On Publish Library, as shown in Figure 23-8, make changes to the file name and folder. For example, change the file name of the library if you need to make the name more meaningful. Use Browse if you want to place the library in a subfolder of the resource folder. Choose Finish.
On the context menu in the library explorer, choose Refresh. The new library appears in the list of available libraries.
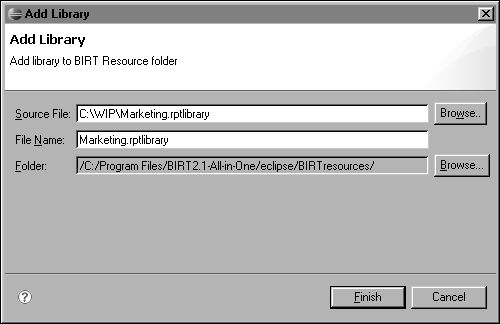
How to add an external library to the resource folder
On the context menu in the library explorer, choose Add Library.
On Add Library, choose Browse to navigate to and select a library from the file system, as shown in Figure 23-9. You can also make changes to the file name and folder in the same way as for publishing a library from your workspace. Choose Finish.
On the context menu in the library explorer, choose Refresh. The new library appears in the list of available libraries.
BIRT Report Designer provides a tool, the library explorer, which supports access to all libraries in the resource folder and its subfolders. Figure 23-10 shows the appearance of the library explorer.
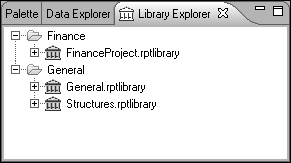
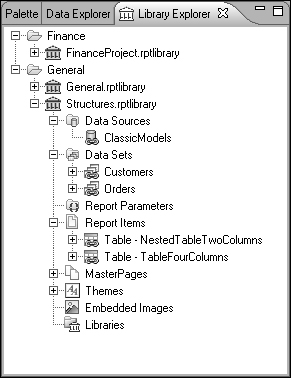
The library explorer shows all the elements in each library in a tree structure, the same as the structure of an open library in the outline view. Because a library does not have a Body slot to order report sections in the report layout, visual report elements are in a Report Items slot. Figure 23-11 shows an example of how the elements in a library appear in the library explorer.
The main difference between the outline view and the library explorer is that you cannot open a library or modify the elements in a library from the library explorer. You can only change elements in a library that you open in the editor. You open a library in the editor in the same way that you open a report design, by using the navigator or, in BIRT RCP Report Designer, by choosing File→Open.
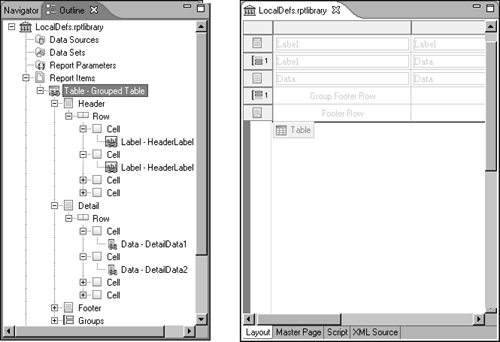
When you open a library in BIRT Report Designer, no layout appears in the layout editor. Unlike a report design, a library has no Body slot that orders the sections in the layout. Instead, you design each report item separately by selecting an item from Report Items in the outline view. Figure 23-12 shows an example of editing a table element in a library.
The library explorer does not check actively for changes to libraries. For this reason, it does not immediately display changes to the list of available libraries or the items in an individual library. To update the view in the library explorer, right-click inside it, and choose Refresh.
BIRT Report Designer provides two ways to create a library. Use whichever technique best suits your requirements. The creation options are:
Creating an empty library
From the Eclipse main menu, choose File→New→ Library. Use this technique if you have no existing report designs or if you have many existing designs that use different styles or property settings. You can create a set of related report elements that do not depend on existing designs.
Creating a library from an existing report design
In the outline view, right-click the report design root, and choose Export. Use this technique if you have an existing report design that contains report elements that use the desired properties and styles.
When you name a library file, BIRT uses this name to build the name space when you use the library in a report design. The name space appears in the Libraries node in the outline view for the report design and in the names of themes, styles, and unmodified library report items that the report design uses.
After you create the library, you add report elements to the library. In many ways, this process is similar to adding elements to a report design. You add data sources and data sets to the library in exactly the same way as to a report design.
You add styles to a theme in the outline view, rather than directly to Styles. To add visual report items, you drag the item from the palette to the layout editor or to the Report Items node in the outline view.
How to add an element to a library
Creating an element in a library uses the same wizards and dialogs as when you create an element in a report design. After you add an element to a library, you make changes to it in the same way as you do in a report design.
Open or create a library.
In the data explorer, create any required data sources and data sets.
To add a style, in the outline view, expand the Themes node.
Right-click a theme, then choose New Style.
To add a theme, in the outline view, right-click the Themes node, and choose New Theme.
To add a report item, drag an item from the palette to Report Items in the outline view. The item appears both in Report Items and in the layout editor.
Using report items from a library is as straightforward as using items from the palette. In the library explorer, you expand the library that you need, and you expand Report Items inside that library. Then, you drag the report item to the layout of your report design. If this item is the first use that you make of a library, BIRT Report Designer displays a message to let you know that you added the library to the report design. In the outline view of your report design, the icon of an item from a library appears with a link, as shown in Figure 23-13.
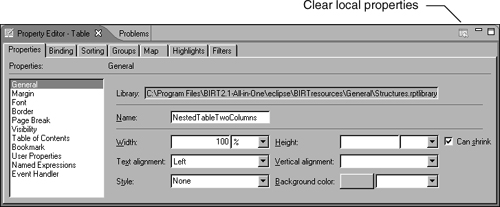
When you select an item in your report design that comes from a library, the property editor displays the extra field, Library, as shown in Figure 23-14. This field shows the full path of the library that provides the definition of the item.
To add a data source from a library to a report design, you drag the data source from the library in the library explorer to Data Sources in the outline view or the data explorer. You can then create data sets that use the data source. If you need to use a data set from a library, you first add its data source to the report design, then you drag the data set to the outline view or the data explorer.
Typically, when you use a library element in a report design, you need to modify the element’s properties in some way. For example, you might want to increase the size of the text in a text element that contains a confidentiality agreement. As shown earlier in this chapter in Figure 23-7, you can also change the values and expressions in labels and other report items in a table.
You make changes to the item’s properties in the same way that you change any other item in the report design. The report design stores only the changes that you make to the report item. BIRT takes all other properties from the item in the library. In this way, BIRT retains the dynamic nature of the library item while supporting your local changes.
As discussed earlier in this chapter, you can only change the properties of a report item, not its structure, so you cannot add or remove columns or groups in a grid, list, or table element that comes from a library.
You can also make changes to the query in a data set from a library. To open the data set editor, you double-click the data set.
If you need to revert to the original properties of the element, you select the Clear local properties button on the property editor’s tool bar. Figure 23-14 shows the location of this button. When you select this button, BIRT Report Designer prompts you to confirm that you want to discard your changes.
To use a style from a library, you first set the Themes property of the report design to the library theme that contains the style that you need. The report design then has access to all the styles in that theme. As shown in Figure 23-15, the styles in the theme appear in the outline view in a new item, Themes.
A report design has access to the themes in all the libraries that it uses, but it can use styles from only one theme. For this reason, the library developer must place all the necessary styles in each theme. Predefined styles in the theme, such as table or grid, take effect when you select the theme in the property editor. Custom styles from the library are available in the list of styles in the property editor for a report item.
If the report design contains styles that have the same names as styles in the current theme, the report design’s styles take effect. To revert a report design to use only its local styles, set the Themes property of the report design to None. When you do this, the outline view no longer shows a Themes item.
How to set a theme for a report design
In the library explorer, expand the library that contains the theme. Expand the Themes node in the library.
Drag the theme that you want to use from the library explorer and drop it in the layout editor.
Any predefined styles in the theme take effect in the report design immediately. The appearance of any report items in the layout editor changes to match the styles in the theme. The library appears in the Libraries node of the outline view.
How to drop a theme from a report design
You drop a theme from a report design by changing the Theme property of the report root item.
To access the report design’s properties, in the outline view, select the report root item.
Figure 23-16 shows this item selected. This item shows either the report design’s file name or its title property value, if it has one.
In the property editor, select None from the list in Themes, as shown in Figure 23-17.
Now, the theme that the report design uses is None, which means that it uses only its own styles, not styles from a theme in a library.
A template provides a straightforward way to use a custom layout and master pages for a suite of reports. You design a template in the same way that you design a report. A template can contain data sources, data sets, master pages, and any type of report item.
Just like a report design, a template can use report elements and themes from a library. In this way, templates extend the shared development effort that libraries provide. Libraries provide access to sets of individual report elements, but templates assemble them into a standard report layout. For example, a template for a bulk marketing letter can use a company logo from a general library and the marketing theme and a data source from the marketing project library. The report designs that build on the template get the addressees and the content for the letter from a report-specific data set.
You can develop a template directly or use an existing report design as the basis for a template. Figure 23-18 shows how the library architecture extends to building templates.
After you design a template, you publish the template to a shared location. You define this location on the Report Design Preferences Template page, which you access by choosing Windows→Preferences. BIRT Report Designer checks this location when a report developer creates a new report design. The new template appears in the list of report templates in the New Report wizard.
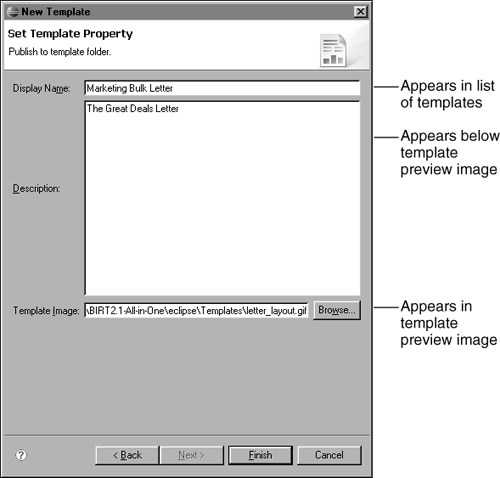
To provide visual assistance to the report developer, you can associate an image with the template. This image appears in the preview area of the wizard when the developer selects the template.
BIRT Report Designer provides two ways to create a template. Use whichever technique best suits your requirements. The creation options are:
Creating an empty template
From the Eclipse main menu, choose File→New→Template. Use this technique if you have no existing report designs that have the required structure.
Creating a template from an existing report design
Open the report design. From the Eclipse main menu, choose File→Save As. Change the file type of the report design to .rpttemplate. Use this technique if you have an existing report design that has the structure that you need.
When you create a template, the New Template wizard prompts you for template-specific properties. Figure 23-19 shows the properties and describes where they appear in the wizard. These properties appear in the template selection page of the New Report wizard when the report developer selects the template as the start position for a report design. You must always supply a Display Name. The other properties are optional.
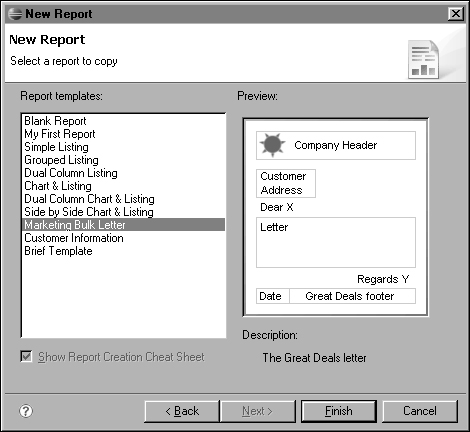
When the report developer selects a custom template in the New Report wizard, its preview image appears, if you supplied one. Figure 23-20 shows an example of a custom template that has a preview image.
If you do not supply some of the optional template properties, the New Report wizard displays default values. Figure 23-21 shows how such a template appears.
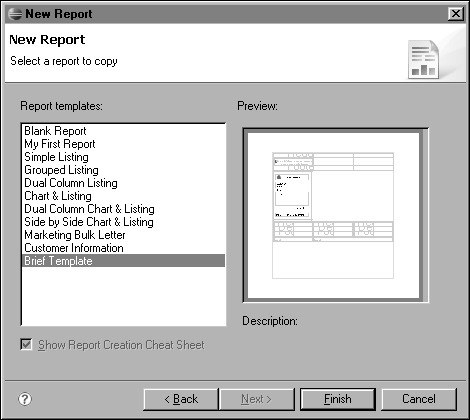
No description appears for the template. Because you have not supplied a template image, BIRT Report Designer creates a thumbnail image of the layout of the report design in Preview.
After you develop the structure of a template, you can choose to identify some or all of the items in the layout as template report items. When a report developer uses the template to create a report design, a template report item appears in the layout with an informational message. Double-clicking the template report item activates the item as a standard report item with the properties that you set when you designed the template.
A template can contain both template report items and normal report items. Use template report items for items that you want the report developer to modify for the new report design. Use normal report items for items that the report developer does not need to change.
Typically, you create template report items on simple report items, such as text or data elements inside a table or grid element. You can then make the container into a template element, with overall instructions for the items inside it.
If you need to provide complex instructions for using a template, you can create a set of instructions for the template that is called a cheat sheet. BIRT RCP Report Designer does not support creating a cheat sheet. You need to use BIRT Report Designer, which includes the Eclipse Plug-in Development Environment. To create a cheat sheet, choose Help→Help Contents. In the Eclipse online help, see the Advanced Workbench Concepts topic inside the Platform Plug-in Developer Guide book’s Programmer’s Guide. The cheat sheet property is available in the Properties view for a template.
How to create a template report item
Create or open a template.
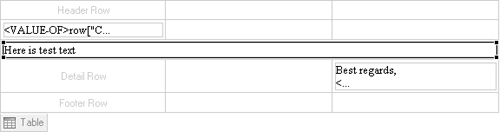
Add a report item to the layout, or select an existing item in the layout. For example, Figure 23-22 shows a text item inside a table item.
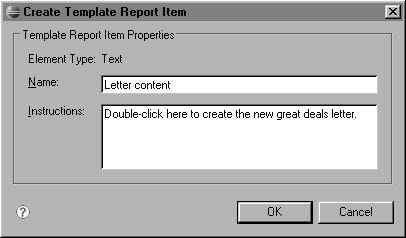
Right-click the report item, and choose Create Template Report Item.
On Create Template Report Item, type instructions to the report developer. These instructions explain how to use the report item. Figure 23-23 shows an example of some instructions.
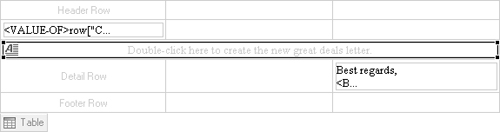
The report item now appears in the layout as a template report item. The template report item displays an icon that is appropriate to the type of report item and the instructions that you provided.
Figure 23-24 shows how a text element appears.
To make a template available to report developers, you publish the template to a template folder. The default location of the template folder is the folder in the BIRT report designer user interface plug-in that contains the standard templates. Typically, this folder is not in a shared location, so you need to change it. You define the template folder within your Eclipse preferences. Next, you publish the template. If the template has a preview image, copy the image to the template folder. You must also ensure that the preview image’s location in the template is the shared template folder.
How to set up a template folder
From the Eclipse main menu, choose Window→Preferences.
In Preferences, expand Report Design, and choose Template.
To navigate to the template folder, choose Select, then choose OK.
How to publish a template
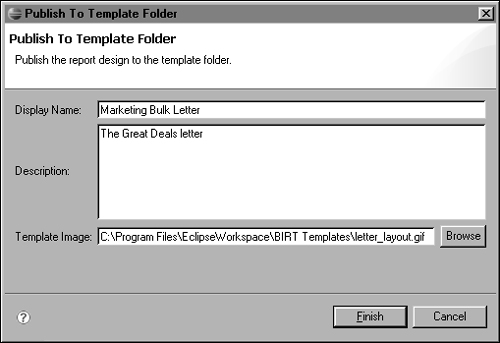
Open the report template, then choose File→Publish to Template Folder.
In Publish to Template Folder, check the properties, as shown in Figure 23-25.
Make any corrections to the properties, then choose Finish.
To use a custom template as a starting point for a report design, you must define the template folder, following the instructions from earlier in this chapter. After you set up the template folder, the New Report wizard includes the custom template in the list of available templates.
After you choose Finish in the New Report wizard, BIRT Report Designer displays the layout of the template in the layout editor. All the report elements in the template, such as data sources, data sets, and visual report items, are available for editing in the same way that you edit a predefined template.
A template can include template report items as well as standard report items in the layout. You can see the appearance of a template report item in Figure 23-24, earlier in this chapter.
How to use a template report item
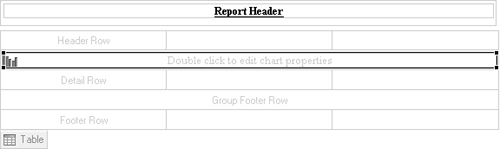
To use a template report item, you must create a report design from a template that contains a template report item. This example uses the predefined Chart and Listing template.
Create a report design. In the New Report wizard, choose the Chart and Listing predefined template.
In the layout editor, follow the instructions in the cheat sheet.
The final instruction is to edit the chart. The chart item is a template report item. This item appears in the layout with an appropriate icon and instructional text, as shown in Figure 23-26. The text supplements the instructions in the cheat sheet. In this case, the instructions are similar.
When you double-click the template report item, the chart builder appears.
Set up the chart as described earlier in this book.
The chart now appears as a standard chart element in the layout.
To discard the changes that you made to the chart, right-click the chart element, and choose Revert to Template Item. The chart now appears as the original template report item, as shown in Figure 23-26.