

This is the Title of the Book, eMatter Edition
Copyright © 2012 O’Reilly & Associates, Inc. All rights reserved.
The BLAST Algorithm
|
81
all potential neighborhood words. The two-hit distance is set to 40 amino acids by
default, so words don’t have to be clustered as closely as they appear in the figures.
In principle, setting the two-hit distance to a smaller value also increases speed, but
in practice, its effect is insubstantial.
In WU-BLAST, you may set W to any value for any program. If W is set to 5 or more,
neighborhood word scores aren’t used; they are computed only by explicitly assign-
ing a value for T. High values of W in conjunction with moderate values of T can
lead to immense memory requirements, so it is best not to set T when W is 6 or
more. To alter the speed/sensitivity of WU-BLAST you can use a variety of combina-
tions of W, and T, and you can also employ the two-hit algorithm.
The statistical model underlying BLAST assumes the letters are independent of one
another so that the words MQV and MVQ have the same probability of occurring.
However, certain combinations occur in biological sequences much more often than
expected. These are usually low-complexity sequences—for example, FFF (see Chap-
ters 2 and 4). Low-complexity sequences are often of little biological interest and
aligning them wastes CPU cycles. Masking these regions is therefore common. Both
NCBI-BLAST and WU-BLAST let you replace these regions with N’s or X’s, which
have negative scores when aligned with a nucleotide or amino acid. A more useful
technique, termed soft masking, prevents seeding in such regions, but lets align-
ments extend through them.
Extension
Once the search space is seeded, alignments can be generated from the individual
seeds. We’ve drawn the alignment as arrows extending in both directions from the
seeds (Figure 5-5), and you’ll see why this is appropriate. In the Smith-Waterman
algorithm (Chapter 3), the endpoints of the best alignment are determined only
after the entire search space is evaluated. However, because BLAST searches only a
subset of the space, it must have a mechanism to know when to stop the extension
procedure.
To make this clearer, we’ll try aligning two sentences using a scoring scheme in
which identical letters score +1 and mismatches score -1. To keep the example sim-
ple, ignore spaces and don’t allow gaps in the alignment. Although only extension to
the right is shown, it also occurs to the left of the seed. Here are the two sentences:
The quick brown fox jumps over the lazy dog.
The quiet brown cat purrs when she sees him.
Assume the seed is the capital T, and you’re extending it to the right. You can extend
the alignment without incident until you get to the first mismatch:
The quic
The quie

This is the Title of the Book, eMatter Edition
Copyright © 2012 O’Reilly & Associates, Inc. All rights reserved.
82
|
Chapter 5: BLAST
At this point, a decision must be made about whether to continue the alignment or
stop. Looking ahead, it’s clear that more letters can be aligned, so it would be fool-
ish to stop now. The ends of the sentences, however, aren’t at all similar, so we
should stop if there are too many mismatches. To do this, we create a variable, X,
that represents the recent alignment history. Specifically, X represents how much the
score is allowed to drop off since the last maximum. Let’s set X to 5 and see what
happens. We’ll keep track of the sum score and the drop off score as we go.
Figure 5-6 shows the graphical interpretation.
The quick brown fox jump
The quiet brown cat purr
123 45654 56789 876 5654 <- score
000 00012 10000 123 4345 <- drop off score
The maximum score for this alignment is 9, and the extension is terminated when
the score drops to 4. After terminating, the alignment is trimmed back to the maxi-
mum score. If you set X to 1 or 2, the best alignment has a score of 6. If you set X to
Figure 5-5. Generating alignments by extending seeds
Figure 5-6. Attenuating extension with X
Extension
Alignment
Score
Length of extension
Trim to max
X = 5
This is the Title of the Book, eMatter Edition
Copyright © 2012 O’Reilly & Associates, Inc. All rights reserved.
The BLAST Algorithm
|
83
3, you can retrieve the longer alignment and save a little computation. A very large
value of X doesn’t increase the score and requires more computation. So what is the
proper value for X? It’s generally a good idea to use a large value, which reduces the
risk of premature termination and is a better way to increase speed than with the
seeding parameters. However, W, I, and 2-hit are better for controlling speed than X.
The gapless extension algorithm just demonstrated is similar to what was used in the
original version of BLAST. The algorithms in the current versions of BLAST allow
gaps and are related to the dynamic programming techniques described in Chapter 3.
Therefore, X not only depends on substitution scores, but also gap initiation and
extension costs.
Implementation details
Extension in BLASTN is a little different from BLASTP and the other protein-based
programs. The reason for this has to do with how nucleotide sequences are stored in
BLAST databases. Because there are only four common nucleotide symbols, nucle-
otide databases can be stored in a highly compressed state with only two bits per
nucleotide. What happens if the sequence contains an N or other ambiguous nucle-
otide? A random canonical nucleotide is substituted. For example, an N can be ran-
domly changed to A, C, G, or T and a Y changed to a C or T. It is possible, especially
with long stretches of ambiguous nucleotides, that the two-bit approximation termi-
nates extension prematurely.
NCBI-BLAST and WU-BLAST take very different approaches to the gapped exten-
sion procedure. NCBI-BLAST has three values for X (parameters
-X -y -Z) and WU-
BLAST has two (parameters
-X and -gapX). Some differences, such as the presence of
a floating bandwidth (NCBI) rather than a fixed bandwidth, are interesting from an
academic viewpoint but less so from a user’s perspective. What is important is that
altering the extension parameters from their defaults is generally not an effective way
to increase the speed or sensitivity of a BLAST search. You might consider adjusting
the parameters in two situations:
• If you align sequences that are nearly identical and you want to prevent the
extensions from straying into a nonidentical sequence, you can set the various X
values very low.
• If you try to align very distant sequences and have already adjusted W, T, and
the scoring matrix to allow additional sensitivity, it makes sense to also increase
the various X values. That said, when searching for remote homologies, it is
often better to employ an algorithm with a position-specific scoring matrix, such
as PSI-BLAST or HMMER.
Since gapped extension also depends on the gap initiation and extension costs, you
should note that these parameters are interpreted differently in NCBI-BLAST and
WU-BLAST. In NCBI-BLAST, the total cost for a gap is the gap opening cost (
-G)
plus the gap extension cost (
-E) times the length of the gap. In WU-BLAST, the total
This is the Title of the Book, eMatter Edition
Copyright © 2012 O’Reilly & Associates, Inc. All rights reserved.
84
|
Chapter 5: BLAST
cost of a gap is the cost of the first gap character (-Q) plus all remaining gap charac-
ters (
-R). The NCBI parameters -G 1 -E 1 are identical to -Q2-R1 in WU-BLAST.
Evaluation
Once seeds are extended in both directions to create alignments, the alignments are
evaluated to determine if they are statistically significant (Chapter 4). Those that are
significant are termed HSPs. At the simplest level, evaluating alignments is easy; just
use a score threshold, S, to sort alignments into low and high scoring. Because S and
E are directly related through the Karlin-Altschul equation, a score threshold is syn-
onymous with a statistical threshold. In practice, evaluating alignments isn’t as sim-
ple, which is due to complications that result from multiple HSPs.
Consider the alignment between a eukaryotic protein and its genomic source.
Because most coding regions are broken up by introns, an alignment between the
protein and the DNA is expected to produce several HSPs, one for each exon. In
assessing the statistical significance of the protein-DNA match, should each exon
alignment be forced to stand on its own against the statistical threshold, or does it
make more sense to combine the scores of the various exons? The latter is generally
more appropriate, especially if some exons are short and may be thrown out if not
aided in some way. However, determining the significance of multiple HSPs isn’t as
simple as summing all the alignment scores because many alignments are expected to
be extensions from fortuitous word hits and not all groups of HSPs make sense.
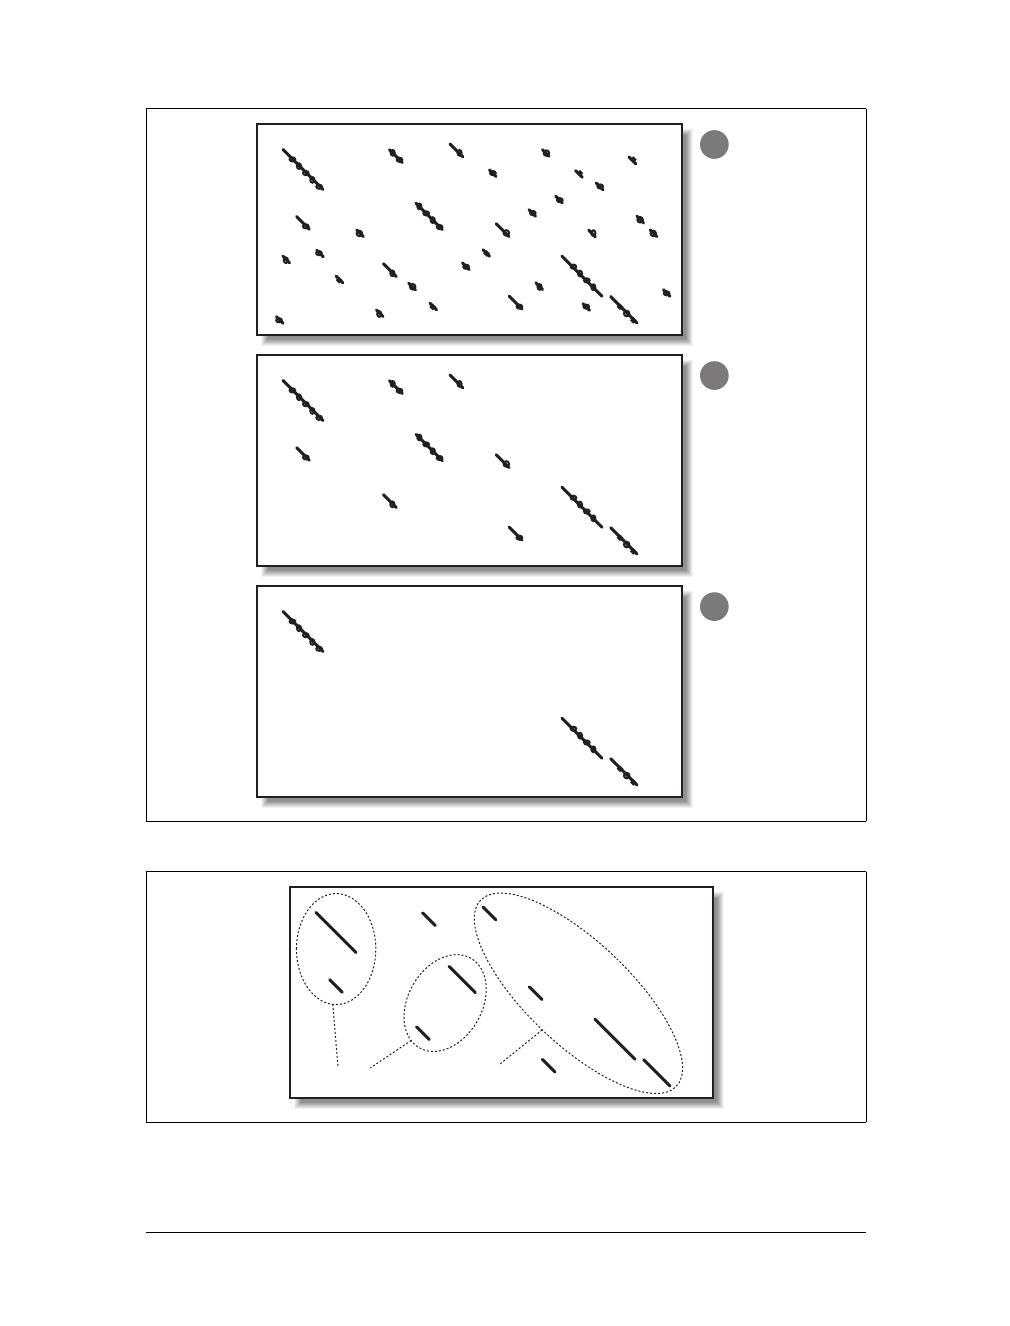
An alignment threshold is an effective way to remove many random, low-scoring
alignments (Figure 5-7). However, if the threshold is set too high, (Figure 5-7c), it
may also remove real alignments. This alignment threshold is based on score and
therefore doesn’t consider the size of the database. There are, of course, E-value and
P-value interpretations, if you consider the size of individual sequences or a constant
theoretical search space.
Qualitatively, the relationship between HSPs should resemble the relationship
between ungapped alignments. That is, the lines in the graph should start from the
upper left and continue to the lower right, the lines shouldn’t overlap, and there
should be a penalty for unaligned sequence. Groups of HSPs that behave this way are
considered consistent. Figure 5-8 shows consistent and inconsistent HSPs. From a
biological perspective, you expect the 5´ end of a coding sequence to match the
N-terminus of a protein and the 3´ end to match the C-terminus—not vice versa.
The algorithm for defining groups of consistent HSPs compares the coordinates of all
HSPs to determine if there are overlaps (a little overlap is actually allowed to account
for extensions that may have strayed too far). This computation is quadratic in the
number of HSPs and therefore can be costly if there are many HSPs (e.g., when the
sequences are long, and the alignment threshold is low).
This is the Title of the Book, eMatter Edition
Copyright © 2012 O’Reilly & Associates, Inc. All rights reserved.
The BLAST Algorithm
|
85
Figure 5-7. Increasing alignment thresholds remove low scoring alignments
Figure 5-8. Consistent and inconsistent alignment groups
Low
Medium
High
A
B
C
Consistent
Inconsistent
..................Content has been hidden....................
You can't read the all page of ebook, please click here login for view all page.