Organizing Information Flows
Working and Managing Across Functions
Planning and Coordinating Projects
Measuring and Monitoring Performance and Quality
Encouraging and Enabling Compliance
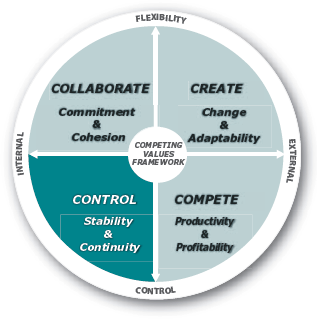
Joining an organization gives us an opportunity to work toward significant outcomes that we could not accomplish individually. To make that opportunity a reality, members must find ways to coordinate their activities. Complete flexibility without any control would result in chaos.
Organizational Goals. Just as commitment and cohesion are important for the success of organizations, so, too, are stability and continuity—the goals associated with the internal process model. Control is the action imperative of the internal process model based on the assumption that routinization will lead to stability and continuity. Key activities tend to be focused on internal issues and include defining responsibilities and measuring and documenting performance.
Paradoxes. While these activities are important, managers who create complex control systems often discover that excessive constraints on workers can paradoxically undermine the welfare of the organization. Similarly, an overemphasis on control also can result in getting the details right but failing to accomplish broader objectives. The paradoxical need to accomplish special projects while still completing day-to-day tasks is another challenge that managers focused on control must face. Perhaps the most common paradox associated with control, however, relates to the creation of bureaucratic red-tape. Over time, rules and procedures that initially increased organizational effectiveness later become impediments to performance.
Competencies. The five competencies included in this module are all valuable for contending with the paradoxes associated with control. They take into account the impact that people, as well as organizational processes, have on the stability and continuity of the organization. We begin with a discussion of organizing information flows. Information is the lifeblood of the organization, and managing information effectively is a critical aspect of a managerial leader's job. Next, we offer general guidelines for working and managing across functions and then go on to describe some specific tools that managers can use when planning and coordinating projects. Our fourth competency in this module, measuring and monitoring performance and quality, takes us beyond issues of process to consider the types of outcomes that organizations seek to achieve. Evaluating organizational outcomes has become even more complex in recent years, as social and political pressures have been applied to get businesses to think about more than just increasing the value of their stock. We conclude this module with the quintessential control question—how can managers encourage and enable compliance? We consider this question with respect to compliance with not only organizational rules and procedures, but also with legal and regulatory requirements for organizations.
New technologies have greatly increased the amount of information we receive and the speed at which requested information arrives. In the past we could write a letter, drop it in the mailbox, and then turn our attention to other things while we waited for a reply. Now, with fax machines, cell phones, laptops, and PDAs, responses can be immediate, pushing the work back onto our desks before we even have time to take a deep breath.
Back in 1997, David Shenk wrote, "Information overload has replaced information scarcity as an important new emotional, social, and political problem" (Shenk, 1997, p. 29). Since then, the problem has only gotten worse. In 2006 alone, the amount of digital data produced was equal to three million times the information contained in all the books ever written (Nordenson, 2008). It is no surprise then, that a recent survey of 650 professionals found that across 23 professions such as consulting, financial services, and education, 69.6 percent of respondents reported that they were overloaded by the amount of information they have to cope with related to their jobs (Davis, 2008).
Paradoxically however, even though managers have a smorgasbord of data at their fingertips, they also often claim to be starved for good information (Beard & Peterson, 2003). This apparent contradiction stems in part from our failure to distinguish between data and information. The term "data" refers to facts that have no particular context or organization and, as a result, data have no clear meaning. To make data meaningful, those facts must be organized and given context. It is in this way that data are translated into meaningful and, therefore useful, information (Beard & Peterson, 2003). To keep things simple in this text, we sometimes use the term "information" when it would be more accurate to say "data and/or information." Keep in mind, however, that if it isn't meaningful and useful, it really isn't information!
Russel Ackoff, an international consultant on managerial problem solving, says that a major problem confronting managers is too much irrelevant information. Managers are surrounded by data that do not tell them what they need to know but that demand attention anyway. Smart managers learn to watch the helpful data and ignore the irrelevant stuff. Less sophisticated managers drown in information anxiety. Richard Wurman, an expert on making information visually accessible, says, "Information anxiety is produced by the ever widening gap between what we understand and what we think we should understand. [It is] the black hole between data and knowledge. It happens when information doesn't tell us what we want or need to know" (Wurman, 2001, p. 14). See whether you identify with some of these symptoms of information overload as a student or employee:
Chronically talking about not keeping up with what's going on around you.
Nodding your head knowingly when someone mentions a book, an artist, or a news story that you have actually never heard of.
Assuming you must read every email you receive, regardless of who sent it.
Thinking that the person next to you understands everything and you don't.
Calling something that you don't understand "information." It isn't information if you don't understand it (Wurman, 1989, pp. 35–36).
The fashion of referring to virtually any kind of data as "information" emerged when we started using the word to describe anything that was transmitted over an electrical or mechanical channel (Campbell, 1982). The term "information" meant anything sent by any channel to any receiver, whether or not the receiver found it informative or interesting. "Information" has since become one of the most important terms in our society; however, much of the information we receive is really just unformed data.
We are inundated with bits and pieces of data, disconnected from any coherent picture, and yet we still feel guilty when we can't assimilate it. Information is probably best thought of as "that which reduces uncertainty." If the information we use is only adding to our uncertainty, it is probably data that have not yet been converted to information. Wurman (2002) suggests that most of us need to get beyond the anxiety of not knowing so we can begin to understand. He wants us to relax, feel less guilty about our ignorance, and begin to play with and exploit information instead of being controlled and intimidated by it. That is great advice, but how do we get to that point?
Today's managers are more harried than ever before, not only because of all the data coming at them from so many different sources, but also because many of them are now working without an assistant. Assistants have traditionally filtered a lot of information and transactions for managers, but many of these support positions have been eliminated from contemporary organizations. Thus, the individual manager has increasingly had to handle the channeling and managing of information. The bad news is that the problem of data overload is here to stay. The good news is that managers can become more efficient and effective if they learn and apply some tools and strategies for handling data inflows.
Good managers review all incoming data flows, but great managers are able to organize data efficiently, determine what information they need, and what information needs to be channeled to others. Great managers establish information management habits and systems that force them to do something quickly with every incoming piece of data, whether it is on paper, a digital recording, or an electronic message. Without a good system, you may not be able to wade through the insignificant stuff to find the information you need, when you need it. Managers need to set up and use a system that forces them to do something with every piece of paper that hits their desk and every email that appears in their inbox.
"Traffing," a method recommended by personal efficiency expert Stephanie Winston (Winston, 2004), is designed to end the inefficient practice of handling the same piece of paper many times. The same basic process can be applied to electronic messages, whether email or voice mail, which now make up the majority of most of the data inflows that inundate managers.
The metaphor of traffic control is wisely chosen because to control traffic, we have to give it places to go. Likewise, papers and emails have to be given a few basic routes or streams in which to flow. The list of items in front of you, all pleading for your attention, may be long; however, the number of choices you have for dealing with them is, fortunately, quite short. Winston's advice on Traffing gives you four options:
Toss papers into the wastebasket or recycling bin if they are not immediately valuable. Most of us are too conservative when deciding what to save. If you throw something out that you later discover you need, you can usually get another copy. For email, the electronic version of "tossing" is deleting.
Refer messages to other people (e.g., secretary, staff, colleagues). You should probably set up files for the people you most often refer things to. If you're not using routing slips, start immediately. You can usually save time by attaching a Post-it Note that briefly explains why you're referring the information. You can easily do the same for emailed messages and documents by forwarding them with an explanatory note.
Act by putting papers requiring your personal action (for example, writing a response letter or a brief report) in an action box or folder. These are the "hot" items you must act on before they get cold. In addition to placing documents in an "act" folder (physical or electronic). You should also record the action you need to take on your to-do list. The list is a very efficient reminder of things you need to act on. Plus, the act of putting them on the list will help you remember that you need to do them. Of course at some point, you will need to prioritize what is on your to-do list—we'll get to that topic soon.
File documents by indicating on the document itself the name of the file into which it should go. Put email that you need to save into folders. Put paper in a box or file labeled "to file." Even if you don't have an assistant who will file papers for you, it generally is more efficient to file papers on a periodic basis rather than getting up to file things while you are trying to clear your desk. Keep in mind that reading, in terms of this system, is a form of acting. If a document takes more than five minutes to read, put it in the "act" box. Don't let reading short-circuit your Traffing, or you'll never get the papers sorted. Make a clear distinction between Traffing and acting, and schedule time for doing both.
Traffing helps you wrap your mind around all the paper and messages you have to deal with and is an important step for dealing with data inflows. Even after tossing, referring, and filing, however, the number of items that end up in a manager's Action file is often overwhelming. Complicating matters further for managers is the fact that that they are frequently interrupted—the phone rings, a subordinate comes by to ask a question, a colleague stops off to see if you'd like to join him for lunch. Interruptions are difficult to avoid. The research firm Basex reported that "interruptions take up nearly 30 percent of a knowledge worker's day and end up costing American businesses $650 billion annually"(Nordenson, 2008).
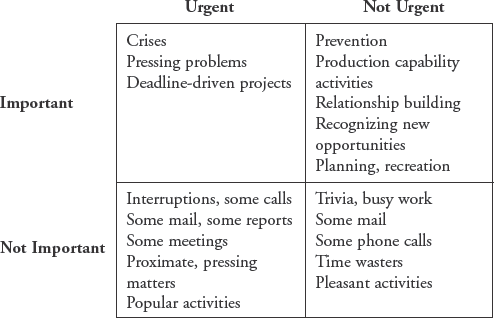
One approach to prioritizing suggested by Steven Covey in his book, The 7Habits of Highly Effective People is the Time Management Matrix (see Figure M2.1). Covey argues that we often fail to recognize the difference between Importance and Urgency and therefore allow ourselves to become bogged down in things that seem to be urgent, and we fail to devote time to what is important. Important action items are things that we need to act on related to our mission, values, and goals. Something is urgent when it requires immediate action. Because activities that are important have great significance or value, they often take a significant amount of time to complete.
Covey argues that in addition to avoiding spending time doing things that are not important, effective people also minimize the number of things that are important and urgent by spending more time doing things that are important but not urgent. As most of us have learned the hard way, tasks that are important but not urgent today, eventually become urgent as well as important if we do not attend to them.
Although people most often think about information flows in terms of the information that they receive, managers also have a responsibility to think carefully about the information that they pass on to others. Because we all suffer from information overload, effective managers must confront another paradox: employees don't want to be overwhelmed by unnecessary information, but they also typically do not want to be left out of the loop and be uninformed about what is happening in the organization. Deciding what information should be shared and what information need not be shared is not easy—but then, few things in management are!
One way to help you decide whether to forward an email or copy others on a message is to think about how a recipient using the Traffing method would be likely to respond to what you send. From a practical perspective, if it will just be Tossed, then you may want to leave their name off the list. Similarly, if you think a colleague will just Refer a request to someone else to do, you may be tempted to send it directly to the person who is likely to get the job. Politically, however, this could be a mistake—your colleague might think that you are trying to work around him, rather than realizing that you were just trying to save everyone some time.
Because email is such a common method for sharing important information, we offer a tool that can be used to compose your email messages. This tool can also be used for creating brief and concise voicemail messages for work and for personal use. By using this tool effectively, you can avoid confusing your customers, clients, and coworkers with unclear messages.
The OABC method was developed by William Baker, our colleague and a management communication professor at BYU's Marriott School of Management. Baker drills his MBA students on his OABC method for framing both email and voice-mail messages. This acronym stands for Opening, Agenda, Body, and Closing. The OABC method is a great antidote to the rambling and foggy messages that are sent out all over the world every day. This simple method requires you to make a very brief written or mental outline of the message. The outline of the message is usually best ordered in the following way:
Opening: A quick statement of greeting that sets a positive tone and also identifies you clearly, especially if you are a stranger to your audience. Even if you know the person well, it is often helpful to include your first and last name at the beginning of a voice mail to help the listener quickly put your message into context.
Example: "Hi, Chris, it's Karen Hooper. Great job on the presentation to the marketing group."
Agenda: An outline or map of what your message is about. Even brief messages usuallyneed a "frame" or border to go around them.
Example: "I have two things I wanted to share with you: The first is about the proposal to the Gartner Group, and the second is about a message I got from Kim Lee at the Ford Foundation."
Body: The "business" message itself, expressed in concrete and simple terms.
Example: "I think the proposal is solid, but it needs more work in the staffing section where we talk about our expertise in data warehousing. I'm attaching a document that gives you more specifics of what I think it should look like.
Second, Kim Lee at the foundation really needs us to have a representative at the awards luncheon. It's on July 17 at noon. Could you possibly attend in my place? I'll be in Toronto."
Closing: A concluding statement of what you want the person to do—who doeswhat by when?—and a cordial and efficient ending such as a simple thank-you.
Example: "Please look at the attachment and share it with the design team. I'll be back on Wednesday to discuss it with you. Also, please let me know by end of the day tomorrow if you can attend the luncheon, and I will call Kim myself from Toronto. Thanks. You've been a better teammate than I've been this week."
This message is more formal than one you might send to a coworker or friend whom you know very well. But notice that it's an easy message to "unpack." It has a pleasant tone, and it's coherent and complete. Chris knows exactly what Karen needs from him and when. Make a habit of using the OABC method in any message through any channel. We have used it with high-level managers and executives who have quickly added it to their toolkit. It can be applied to memos and business letters as well as to email and voice mail.
In addition to thinking about what information should be shared and with whom, it also is important to think about how best to share that information. Would a phone call be better than an email? Is this something that should be discussed face-to-face? Is a formal memo necessary? The answers to these questions depend not only on the content of the message but also on the characteristics of the intended recipient. Some people, for example, are much more responsive to voice-mail messages than to email messages. Some people avoid email and voice mail, preferring to stop people in the hallways when they see them to convey important information (not a method that we recommend!).
You also may discover that some people have trouble coping with emails that contain more than one topic. If Karen Hooper, in our example above, was sending an email to Chris and realized that he tended to focus only on the first topic in a message, she might want to send two separate messages, particularly because her first issue is something Chris is likely to take some time to get to, but he should be able to respond to the question about attending the luncheon immediately.
Messages can suffer from being too long and including too many issues, but they may even be more problematic when they are too short. The development of hand-held messaging technologies has resulted in the creation of a new "chat" language better suited to small screens. For example, in December 2008, Webopedia reported that there were over 1000 chat abbreviations. Unfortunately, often the same abbreviations are used to mean different things, depending on the online group that is using the abbreviation. O might mean Over, or Opponent to an online gamer, or "hugs" when used by friends (Text Messaging & Chat Abbreviations, 2010).
Unfortunately, as people become more and more accustomed to using these types of chat abbreviations, they have begun to filter into the workplace, where they can cause confusion. Therefore, although it may seem old-fashioned and cumbersome to those experienced in instant messaging, standard spellings are more appropriate for communicating in organizations.
Although changing technology has made it much easier to communicate across distances, there is no real substitute for face-to-face meetings, especially during the early stages of group formation. Box M2.1 talks about the importance of physical presence for building relationships.
Objective | This in-box exercise gives you a chance to analyze a typical pile of messages and documents that might appear on a manager's desk. | ||||||||||||
Directions | Imagine that, as the afternoon shift manager in a manufacturing plant, you have received the following documents during the previous few hours. Some are waiting for you in your email inbox. Others are physical documents resting in the in-basket on the corner of your desk. Using the Traffing method, first decide whether you would Toss, Refer, Act, or File these documents. For the items that you marked as Act, note whether they are Important and Urgent (I/U), Important but Not Urgent (I/NU), Not Important but Urgent (NI/U), or Not Important and Not Urgent (NI/NU). Then, rank the Act items in the order that you plan to do them. Don't worry, for the moment, that you lack contextual details on each of these items. Just do your best to think through how and why you would respond to each item. You may find it helpful to put your responses in a table like the one below:
After you have done this task on your own, your instructor may ask you to discuss and defend your choices in a small group. See how much agreement your group has in "Traffing." Disagreement is not uncommon in this exercise. People's choices are based on their assumptions about the situation, as well as their attitudes toward delegating responsibility and their own priorities, which reflect their personal values.
| ||||||||||||
Reflection | In the directions for this exercise, we told you not to worry about the contextual details. In reality, of course, context is very important for deciding the relative priorities of tasks. Taken out of context, a sign-up sheet for a blood drive might seem unimportant, but within the culture of a health organization or the Red Cross, that activity might take on much more importance as a symbolic act in support of the values of the organization. Similarly, although the shift manager may not need to do anything with the accident report, she may decide to file it rather than toss it. Why? Because symbolically, tossing the report might suggest a lack of concern for employee safety. |
Objective | The purpose of this exercise is to help you identify where you fit within your organization and how you are connected to other areas. Understanding how the different parts of your organization fit together can help you more effectively apply some of the other competencies that you are studying. For example, with regard to organizing information flows, understanding the overall organization structure will help you identify where you should seek information as well as where you should send information. |
Directions |
|
The formal structure found in most organization charts is often only a modestly accurate representation of how things actually work. Effective managers need to understand not only the official roles and responsibilities in the organization, but also need to recognize the informal networks that can help (or hinder) task accomplishment. |
More than 20 years ago, the authors of Made in America: Regaining the Productive Edge argued that to be successful in the global economy, U.S. companies needed to have greater functional integration and less organizational stratification because functional silos often result in inefficiencies in communication and coordination, the very functions that hierarchical structures were intended to support (Dertouzes, Lester, Solow & the MIT Commission on Industrial Productivity, 1989). Over the next 10 years, many companies attempted to heed that advice. Reengineering the Corporation by Michael Hammer and James Champy (1993) became a best-seller. Companies began to establish teams made up of specialists from different functional areas. These cross-functional teams became especially popular, in part because they did not require excessive disruptions to the existing organizational structure. The results of cross-functional teams, however, did not always live up to their promise. For example, a study looking at 93 research and new product development teams found that functional diversity, per se, did not improve team outcomes. It was only when external communication increased due to "having members with diverse backgrounds and areas of expertise and diverse contacts with important external networks of information" that benefits were realized (Keller, 2001).
Despite growing evidence that cross-functional teams are not a panacea, their use continues to grow, driven in part by the changing nature of work (Cross, Ehrlich, et al., 2008) New technologies that allow work to be done around the globe have become increasingly affordable. Companies have outsourced activities and depend on other organizations to do tasks that were formerly handed internally. These changes have resulted in additional flexibility and also resulted in additional costs that need to be accounted for and controlled. "Teams today are frequently formed and disbanded rapidly, distributed across multiple sites, and composed of members simultaneously working on myriad projects, with different bosses, competing for their attention. Further these teams' work increasingly demands substantial coordination and integration of specialized expertise within and outside of the team" (Cross, Ehrlich, et al., 2008).
As described in the next section, working in and managing these types of cross-functional teams poses new challenges compared to working in a traditional functional organization. An additional set of challenges is faced when working in organizations with potentially competing divisions, a topic we address in the subsequent section.
Following the principles of Adam Smith and Henri Fayol, organizations have traditionally organized work by creating departments that handle the different functions of the organization. When departments within a single organization are structured differently so that they can each approach their own task in a way that is most efficient for that particular department, we refer to this as differentiation. In traditionally designed organizations, differentiation is accomplished through the creation of specialized jobs and work units that are then organized hierarchically. Within this hierarchical system, labor is divided up so that individual contributors perform the organization's work. Consistent with this approach, performance-management and reward systems focus on the individual performer. Job evaluations and job descriptions clearly specify who does what and who reports to whom. Status differentiations are made clear by labels such as "labor" and "management," "bonus eligible" and "bonus ineligible," and so on. Organizational subunits typically consist of individuals with similar expertise performing similar tasks—engineers engineering, marketers marketing, and manufacturing experts manufacturing.
Although there is no question that differentiation can result in improved efficiency in many situations, it does have some negative consequences that result from employee self-interest. For example, employees concerned about their careers often become focused on moving up the hierarchy, rather than on adding value to the output of the organization. Because budget size and the number of people one manages are symbols of position and power, managers may make decisions that are more consistent with increasing their hierarchical control than in delivering products or services to a customer (Mohrman, 1993).
Even if all employees were willing and able to subordinate their own individual interests to the general interests of the organization (as Fayol's principles of management required), there would still be costs associated with differentiation. An organization that is differentiated as a consequence of its traditional structure will eventually need to coordinate or integrate the work that is being done across units. Differentiation and integration can be likened to the flexibility and control dimension in the Competing Values Framework—both are needed even though they may appear to be diametrically opposed.
Integration is primarily accomplished by processes inherent in the organizational hierarchy. Processes and procedures are standardized and formalized, specifying how the work is to be done and the sequence by which it is to proceed through the organization. Individual contributors are managed, directed, controlled, and coordinated by middle-level managers who receive strategic guidance from senior-level executives. These types of integrative processes work fairly well for relatively simple and static situations, but it has long been known that their effectiveness is limited in complex, dynamic, and turbulent environments (Galbraith, 1973). For example, in 1993 Mohrman argued that organizations had to simultaneously:
Achieve multiple focuses (on product, market, customer, and geography) without segmenting the organization in a dysfunctional way.
Align individuals and groups that are task-interdependent in a manner that fosters teamwork in pursuit of shared overall objectives.
Enable quick, low-cost, high-quality performance while responding to a highly dynamic environment that calls for ongoing change.
Respond to ongoing increases in competitive performance standards by learning how to be more effective.
Attract, motivate, develop, and retain employees who are able to operate effectively in such a demanding organizational environment.
Taken together, these goals pose several paradoxes for managers. How can we be focused if we are trying to address multiple sets of needs? How can we evaluate individuals when they are working in teams? How can we keep quality high while we are working faster and cheaper? How can we keep costs down if we are constantly changing standards? How can we find employees who will stay committed when the organization is constantly changing?
Because most people see paradoxes in terms of either/or decisions, it is not surprising that some organizations attempted to respond to these challenges by "throwing away their organizational charts in favor of ever-changing constellations of teams, projects, and alliances" (Dumaine, 1991, p. 36). Other organizations have attempted to manage these challenges within more traditional structures; some have gone back and forth, at times favoring cross-functional diversity and at times retreating to more specialization (Sapsed, 2005). Theoretically, incorporating cross-functional teams into a traditional structure can provide the integration solution to the need for integration in differentiated organizations, but like so many good ideas, this solution comes with its own set of challenges.
Parker (1994) identified a number of challenges for cross-functional teams, particularly those that are formed as a result of a need to respond quickly to competitive pressures. Lack of clear and consistent support from senior management can undermine the best efforts of any cross-functional team. One type of support that can be valuable is having a physical space for the team. Co-locating team members has symbolic, as well as substantive benefits. Cross-functional teams also suffer when all of the relevant functional areas do not become involved early in the process. Projects that start out in one functional silo and then try to add team members from other functional areas may end up with teams where there is a lack of trust. Cross-functional teams can also be hindered if the allocation of work across functions seems inequitable or is inefficient, or if decisionmaking processes are not clearly defined. With respect to product development teams, making sure that the team moves quickly based on customer input is often a challenge because team members are typically still engaged in working on tasks associated with their functional area. Despite all these challenges, cross-functional teams can be a valuable tool in organizations, if they are effectively managed.
What is needed is a set of processes and devices that are consistent with the complex and dynamic environment that the organization faces and that allow organizations to integrate and coordinate their efforts, regardless of the formal structure of the organization. In essence, managers today need to be able to create ad hoc structures that can both transcend and operate within a traditional organizational design. The guidelines below can be helpful in accomplishing that objective.
The guidelines below are derived from Dumaine (1991), Meyer (1993), and Parker (1994).
Clarify goals and charter and get team buy-in. The cross-functional team will generally take the formal charge from senior management, but the team must also feel ownership over the goals. In the Managing Groups and Leading Teams competency in Module 1, we discussed the importance of being committed to a common goal or purpose and indicated that this is the glue that holds the team together. Sometimes the cross-functional team will need to meet with senior management to negotiate the goal or to make sure that there is a shared understanding.
Seek to create a critical mass of leadership. While a single functional unit can generally get by with a single leader, most cross-functional teams cannot. If the ultimate purpose of cross-functional teams is to make optimal use of people from different functions, each of these functions must have a strong leadership voice. In addition, this is a good time to take advantage of team members' unique talents (Buckingham, 2005).
Hold the team and its members accountable for its performance. Once team members have bought into the goals, they must also buy into the process. Everyone must feel responsible for the team's performance. Team goals should be translated into clear short-term objectives and milestones that are constantly visible and in the forefront of everyone's thinking. While senior management should avoid micro-managing, they should hold the team to standards. When standards are not met, questions should be raised in such a way that team members feel supported rather than attacked.
Keep cross-functional teams as small as possible with critical functional representation. While the purpose of creating a team is to bring together a diverse set of perspectives, years of research on group processes shows that as group size increases, there is a loss of productivity that results from increased time devoted to coordination and communication. One estimate of productivity loss indicates that in groups with as few as five people, between 10 and 30 percent of team members' time is spent communicating with other team members about the task (Parker, 1994). Alternatively, if there is not sufficient representation of all functional areas from the very beginning, the team will not be able to perform effectively. One solution is to break up the large group into smaller groups, with each small group having representation in a central decision-making group. In addition to determining the optimal team size, finding the right mix of people is critical. If all functional areas are represented, but one team member cannot see the value of working on a cross-functional team, size will quickly become a secondary issue.
Provide the cross-functional team with constantly updated and relevant information and the authority to make decisions. If an organization is to make heavy use of cross-functional teams, it must essentially rewire the information system so that cross-functional teams have ready access to the information they need to do their jobs. Teams also need what was formerly assumed to be the prerogative of management: the authority to make decisions.
Train members in teamwork and process management. Operating in cross-functional teams with complex and fuzzy authority and reporting relationships necessitates that members know the core skills of teamwork. In Module 1, Competency 4, "Managing Groups and Leading Teams," we presented some of these core skills, including defining roles and responsibilities, using participative decision-making, and managing meetings. As was noted in that competency, teamwork does not develop naturally. There needs to be a conscious effort to develop as a team, and organizations must often be willing to make the investment to give people training in interpersonal skills.
Clarify expectations within and between teams. Each individual who is part of a cross-functional team has three responsibility perspectives: the team, the function, and the larger organization. Each of these should be clearly articulated before the start of the project. Moreover, leaders of cross-functional teams must have the ability to develop effective relationships with key stakeholders, including leaders of functional departments, senior management sponsors, and other resource people in the organization. The next competency in this module, Planning and Coordinating Projects, presents the notion of internal and external integration and suggests that regular communication with key project stakeholders is an important element of managing projects. This is even more true if the project is being carried out by a cross-functional team, where the definition of who is internal and who is external can become somewhat blurred. While it is clear that all organizations have multiple and often competing goals, these competing goals must not become a barrier to effective cross-functional team management. An organization will be able to use cross-functional teams effectively only if team members and others in the organization identify primarily with the larger organization and only secondarily with their functional units.
One step that is often useful here is the co-location of team members. That is, whenever possible, cross-functional team members should be located as close as possible, "in the same building, on the same floor, and in the same area" (Parker, 1994, p. 78). Physical proximity allows for more regular and more informal interactions. Co-locating team project members also sends a very clear message regarding the importance of the project.
Encourage team members to step out of their roles. As a corollary to the previous guide-line, we suggest that people must not only be willing to step out of their functional identity to "put on an organizational hat," they must also be willing to step out oftheir status or rank identity to allow for more optimal use of everyone's unique skillsand abilities. As noted in the second guideline, the increasing use of cross-functionalteams suggests that more and more, "leaders" on one project will be "followers" on the next. In sum, the most successful teams are ones that are able to manage the paradoxes that are associated with having clearly defined roles and responsibilities, while simultaneously expecting that everyone will step up when necessary to ensure that everything that needs to be done, is done.
Identifying the right members for a cross-functional team depends on a number of variables, as noted in the guidelines above. In addition to considering the technical skills of team members, however, it is also wise to consider their interpersonal skills. As we have seen, working effectively on a cross-functional team can be very challenging. The complexity of the task itself often pales in comparison to the political issues that tend to emerge when managing across functions. In these types of situations, it is helpful to have individuals on the team who are not only energetic themselves, but who tend to energize the people around them. Empirical research from the field of network analysis has identified a key variable "energizing relationships" (Baker, Cross & Wooten, 2003) that is worth considering when creating cross functional teams.
Most people have had the experience with working with someone whose enthusiasm, optimism, and vitality seem to charge up everyone around them. Intuitively, we know that these are the kinds of people whom we want working on important projects. Network analysis research confirms that intuition and goes further to suggest that the ability to develop energizing relationships "may be more important than occupying certain positions in an information or communication network" (Baker et al., 2003, p. 339).
Recent work on the concept of "lift" provides additional insights into the characteristics of individuals who may be likely to create energizing relationship. In their book Lift: Becoming a Positive Force in Any Situation, R. W. Quinn and R. E. Quinn define "lift" as "influence, an uplifting effect we have on others." This definition is consistent with Baker et al.'s concept of energizing relationships. The authors go on to identify four key thoughts and feelings that, when present, cause individuals to feel uplifted and to lift the people around them. Specifically, individuals feel uplifted and lift the people around them when they are:
purpose-centered — they have a purpose that is not weighted down by needless expectations [Compete];
internally-directed — they have a story of how their personal values will guide their actions [Control];
other-focused — they feel empathy for the feelings and needs of others [Collaborate]; and
externally-open — they believe that they can improve at whatever it is they are trying to do [Create] (Quinn & Quinn, 2009, p. 3).
As noted in the brackets after each factor above, these four key thoughts and feelings map directly onto the action imperatives in the competing values framework, a point we address in more detail in the concluding chapter of this text. Further information on the concept of "lift" also can be found at http://www.leadingwithlift.com.
Unfortunately, like the manager in the Analysis that follows, you will not always be able to choose the members of the teams with which you work. Fortunately, you can have much more control over your own thoughts and feelings.
ANALYSIS Errors in the Design?[5]
Directions | Read the paragraph below. It comes from a real situation encountered in one of the Big Three U.S. automobile manufacturers. Diagnose the errors that might have been made in managing across the various functional areas that were involved in designing the automobile. The total amount of electrical power in a vehicle is determined by the capacity of the alternator. The power must serve over twenty subsystems, such as the stereo, the engine, the instrument panel, and so on. These subsystems are developed and controlled by separate "chimney" organizations, and power allocations must be made for each subsystem. The problem was, in this vehicle program, when the requirements of all the chimneys and teams were added up, they equaled 125 percent of the capacity of the alternator. Keith, who had recently taken over as head of this vehicle program (which had made changes in direction and was behind schedule to begin with), called a meeting of the Program Steering Committee designed to resolve this conflict and reach a compromise. However, many of the chimney representatives who were members of the team came to this meeting with instructions from their bosses [who, incidentally, did their performance appraisals] not to make any compromises, but to make certain that their chimney "got what it needed" and "didn't lose out." After Keith presented the group with the problem and the need to reach a compromise solution, their response surprised him: "It's not our problem," they replied, "it's your problem." |
Questions |
|
Reflection | For people who have not experienced the type of situation described above, the story seems almost unbelievable—How could members of the same organization not recognize the importance of coming up with a vehicle design that would actually work? For far too many employees, however, this type of situation rings all too true. Consistent with a sociotechnical systems perspective, organizational structures and processes can result in inefficiency and even divisiveness if people do not understand and respect the interconnections among all functions in the organization. |
Objective | Many events require cooperation across different groups, but special issues often come into play when the groups involved are made up of volunteers. In this exercise you need to think not only about the task issues, but also the people issues given the volunteer nature of the groups who will be participating in the event. |
Directions | You are president of the University Students Services Association (USSA). USSA is a student-run organization that coordinates the activities of all other student-run organizations on campus. USSA monitors scheduling of all extracurricular activities, tracks consistency of student organization activities with university policy, and attempts to provide resource support whenever possible. In the past, each major university organization—such as Academic Support Services, the USSA, the Student Health Services, the Honor Society, and so on—conducted its own new-student orientation during the general orientation prior to the beginning of the fall semester. These orientations typically lasted anywhere from one to three hours and included speeches, presentations, videotapes, and workshop-type activities. For most organizational units, these orientations were seen as an opportunity to publicize the way in which they contributed to students' experience of university life. Organizational units spent a great deal of time, effort, and attention in preparing their individual orientations, because they felt it was important for students to learn about how they might take advantage of the services provided. Organizational units took great pride in conducting a professional presentation and paid close attention to the evaluations that students completed. In fact, there was something of an informal competition among the units, with each trying to be the most innovative in its presentation. This year the provost has decided to try a new approach, declaring that all student orientation sessions will be centrally coordinated and run over a three-day period during the first week of classes. You have been asked to head the team that coordinates this orientation. Your first task is to prepare a one-page outline of how you will approach this new responsibility. After you have completed the outline, respond to the process questions below. |
Process Questions |
|
Reflection | Planning, of course, is only the beginning. Before any plan can be implemented, people will need to be convinced to go along with the plan. This is where the competencies such as Championing and Selling New Ideas and Negotiating Agreement and Commitment (see Module 4) come into play. |
Objective | This exercise is intended to prime your thinking about effective project management by encouraging you to reflect on your past project experiences. |
Directions | Think about a project or event you have worked on, preferably one in which you had some leadership responsibility. (Note that having leadership responsibility does not necessarily mean that you were the sole project leader.) Think about the planning and coordination, and respond to the questions below.
|
Reflection | As we noted in Module 1 in the Managing Groups and Leading Teams competency, when a project is assigned there is often a tendency to try to skip over the planning and coordination tasks, and to dive directly into working on the project. Effective managers recognize that this is a mistake. Looking back at your prior experiences with project work gives you an opportunity to identify any points where planning and coordination broke down. As you read the Learning material for this competency, think about whether the tools and techniques described would have helped you to avoid those problems. |
World-class organizations must be adaptable and flexible to succeed. What worked yesterday may not work today. As we have seen in the competing values framework, flexibility needs to be balanced with stability. To be more flexible, improve performance, and prepare for the future, many organizations are coming to rely on nonroutine projects (Anatatmula, 2008). To balance that flexibility, projects are assigned specific objectives, starting and ending times, and a predetermined budget. In the end, financial stability depends both on identifying the correct projects from a strategic perspective (a topic we take up in Module 3) as well as on effective and efficient project management (Schmid & Adams, 2008). In this competency we discuss some tools that can be used when planning, directing, and controlling resources to meet the technical requirements, cost targets, and time constraints of a project.
Although projects were originally used primarily in the military and construction industries (Baltzan & Phillips, 2008), changes in the economy, heightened competition, increased complexity in organizational environments, and rapid technological changes have created ideal conditions for project teams to spread to other organizational areas. For example, human resource managers benefitted from using project management tools when Life Technologies Corp, a biotechnology tools company, was created as the result of a merger of two smaller organizations (Robb, 2009). Today, project management concepts are being applied in a diverse array of industries, including pharmaceuticals, banking, hospitals, law, state and local governments, and the United Nations (Kerzner, 2009).
Project teams are seen as an ideal approach to deal with the need to respond more quickly to changes in the turbulent business environment for several reasons. First, project teams are task focused, thus complementing the way many organizations allocate work—through tasks. Project teams also enable companies to engage the work through the use of cross-functional teams, as discussed in the previous competency in this module. Lastly, because project teams make use of resources borrowed from within the firm, and perhaps also from outside the firm, they are flexible and able to act and react quickly to change (Frame, 1999).
Harold Kerzner, one of the leading authorities on project management, summarizes the five different process groups included in the PMBOK® Guide from the Project Management Institutes as follows:
Project initiation
Selection of the best project given resource limits
Recognizing the benefits of the project
Preparation of the documents to sanction the project
Assigning of the project manager
Project planning
Definition of work requirements
Definition of the quality and quantity of work
Definition of resources needed
Scheduling the activities
Evaluation of the various risks
Project execution
Negotiating for the project team members
Directing and managing the work
Working with the team members to help them improve
Making adjustments
Project monitoring and control
Tracking progress
Comparing actual outcome to predicted outcome
Analyzing variance and impacts
Making adjustments
Project closure
Verifying that all of the work has been accomplished
Contractual closure of the contract
Financial closure of the charge numbers
Administrative closure of the paperwork
(Kerzner, 2009, p. 3)
In this competency, we focus on planning and monitoring; activities associated with the other three categories (initiation, execution, and closure) are addressed in other competencies in this text. For example, communication skills are considered one of the most critical skills for project managers (Henderson, 2008).
The various tools of project planning and project monitoring that we focus on for this competency are closely tied. Planning clarifies the work to be accomplished and sets priorities for task completion. Planning involves scheduling—establishing timetables and milestones for completion—and resource allocation—developing a budget that forecasts the amount of labor and equipment that will be needed. Alternatively, monitoring tracks progress to see whether the project is proceeding as planned. Is the schedule being adhered to? Are milestones being met? How likely is the project to be completed within, or even under, the projected budget? In the next two sections, we will present several key planning and monitoring tools. It should, however, be noted that the monitoring tools will be useful only if the planning has been conducted carefully, with sufficient attention to detail.
Project planning is not simply deciding on an outcome to be achieved. Project planning should make clear the path the project is expected to take as well as the destination. Consequently, the planning process should focus attention not only on the goals and objectives of the project but also on such issues as the technical and managerial approach, resource availability, the project schedule, contingency planning and re-planning assumptions, project policies and procedures, performance standards, and methods of tracking, reporting, and auditing (Badiru, 1993). It is thus evident that planning is far more complex than scheduling. Indeed, while scheduling is considered a key element of coordination, it is actually the last step of the planning process and depends on the existence of a precise statement of goals and objectives, accompanied by a detailed description of the scope of work. Below we present some of the key planning tools available to the project manager, with the order of presentation based on the order in which they are likely to be used.
Today, many of these tools can be found in project management software programs such as Microsoft Office's Standard Project 2007 and Enterprise Project Management (EPM) Solution. These types of products incorporate the basic planning tools discussed below and simplify planning, monitoring, and coordinating processes by integrating all data relevant to the project. For example, data associated with the Statement of Work and Work Breakdown Structure (discussed below) related to specific tasks, working times, schedules, deadlines, people, materials, machines, and so on can be entered into computerized templates. During the data entry process, the software can also provide prompts to help establish the order in which work needs to be completed if two tasks are dependent. As data on tasks, times, and schedule are entered, the computer can generate PERT and Gantt charts, as well as other types of reports. Because not every organization requires a full-blown project management software system, a variety of other programs have been developed to address users with different needs. One example is Basecamp, a web-based program available by subscription from 37signals. The program's "to-do list" feature is used to enter information traditionally found in the Statement of Work. Milestones and a time tracking feature are available to help monitor progress. Although Basecamp lacks the capacity to produce PERT and Gantt charts, its ease of use appeals to its clients. Because new project management software and features are constantly being developed, we do not attempt to provide instruction on how any particular program works. Rather, we focus on explaining the fundamental concepts upon which those programs are based.
The statement of work (SOW) is a written description of the scope of work required to complete the project. It should include a statement regarding the objectives of the project, brief descriptions of the services to be performed and the products and documents to be delivered, an explanation of funding constraints, specifications, and an overall schedule. Specifications should be included for all aspects of the project. They will be used to provide standards for determining the cost of the project. The overall schedule should be more general, including only start and end dates and key milestones.
The statement of work may also include brief descriptions of the tasks necessary for project completion as well as a description, where appropriate, of how individual tasks will be integrated into the whole. Alternatively, this information may be included in the work breakdown structure.
The work breakdown structure (WBS) shows the total project divided into components that can be measured in terms of time and cost. It may be presented in tabular or graphical form, or both (see Figures M2.2A and M2.2B). Whether in tabular or graphical form, the WBS divides the project into a series of hierarchical levels; in graphical form it resembles an organizational chart of tasks (rather than positions). The complexity of the project and the degree of control desired during project monitoring will determine the number of levels. Badiru (1993) suggests starting with three levels, with level 1 being the final or total project, level 2 being the major tasks or subsections of the project, and level 3 containing definable tasks or subcomponents of level 2. Again, if the project is very complex, the WBS should include additional levels, until the final level specifies discrete activities that can be examined in terms of the time and cost required to complete the activity.
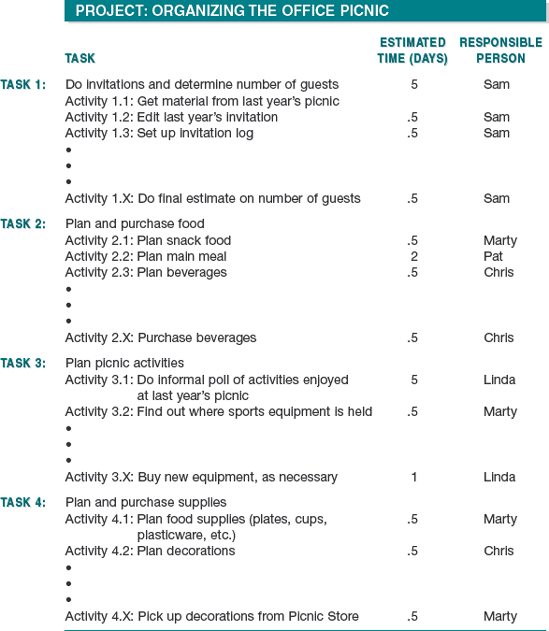
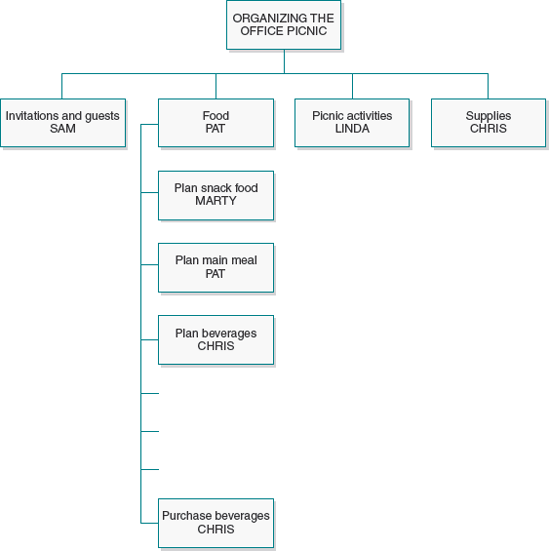
At the final level, the work breakdown structure should include at least two pieces of information that are needed for coordination of effort: the estimated time to complete the activity and the name of an individual who is responsible for seeing that the activity is completed. Often a third piece of information, the estimated cost of completing the activity, is also included. This allows for better integration of cost and schedule information needed to monitor the project. When cost information is included, people refer to the work breakdown structure as a costed WBS. Time and cost estimates should be developed by the persons most knowledgeable about those specific activities. Thus, if project team members come from different functional areas, the project manager should likely consult with managers from those different functional areas before making time and cost estimates.
The WBS provides information on the estimated time of completion for each individual activity, but it does not indicate the order in which the activities can or will take place. It does not indicate whether Activity A must be completed before Activity B can proceed, or whether the two can proceed concurrently. When a project is fairly simple, these interrelationships are not difficult to discern, and a schedule can be constructed directly from the WBS by laying out the activities in the order in which they are to be carried out (see the section on Gantt charts, later in this competency). Alternatively, when a project is complex, it is almost impossible to construct a schedule before the interrelationships among the various activities are made explicit. Network diagrams are graphical tools for making these interrelationships explicit.
In the late 1950s, Program Evaluation and Review Technique (PERT) and Critical Path Method (CPM), were developed to help with project planning. PERT was introduced by the Special Projects Office of the United States Navy in 1958 as an aid in planning (and controlling) its Polaris Weapon System, a project that involved approximately 3,000 contractors. At virtually the same time, a similar technique, CPM, was introduced by the DuPont Company. The methods are very similar and essentially show the flow of activities from start to finish. Over the years, the two methods have essentially merged and people often refer to PERT/CPM diagrams and/or analysis. As project management computer software has become more sophisticated, other similar approaches have been developed that provide more accurate time estimates, but PERT and CPM are still traditionally used to introduce the basic network diagramming concepts (Dodin, 2006).
PERT/CPM diagrams allow the project manager to see the flow of tasks associated with a project by showing the interrelationships between activities. These diagrams allow the project manager to estimate the time necessary to complete the overall project given the interdependencies among tasks and to identify those critical points where a delay in task completion can have a major effect on overall project completion. In performing the PERT/CPM analysis, one assumes that all tasks or activities can be clearly identified and sequenced and that the time necessary for completing each task or activity can be estimated.
Figure M2.3 shows a simple PERT/CPM diagram. In the diagram, arrows designate activities. The circles at the beginning and end of the arrows are referred to as nodes; they designate starting and ending points for activities. These points in time, called events, consume no time in and of themselves. An activity is referred to as Activity i,j or Activity i-j, where i is the start node and j is the end node. Because of the way the diagram is constructed, the PERT/CPM diagram is sometimes referred to as an arrow or activity-on-arrow network diagram. Alternatively, activity-in-node network diagrams, as the name implies, place the activities within the node (usually drawn in boxes) and use the arrows simply to show the necessary ordering of activities. In activity-on-arrow diagrams the numbers along the arrows indicate the expected time for the activity to be completed. Although these numbers may come directly from the WBS, it is customary to calculate an expected time for activity completion (te), using a weighted average of an optimistic time (to), a pessimistic time (tp), and the most likely time (tm) using the following equation:
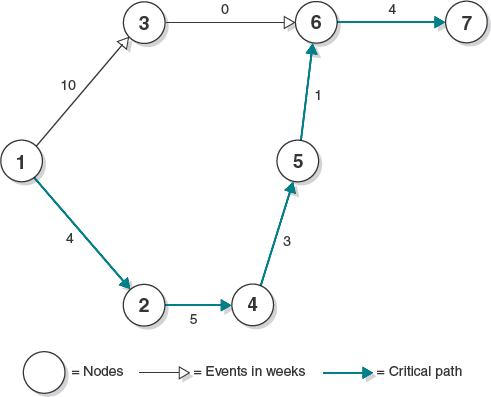
Note that Activity 3,6 has an expected time of zero weeks. This type of activity, called a dummy activity, is used to indicate that Activity 6,7 cannot begin until Activity 1,3 is complete.
The critical path is that chain of activities that takes the LONGEST time to proceed through the network. It indicates the least possible time in which the overall project can be completed, and it is the path that needs to be watched most carefully to ensure that the project stays "on track."
To identify the critical path, it is necessary to understand the concept of slack or float. In Figure M2.3, the critical path, 1-2-4-5-6-7, takes 17 weeks from start to finish. Note, however, that there is another path, 1-3-6-7, which only takes 14 weeks from start to finish. This means that Activity 1,3 could begin three weeks later than Activity 1,2 and the project would still be completed on time, assuming, of course, that the time estimates are fairly accurate. We then say that Activity 1,3 has a total float or slack of 3 weeks. While this is easy to see in Figure M2.3, it requires more effort when the diagram is more complex.
The first step in identifying the critical path is to identify the earliest start and finish times. Start at the first node of the diagram; this has an earliest start time of zero.
For the other nodes, the earliest start time equals the earliest finish time of the previous activity. For all activities, the earliest finish time is the sum of the earliest start time plus the estimated time of the activity.
Next, take the largest finish time for the last node and calculate the latest start and finish times by starting at the last node and subtracting the estimated time for completion of that activity from the latest finish time of the previous activity. To identify the critical path, make a list of latest finish times and earliest start times. Time available is then calculated as the difference between the earliest start time and the latest finish time. If available time is equal to the estimated time for completing the activity, there is no float, and that activity is on the critical path. Table M2.1 shows the calculations.
As indicated above, the critical path is important because it is that path that must be most closely monitored. It is the path for which there is no slack, and activities must begin and end on time in order for the project schedule to be met. Activities that are not on the critical path can begin any time between the earliest and latest start dates. The determination is usually made in accordance with the availability of resources, primarily human resources.
Because projects typically require trade-offs among cost, time, and quality, project managers often need to estimate different approaches to the project. Project-crashing analysis can be used to help estimate the trade-offs associated with expediting a particular project by reviewing the costs associated with reducing the amount of time to complete the tasks on the critical path by adding additional resources.
The ultimate purpose of project management is to obtain the most efficient use of resources while still achieving project objectives (being effective). Efficient use of resources can be a problem, however, if there are wide swings in resource needs. Even on carefully planned projects, there may be times when team members feel they can't get enough done as well as times when team members find they do not have enough to do (House, 1988).
Resource leveling is "the process of scheduling work on noncritical activities so that resource requirement on peak days will be reduced" (Kimmons, 1990, p. 79). Resources here refers to all project resources that are limited within a specified time period, including personnel, equipment, and materials; resource leveling is most often used to allocate personnel to different project activities. One approach to maximizing the use of people is to use the information from the WBS, together with the information regarding the amount of float, to schedule activities that are not on the critical path.
To determine the optimal use of resources, the project manager needs to begin by assuming that all activities will begin at their earliest start dates. Based on this assumption, the project manager can then draw a graph showing the required personnel, by job type (title), over time. This graph will show peaks, times when there is a great amount of work to be done, and valleys, times when there is less work to be done. Using the PERT/CPM diagram and the table that gives the float associated with each activity, the project manager can then level the resources by moving the start dates for some of the activities that have float to a later time (but prior to the latest start date). The process continues until the changes in personnel requirements from one time period to the next are minimized, that is, until the peaks and valleys are evened. Of course, this type of manual resource leveling is extremely difficult on large, complex projects. Fortunately, in 1986, the resource-leveling paradigm was revolutionized when Primavera Software, Inc. developed an automatic resource leveling tool (Nosbisch & Winter, 2006). Since that time, other automatic resource leveling tools have greatly improved the ability of project managers to deploy resources more efficiently.
The most popular tool for visually displaying project activities across time is the Gantt chart, developed by Henry L. Gantt in the early part of the twentieth century. These charts are essentially bar charts that allow you to see at a glance how the different activities fit into the overall schedule.
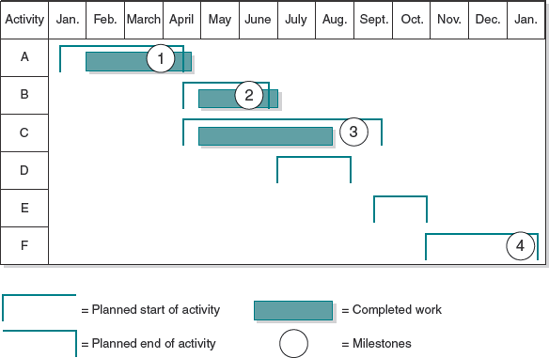
A Gantt chart includes a timeline and a list of each of the major activities, grouped as they are in the work breakdown structure and sequenced as they are expected to occur as a result of the PERT/CPM and resource leveling analyses. The time line for the project is shown along the horizontal axis; the list of activities along the vertical axis. For each activity, a bar shows the time commitment (see Figure M2.4). The Gantt chart is most useful when each activity time is commensurate with the units of time drawn on the horizontal axis. That is, if the horizontal axis is drawn in terms of months, most activities should take at least two months. You can also identify specific milestones, or points of accomplishment, within each task by using a circled number within the bar. In Figure M2.4 the milestones could represent first drafts of status reports due at the end of the activity. While advanced project management software can be used to create Gantt charts, they can also be created in spreadsheet programs such as Microsoft Excel by using a stacked bar chart (Baltzan & Phillips, 2008).
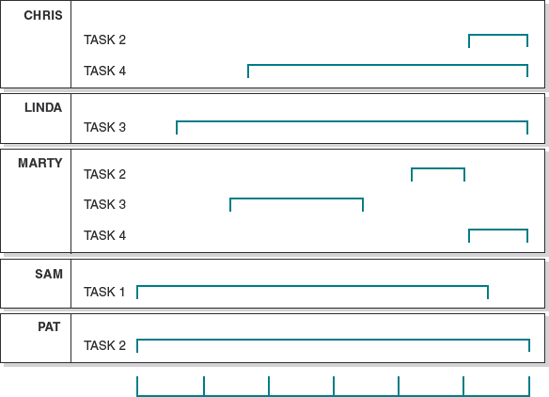
Specialized Gantt Charts. Once the Gantt chart is constructed, it can be used to integrate information about projected use of time with information about projected use of other resources. Two types of integrated Gantt charts are commonly used. The first shows personnel task assignments. By listing each individual along the vertical axis, followed by all of the tasks/activities to which that individual is assigned, the project manager can see at a glance which tasks/activities each person is assigned to at each time period of the project (see Figure M2.5). If the task distribution across individuals is uneven or if some individuals were mistakenly given too many work assignments during a single time period, this chart gives the project manager another chance to redistribute task assignments.
The second type of integrated Gantt chart is the Bar Chart Cost Schedule (not illustrated). This Gantt chart simply shows the projected cost of each activity below the bar showing that activity in the overall Gantt chart. This allows the project manager to have some sense of how much money is projected to be spent in each time period. It also allows the project manager to calculate the cost slope by dividing the cost of the activity by the duration of that activity (in whatever unit of time is being used). Thus, for example, if Activity A costs $4,500 and is expected to take three weeks to complete, the cost slope in dollars per week is $1,500. While this piece of information is not interesting in isolation, it becomes interesting when the project manager compares it to the cost slopes of other activities because it gives a sense of the relative cost of activities per time period.
Gantt Charts as Monitoring Tools. The Gantt chart is also a useful project monitoring tool. By using different colors or different symbols, the Gantt chart can help the project manager track how closely the project is keeping to the planned schedule. When a given task runs over the allotted time, the Gantt chart can be used to determine whether or not the schedule needs to be rethought. Figure M2.4 shows that Activities A and B ran over schedule approximately one week each, whereas Activity C was completed almost one month ahead of schedule.
One final planning tool is the human resource matrix. As with the Gantt chart used to show the personnel task assignments, this matrix can be used to see whether workload is evenly distributed across individuals. The human resource matrix lists the tasks/activities along the vertical axis and the names across the top of the matrix (see Figure M2.6). For each task/activity one person is designated as having primary responsibility (P), and others may be designated as having secondary responsibility (S). Other designations can be also be added as needed. For example, one can label an individual as (C) if that individual needs to be consulted, or (B) if a person can provide backup, and so on. Project teams need to be able to adapt the project management tools to best meet their needs.
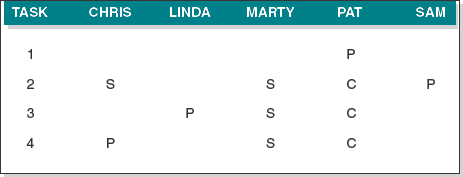
One advantage of this chart over the personnel task assignment chart is that it is clear whether or not time spent on the project is time in a leadership capacity. Further, it makes it clear at a glance whether someone has too many leadership (primary) assignments. Alternatively, while it tells who is assigned to which task/activity, it is not as informative as the personnel task assignment chart with respect to how much time is being spent during each time period by each person. Therefore, it is probably wise to use the two charts together for keeping track of how human resources are being utilized.
As indicated in the beginning of this section, monitoring is essentially keeping track of progress over the life of the project. There are four primary resources that need to be monitored: time, money, people, and materials. Monitoring involves looking at actual expenditures of resources, comparing actual with estimated, and, where necessary, deciding what adjustments need to be made in the work plan to accommodate discrepancies between actual and estimated.
In the previous section, we gave examples of planning tools that can be used in monitoring the use of human resources and time. Here we will focus on the project budget and time. Note that the tools provided here can be used to look at the total budget or at specific components of the budget, and so they are applicable to monitoring the use of human resources and materials as well.
Cost Variances. In monitoring the budget, the project manager is concerned with two types of information. The first involves the amount of money budgeted for the work to be performed (budgeted cost of work performed—BCWP) versus the actual cost of performing the work (actual cost of work performed—ACWP). The difference between the two quantities (BCWP—ACWP), called the cost variance, is an indication of how close the estimated costs were to actual costs, with a positive number indicating monetary savings and a negative number indicating a budget overrun. (Again, note that these variances can be calculated for the total budget or by category of expenditure.)
Schedule Variances. The second type of information involves the amount of money projected to be spent on the actual work performed during the time period (budgeted cost of work performed—BCWP) versus the amount scheduled to be spent during the time period (budgeted cost of work scheduled—BCWS). The difference between the two quantities (BCWP—BCWS), called the schedule variance, is an indication of whether the money is being spent according to the projected schedule. Here a positive number is an indication that the project is running ahead of schedule—that is, more work is being performed than was originally scheduled—whereas a negative number is an indication that the project is running behind schedule—less work is being performed than was actually scheduled. Alternatively, a negative number could be an indication that some work is being performed out of its scheduled sequence. Harrison (1992) suggests that schedule variance should not be looked at separately from the formal scheduling system; that is, this information should be examined in conjunction with the Gantt chart or PERT/CPM network diagram to determine the actual status of specific activities or milestones.
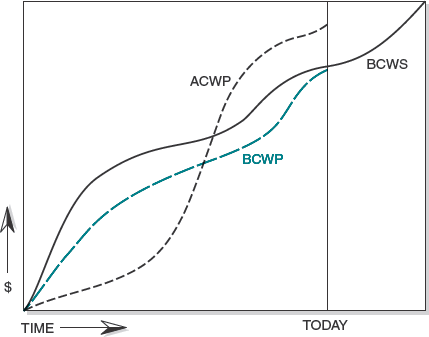
Cost and schedule variances can be examined graphically or in a table. To examine these variances graphically, the project manager needs to calculate at each time period a cumulative BCWS, BCWP, and ACWP. That is, for each reporting period (usually monthly) the project manager needs to calculate the total scheduled budget up to that time period (cumulative BCWS), the total projected budget for the work that has actually been performed up to that time period (cumulative BCWP), and the total budget actually spent up to that time period (cumulative ACWP). The three amounts are plotted at each time period along the vertical axis, with time across the horizontal axis. The points are then connected to make a smooth curve (see Figure M2.7). Note that the cumulative BCWS curve extends from the lower-left corner, where no money has been budgeted to be spent before the beginning of the project, to the upper-right corner, where all the money is budgeted to be spent by the end of the project. When the cumulative BCWP curve lies above the cumulative ACWP curve, then the project is running under budget. Alternatively, if the cumulative ACWP lies above the cumulative BCWP curve, the project is running over budget, and the project manager needs to understand why. Similarly, if the cumulative BCWS lies below the BCWP, then the project may well be running ahead of schedule. Alternatively, if the BCWS lies above the BCWP, then the amount that the project manager expected to spend up to that time period is less than the amount actually being spent, and the project may be behind schedule. In Figure M2.7, the project was initially running under budget but is now running considerably over budget. It was also initially behind schedule, but is catching up.
A performance analysis report presents cost and schedule variance in a tabular form. This report is usually generated on a monthly basis, although, depending on the complexity of the project, it could be done more or less often. The report includes two tables, one with information about performance in the current time period and the second with information about cumulative performance. The first table presents five pieces of information for each category of expenditure: the amount budgeted for this time period (BCWS), the amount budgeted for the work performed (BCWP), the amount actually spent in the current time period (ACWP), and the schedule and cost variance. The second table repeats this format, providing cumulative information.
Again, the project manager should be concerned when the performance analysis report indicates negative cost or schedule variances. In some cases, project variances may be related to scope creep—the expansion of the project requirements beyond the original plan due to small changes that are made over the course of time. Those seemingly small changes can add up to big differences in the scope of a project, so keeping track of them is essential. In some cases, it may be appropriate to renegotiate the terms of the project, so it is critical for project managers to have solid data to justify any request for changes in resource allocations or deadlines.
Objective | This exercise asks you to analyze the tasks in a project using the tools that we have discussed. | |||||||||||||||||||||||||||||||||||||||||||||||||||||||||||||||
Directions | Read the following scenario and respond to the questions that follow. Your instructor may have you work individually or in small groups. Congratulations! You have your first project manager assignment. You were asked to be the project team leader for the team that is going to design a new management training course in your organization. Here is the background information: Last week your boss found your copy of Becoming a Master Manager sitting on your shelf and decided to borrow it. After reading through the book, your boss shared it with the head of the Training and Development (T&D) Unit, and they both agreed that it would provide an ideal foundation for the new management training course that was being discussed. Even though you do not know much about training, they decided that you would be an ideal project manager for the team designing the training since you are familiar with the framework. After receiving the assignment, you met with the head of T&D and agreed on a few basic concepts regarding the training program: (1) The program should run either one week or two; (2) the curriculum should be accompanied by two types of evaluation, one based on participant reaction and one based on the actual changes in work behavior when the participants return to the job; (3) the project team should conduct a needs assessment (i.e., you should interview managers) in the three divisions that will be the heaviest users of the training program to determine what they would like to see included in the curriculum; (4) you should develop some new cases or exercises based on the outcomes of the needs assessment; and (5) you should set up an advisory committee of upper-level managers from across the organization to approve the curriculum and the evaluation instruments. Fortunately, you have some good people on your team from the training unit, and after meeting with them a few times, they volunteered to put together an initial schedule. This morning you found a memo on your desk explaining that they had developed a schedule based on a proposed list of activities with estimated times and a PERT/CPM analysis. The memo indicated that the list of activities, the PERT/CPM network diagram, and a proposed schedule were all attached to the memo, but all you could find was the following list of activities with time estimates:
When you tried calling the team members who drafted the memo, you were told that they were away for the next two days at a training conference and no one else knew anything about what they were working on. You have a breakfast meeting scheduled with your boss and the head of the training unit tomorrow morning to discuss the schedule.
| |||||||||||||||||||||||||||||||||||||||||||||||||||||||||||||||
Reflection | Manually working through examples may seem unnecessary, given the availability of computer software for project management, but working through problems helps project managers develop a clear understanding of the fundamental planning and scheduling concepts on which the software is based. That conceptual understanding is critical for managers, particularly those who wish to obtain credentials in the area of project management from the Project Management Institute (PMI). Five different credentials can be earned from PMI. For each credential, applicants must meet the education and experience requirements and pass an examination. |
Objective | The previous exercise gave you the chance to apply some of the tools of project management, but often it is coming up with the list of tasks that is the most daunting part of the project manager's responsibilities. This exercise asks you to take a step back and figure out on your own what tasks would be required to complete a complex project. |
Directions | The president of the student association has asked for volunteers to organize a job fair, to be held in conjunction with the annual meeting of the Regional Management Association, and you think this is a great opportunity to try out your project management skills. The job fair was discussed during the last meeting of the student association, and there was a general consensus that:
The job fair is three months away.
|
Reflection | In addition to the project planning and scheduling tools discussed in this module, don't forget to take advantage of other resources—particularly existing knowledge. Although planning a job fair might be a brand new task for you, staff members in the Career Services Office at a college or university are likely to be well versed in organizing these types of events and may be happy to share their knowledge with you over a cup of tea. We will talk more about the value of personal networks for gathering information and assistance in Module 4. |
Objective | Now that you have some experience using project management tools and coming up with task lists, it is time for you to tackle your own project. |
Choose a complex project or a program in which you are involved at school or work, or in a community organization to which you belong. If you cannot think of any such projects, think about a complex project you would like to undertake, such as organizing a fund-raising event for a nonprofit organization that you think does good work. Write a proposal designed to convince other people to support your project. Start with a brief description of the project and what you consider to be the most challenging aspects of its planning. Then, using the planning tools presented in this competency (SOW, WBS, PERT/CPM, Gantt charts), show how you would plan to complete the project on time and within cost. If there are important issues of internal and external integration that will affect the success of the project, discuss how these issues will be handled. | |
Reflection | Planning a complex project is typically not something that is done in a single session and then cast in stone. Many issues may arise that cause implementation activities to deviate from the original plan. The more complex the project, the more opportunities there are for problems to emerge. The fact that many projects fail to meet their objectives (Anatatmula, 2008) serves to emphasize the importance of project management skills in organizations today. |
Objective | The first three competencies in this module focused primarily on different ways to accomplish tasks. For this competency, we turn our attention to the metrics that are used to evaluate your performance toward achieving critical outcomes. |
Directions |
|
Discussion Questions |
|
Although providing feedback has been linked to better motivation and performance (as we shall see in Module 3, Competency 3—Motivating Self and Others), lack of timely feedback is still a common complaint in organizations. (One of us once submitted an annual self-evaluation in September and did not receive feedback from the Dean until the following July!) One solution to the challenge of providing timely feedback is to make performance criteria explicit and provide employees with methods to monitor their own performance. For example, rather than waiting until after the semester is over to get formal student evaluation feedback, some faculty take advantage of web-mediated survey systems to gather student perceptions early in the semester so they can respond to concerns when they arise, rather than after the students have completed the course. Monitoring progress and providing feedback at frequent intervals may add slightly to short-term costs, but the long-term benefits can be very worthwhile. |
Establishing and maintaining stability and control depends upon having effective measurement and monitoring systems. For example, we count inventory to be sure there is enough on hand to meet anticipated demand and to identify losses from spoilage or theft. We review medical charts to see if patients have been given appropriate treatments. We record the number and length of telephone calls a customer service representative handles in a day to evaluate his productivity. We observe employees to be sure their appearance and behavior fit with our professional norms. All these measures are relevant, but are they the most important things to measure and monitor? This competency is designed to help managers find answers to that surprisingly complex question.
What happens when organizations fail to monitor the right processes and outcomes? Steven Kerr (1975) addressed this question in his classic article, "On the Folly of Rewarding A While Hoping for B." Kerr provided multiple examples of situations where organizations were measuring the wrong things, resulting in reward systems that actually discouraged employees from achieving their stated goals! For example, telephone service representatives may be told that their goal is to satisfy the customer. If, however, their compensation is based solely on how many calls they handle in an hour, then they have an incentive to get customers off the phone as quickly as possible.
In explaining why reward systems sometimes use measures that are inappropriate for maximizing organizational efficiency, Kerr identified four causes. Two causes relate to the characteristics of the measurement itself. First, organizations tend to be fascinated with "objective" criteria, rather than more qualitative subjective measures. Second, organizations tend to overemphasize highly visible behavior. Both these causes are consistent with the idea that organizations tend to measure what is easy, rather than trying to measure what is most relevant. A third cause of inappropriate measurement, according to Kerr, is hypocrisy—where the stated "goals" are not actually the true goals. Finally, Kerr suggested that sometimes reward systems are designed to emphasize something other than efficiency, such as morality or equity.
More than 30 years after Kerr's classic article appeared, organizations still make serious errors when it comes to monitoring and measuring organizational processes and outcomes and rewarding employees. The potential magnitude of this problem should not be underestimated, as the recent near collapse of the global financial system can attest. Three of Kerr's four causes are relevant to that crisis.
In analyzing the events leading up to the beginning of the global financial crisis in mid-2007, Taub (2009) describes an environment in which it had become much easier for originators to sell loans in the secondary market. These sales effectively transferred risk from the loan originator to a third party. As a result, it became more common to write loans without appropriately measuring debtors' ability to repay loans. In addition, because repayments were now going to another entity, it was easier to reward people based on the amount of loans originated, rather than based on whether the loan was actually repaid. These incentives, when combined with the elimination of regulations requiring documentation, led to an upsurge in so-called liar loans—loans that did not require any documentation to verify income. The only measures that mattered were the number and amounts of loans originated, which were easy to measure because they were objective and visible. Hypocrisy also came into play because the true goals were focused on increasing the amount of fees generated by originating and selling loans, rather than on making loans only to clients who could afford to repay them.
Not surprisingly, the profound lack of control in the financial industry had major negative repercussions that are still being felt, and new regulations are being formulated to avoid these types of problems in the future. In the United States, critics of banking deregulation have pointed to the 1999 repeal of portions of the Glass-Steagall Act of 1933 (enacted following the Great Depression to reform the banking system) as a key factor in the crisis and now are seeking new banking regulation. In the U.K., the Financial Services Authority issued new rules in October 2009 to eliminate self-certified ("liar") loans (Collinson & Jones, 2009).
By honing their understanding of measuring performance and quality, managers can play an important role helping to identify measures that are most closely linked with the critical outcomes for the organization. Walsh (2005) notes that companies often substitute surrogate measures for exact measures of achievement because of the costs associated with the measurement process. For example, surveying customers to learn whether they feel that service quality has improved is more costly than inferring improvements in service quality based on decreasing numbers of customer complaints. Because not all customers who are dissatisfied complain, however, this proxy measure may miss important information.
To help organizations develop a comprehensive set of indicators that measure progress and achievement, Walsh (2005) outlines a measurement hierarchy. Following Simons (2000), Walsh first classifies measures based on the characteristics of objectivity, completeness, and responsiveness.
Objective measures can be verified independently, in contrast to subjective measures that are dependent on personal judgment.
Measures that capture all of the attributes that are relevant in defining performance are classified as Complete; the fewer attributes captured, the less complete the measure.
Measures are considered Responsive if the manager can act to influence the measure; the more direct and powerful that influence, the more responsive the measure.
As an example, share price is an objective measure, but because other factors such as interest rates and investor sentiment also affect share price, it is not a fully responsive measure (Walsh, 2005). Ideally, organizations would define measures that were objective, complete, and responsive. In reality, objective measures often are not complete because they fail to capture important information, particularly for intangibles such as "service quality." To measure service quality, subjective measures drawn from a customer satisfaction survey are likely to convey more useful and accurate information than objective measures of sales volume.
In addition to distinguishing between objectivity, completeness, and responsiveness, Walsh (2005) also considers whether measures focus on outcomes, processes, or initiatives. At the top of Walsh's hierarchy are Exact Measures of Outcomes. These are complete measures that cover all the key attributes for the outcome under consideration. Exact measures of outcomes may be objective or subjective and may have different levels of responsiveness.
Next are Proxy Measures of Outcomes; proxy measures are used to make inferences about exact measures. For example, an increase in customer referrals may be used to infer that service quality has improved. Proxy measures are incomplete but are often used because they are easier and less expensive to obtain. Both exact measures of outcomes and proxy measures of outcomes are intended to reflect achievement of strategic objectives (in the example above, for instance, improving service quality).
Simply measuring achievement/outcomes, however, may not be sufficient. For an organization to improve outcomes, it also needs to understand and measure the processes and initiatives that lead up to those outcomes. Thus, Process Measures of Outputs, Activities, and Inputs make up the third level. Process measures reflect the degree of effort being exerted. Effort alone is not sufficient to guarantee desired outcomes, of course, but it can be an important lever for improvement. The fourth and final level of the hierarchy includes Measures of Initiative Progress. These measures provide information on the changes being made by the organization (Walsh, 2005). As with effort exerted, simply making changes may not result in the desired outcomes. Reviewing measures that are currently being used in light of this hierarchy can help to ensure that no important indicators are being omitted.
For many organizations, the choice of measures used is affected by external factors such as accrediting organizations, and in some cases, that data is made available to the public. For example the Centers for Medicare and Medicaid Services (CMS) post data on process and outcome measures for U.S. hospitals on the Hospital Compare web site (http://www.hospitalcompare.hhs.gov). With respect to cardiac care, the CMS initially focused on process measures that can improve the quality of care; in 2007 the CMS proposed adding 30-day mortality outcomes to these measures (Krumholz, Normand, Sper-tus, Shahian & Bradley, 2007). In July 2009, the CMC announced that in addition to process measures and mortality rates, data on readmissions were also being added.
The hierarchy of measures presented above is general enough to be used in any type of organization. The identification of specific measures that should be collected and analyzed will depend on the mission and strategic objectives of the organization. Measuring items for which there are common industry benchmarks can provide a sound basis for comparison, but these measures may not be sufficient, depending on the mission of the organization.
In recent years, many companies have attempted to expand the way they measure performance. For example, the popular balanced scorecard approach (Kaplan & Norton, 1992) includes not only the financial perspective, but also the customer perspective, internal business perspective, and innovation and learning perspective. Incorporating these four perspectives helps to guard against suboptimization (Kaplan & Norton, 1992). More recently, Kaplan (2005) has suggested that the balanced scorecard is the contemporary manifestation of the McKinsey 7-S model (strategy, structure, systems, staff, skills, style/culture, shared values), which gained popularity as a result of Peters and Waterman's (1982) bestseller, In Search of Excellence. The balanced scorecard and similar approaches to measuring organizational performance still focus primarily on what is good for the company and ultimately the shareholder. Recently Wicks and St. Clair (2007) argued that more attention was needed on measures related to employee well being. For some, however, even that focus is still too narrow.
In recent years there has been a growing interest in measuring organizational performance on more than just operational and financial outcomes. The concept of the "triple bottom line" gained currency in the late 1990s after the publication of John Elkington's Cannibals with Forks: The Triple Bottom Line of 21st Century Business (Norman & MacDonald, 2004). Supporters of the triple bottom line approach argue that organizational success should be measured not only in terms of financial performance, but also with respect to social/ethical performance and environmental performance. Waddock, Bodwell, and Graves (2002) go so far as to suggest that the pressure that stakeholders have put on corporations to be more socially and environmentally responsible has created a new business imperative. Box M2.2 discusses one such effort by Better World Shopping and highlights the reporting of Seventh Generation, which leads the list of best companies identified by Better World Shopping.
Even for people who support the idea of evaluating organizations based on corporate social responsibility, there remains the problem of how these activities should be measured and monitored. For example, Norman and MacDonald (2004) argue that because no clear, standardized measures exist for social and environmental bottom lines, companies may benefit by adopting the rhetoric of the triple bottom line without actually changing their actions. Efforts such as the United Nations Global Compact are one attempt to move toward more standardization for social and environmental reporting. The UN Global Compact has established 10 principles for socially responsible corporate behavior related to issues of human rights, labor, the environment, and anticorruption. The voluntary organization encourages reporting in the belief that transparency about corporate activities will help lead to more socially responsible behavior. You can read more about this organization and its principles at http://www.unglobalcompact.org. While a step in the right direction, Chen and Bouvain (2009) found that although membership in the UN Global Compact had some impact in the areas of the environment and workers, there were still significant variations in how much corporate social responsibility was promoted in different countries.
Despite the substantial growth of interest in corporate social responsibility, not all business observers and academic researchers are convinced that changing business models to improve the social and environmental bottom lines is a good trade-off (Hayward, 2003). This brings us back to the key concern for every organization, no matter how it defines its mission: What drives organizational effectiveness?
As organizations continue to increase in complexity, it becomes more and more complicated to identify the key drivers of organizational effectiveness. Beginning in the mid-1980s, research on enhancing organizational effectiveness began focusing on three main approaches: total quality management (TQM), downsizing, and reengineering (Cameron & Thompson, 2000). Of these three approaches to enhancing organizational effectiveness, TQM devotes the most attention to diverse measures of performance and quality. Despite that fact, in their review of research on TQM, Cameron and Thompson (2000) concluded that "the studies that have attempted to evaluate the success of TQM efforts according to some standardized indicators of success do not inspire enthusiasm" (p. 216). Part of the problem appears to be due to inconsistency in applying TQM throughout the organization. One system that takes a comprehensive approach to quality is the Baldrige Criteria for Performance Excellence.
Since 1987, the Baldrige Criteria (the Criteria) have been used by thousands of U.S. organizations to stay abreast of ever-increasing competition and to improve organizational performance practices, capabilities, and results; to facilitate communication and sharing of best practices information for organizations of all types; and to serve as a working tool for understanding and managing performance and for guiding organizational planning and opportunities for learning. The core values and concepts upon which the Criteria are built include "visionary leadership, customer-driven excellence, organizational and personal learning, valuing employees and partners, agility, focus on the future, managing for innovation, management by fact, social responsibility, focus on results and creating value, systems perspective" (NIST, 2005, p. 1).
The Baldrige Criteria go beyond measuring financial performance and incorporate a broad range of constituents. Outcomes continue to be important, but the Criteria also emphasize developing, deploying, and integrating processes that are aligned with the organization's strategic planning process. Outcome measures serve to complete the feedback loop in the strategic planning process.
The connection between quality processes associated with the Baldrige Criteria and outcome measures has been evaluated by the U.S. General Accounting Office (GAO). Looking at data from the 1988 and 1989 Malcolm Baldrige National Quality Awards (MBNQA), the U.S. GAO found that those companies that had been selected as finalists for the quality of their processes also showed improvements in specific outcome measures. Table M2.2 shows the annual percentage improvement for specific outcome measures.
Stock market analyses prepared by the National Institute of Standards and Technology (NIST) from 1994 through 2001 showed that Baldrige winners generally outperformed the S&P 500 (NIST, 2010). The studies were discontinued in 2004 because "the vast majority ofAward recipients since then [2004] are either business units of larger publicly traded companies, privately held companies, or nonprofit organizations" (NIST, 2010).
The literature on improving performance and quality is extensive, and many organizations have learned from a variety of techniques over the years, including the zero defects and quality is free approaches, TQM, quality circles, kaizen, ISO 9000, the Baldrige Criteria, and Six Sigma (Bisgaard & DeMast, 2006). Recent writings on using enterprise resource planning (ERP) software (Laframboise & Reyes, 2005) with TQM, implementing formal business performance measurement (BPM) approaches (Marr, 2005), applying quality assurance techniques to global supply chain management (Bandyopadhyar, 2005), and conducting self-assessments with the European Foundation for Quality Management (EFQM) Excellence Model (Benavent, 2006) continue to expand approaches for improving organizational performance. As technology continues to advance and societal expectations for corporations are constantly revisited, the skills and knowledge associated with monitoring and measuring performance and quality will be critical for organizational success. As Heras (2005, p. 54) notes, "A strategy with no indicators is wishful thinking, and indicators not aligned with strategy are a waste of time and effort."
Table M2.2. Results of a U.S. General Accounting Office Study of the Relationships between Quality Processes and Desired Outcomes
Outcome Category Measures | Reported Annual Improvement (%) |
|---|---|
Adapted from K. S. Cameron and Michael Thompson, "The Problems and Promises of Total Quality Management: Implications for Organizational Performance," in R. E. Quinn, R. M. O'Neill, and L. St. Clair, Pressing Problems of Modern Organizations (New York: AMACOM, 2000), 228. Copyright 1999 by AMACOM BOOKS. Reproduced with permission of AMACOM BOOKS in the format Textbook via Copyright Clearance Center. | |
Employee-related indicators | |
Employee satisfaction | 1.4 |
Attendance | 0.1 |
Turnover (decrease) | 6.0 |
Safety and health | 1.8 |
Suggestions | 16.6 |
Operating indicators | |
Reliability | 11.3 |
On-time delivery | 4.7 |
Order-processing time | 12.0 |
Errors or defects | 10.3 |
Product lead time | 5.8 |
Inventory turnover | 7.2 |
Costs of quality | 9.0 |
Customer satisfaction indicators | |
Overall customer satisfaction | 2.5 |
Customer complaints (decrease) | 11.6 |
Customer retention | 1.0 |
Financial performance indicators | |
Market share | 13.7 |
Sales per employee | 8.6 |
Return on assets | 1.3 |
Return on sales | 0.4 |
This exercise will give you a chance to develop a set of performance metrics for your own education. Try to identify measures that you think are most critical for meeting your future goals. | |
Directions |
|
Reflection | In many jobs, outcomes are not entirely controllable by the person who is tasked with getting the job accomplished. Doctors who treat patients often must depend on patients to take medications, participate in physical therapy, or avoid certain activities. The desired outcome of a healthy patient is not solely in the hands of the doctor. Likewise, the outcome of an educated student depends not only on the actions of the teacher, but also on the actions of the students, as well as on circumstances beyond the control of either the teacher or students. In situations where there is mutual responsibility, it may be tempting to focus on the performance of the other party, rather than on our own responsibilities. Finding the best balance of performance metrics in these types of situations is doubly difficult, but it is also doubly important. |
Objective | In the Assessment for this competency, we asked you to think about the type of performance feedback you receive in your current position. This exercise gives you an opportunity to use the tools we have discussed to develop enhanced performance metrics for your job. |
Directions | Develop a new performance evaluation form for your job. Be sure that you include measures for Outcomes, as well as Processes and Initiatives. Think about how Objective, Complete, and Responsive the measures are, individually and as a set. Discuss your new evaluation form with your supervisor, and then revise them as needed. |
Reflection | Thinking about how you are being evaluated can help you identify ways to improve your performance in your current job. Just as important, however, is thinking about where you would like to see yourself in the future. Are there some tasks that you could begin to delegate? As we discussed in Module 1, Competency 3—Mentoring and Developing Others, delegating can both help you improve your supervisory skills and free up time for developing skills in new areas. Perhaps you can incorporate some metrics for leading new initiatives into your performance evaluation to demonstrate your ability to manage change in your organization, a topic that we address in Module 4, Competency 5—Implementing and Sustaining Change. |
Objective | This exercise is designed to help you assess your attitudes about complying with rules and how you tend to respond to different methods used to encourage compliance. |
Directions | First, think about how frequently you engage in the following behaviors, and rate yourself using the following scale: 0 = Never; 1 = Rarely; 2 = Sometimes; 3 = Often
Next, think about why you behave as you do.
Finally, consider how you would feel and whether your behavior would change under the following circumstances.
|
It is critical for managers to understand that individuals may respond differently to different methods of encouraging compliance. For example, some people may resent what they perceive to be "bribes" for good behavior. Others may feel that "threats" are demeaning to their professionalism. Unintended consequences often result when strategies for encouraging compliance are not carefully thought through and explained to employees. |
Although in theory organizational members may be expected to comply with formal rules, policies, and procedures, as well as more informal norms about behavior, we know that in practice, there are myriad instances, both small and large, of noncompliance.
In this section we first consider reasons why individuals may not comply with organizational rules, policies, procedures, and norms. Next, we outline basic strategies for encouraging compliance. We also consider the sometimes paradoxical consequences of attempts to increase individual-level compliance. For simplicity, we generally do not distinguish among rules, policies, procedures, and norms. Instead we use the term "rule" to refer to these different concepts more generically.
We conclude this competency with a discussion of issues related to organizational-level compliance. In particular, we consider compliance with U.S. federal laws prohibiting criminal conduct such as perpetrating fraud, discharging environmentally hazardous waste, evading taxes, and engaging in anticompetitive activities.
At the core of all sport lies a fundamental tension between the desire for rules and the desire to break them.
Mitchell, Crosset, and Barr, 1999, p. 216
Using sports metaphors when talking about other types of organizations sometimes can be misleading, but when it comes to understanding how people react to rules, the quote above seems quite apt. It highlights a key paradox—we all seem to have a love-hate relationship with rules. We need rules to keep order, but we resent them when rules prevent us from doing what we would like to do.
Although it may be human nature for us all to prefer rules that work to our benefit, in practice, responses to specific rules can differ substantially based on situational variables as well as individual characteristics. Consider, for example, how people respond to speed limits. The speed limit posted on a road states the maximum legal driving speed, but some individuals are comfortable driving faster than the speed limit while others are not. The ways that different people typically respond to speed limits are based on individual-level variables. In contrast, even people who typically are comfortable driving faster than the speed limit are inclined to slow down if they see a police car. Similarly, people who believe it is important not to drive faster than the posted speed limit may decide to speed in an emergency, such as taking an injured friend to the hospital. In these examples, situational variables influence individuals to change their typical behavior.
Because managers typically have much less influence over individual-level personality variables (e.g., conscientiousness, emotional stability, agreeableness, cynicism, locus of control) that might help predict noncompliant behavior (Kidder, 2005; Litzky, Eddleston & Kidder, 2006), we will focus on different types of situational variables that managers can directly affect to encourage compliance.
Noncompliance. Misbehavior. Wrongdoing. Deviance. All these terms have been used to refer to voluntary actions by employees that violate the norms or rules of an organization. Although many researchers use the term "deviance" (e.g., Robinson & Bennett, 1995; Litzky et al., 2006), we prefer the less loaded term "noncompliance," when violations are relatively minor. In cases where the violations are more significant, we use the terms positive deviance and destructive deviance to emphasize both the direction and the magnitude of the deviance (Quinn, 1996; Warren, 2003).
In their research focusing on noncompliance, Litzky et al. (2006) identified six different triggers for employee misbehavior: (1) ambiguity about job performance; (2) social pressures to conform; (3) compensation/reward structures; (4) negative/ untrusting attitudes by managers; (5) rules that are perceived as unfair; and (6) violating employee trust. Below we organize these triggers based on how the employee is likely to explain their behavior.
Although not included in Litzky et al's (2006) typology, it is important to recognize that not every failure to comply with a rule is intentional. In some cases, people fail to comply with rules because they are unaware that the rule exists. For example, a new employee may not know that she is required to submit expense reports within one week after returning from a business trip. Another employee may not have read an email announcing that, in the future, all expense reports must have original receipts attached, so he may continue to submit expense reports without receipts, as he has in the past. In these types of situations, the organization can enable compliance by communicating the rules to employees and making sure that employees understand the rules.
In some cases, organizations send mixed messages about complying with rules. Mixed messages can be the result of ambiguity about job performance, the failure of managers to respond to instances of noncompliance, or inconsistency in responses to non-compliance. Finally, when a subgroup in the organization fails to follow rules, there is social pressure to conform to those subgroup norms rather than the official rules of the organization.
Employees suffer ambiguity about job performance when they are unsure of their roles, their responsibilities, and the behavior they are expected to exhibit. Employees in boundary-spaing roles, such as salespeople and service providers, bridge the boundary between the organization and its customers and are especially likely to experience this type of ambiguity (Eddleston, Kidder & Litzky, 2002). Satisfying the customer may require violating a company policy. Violations may be small or large. For example, a bus driver may wish to let a regular customer ride on a day when he has forgotten his bus pass, but that would be a violation of company policy (Litzky et al., 2006). A salesperson who is constantly told "the customer is always right" may be hesitant to refuse to pay for an expensive dinner, even though she knows that it exceeds the limits set by her organization for entertaining customers.
Organizations send mixed messages when a rule exists, but there are no consequences associated with complying with that rule. In this type of situation, once people realize that there are no consequences when the rule is ignored, some may begin to disregard the rule. Alternatively, an organization may have sanctions for failing to comply with certain rules, but at the same time may have procedures that make compliance difficult. One organization that we are familiar with, for example, requires that employees include comparative data to have their requests for salary increases considered. At the same time, the organization refuses to provide any information related to the performance and compensation of other employees in similar positions, making meaningful comparisons difficult, if not impossible. This kind of mixed message can lead to frustration, anger, and acting out.
Responding inconsistently to acts of noncompliance also sends a mixed message. Perceptions of inconsistency can result when some employees are allowed to engage in certain behaviors, but other employees are prohibited from engaging in that behavior. In some cases, this may simply be the result of failing to clarify to whom the rule applies. For example, employees may not understand that the reason some employees are allowed to take office supplies home, while others are not, is based on whether the employee is officially participating in a telecommuting option offered by the organization.
In contrast to situations where there might be some misunderstanding about what the rules are and to whom they apply, in some organizations there is social pressure to engage in inappropriate behavior because the norms of a subgroup are inconsistent with organizational rules. For example, a study of bartenders found that at an establishment where tips were pooled and divided among employees, when new employees were first hired, senior employees taught them that the amount of tip money reported for tax purposes should be considerably less than the actual amount (Litzky et al., 2006). Employees are likely to feel especially pressured if it is the managers who are encouraging or engaging in inappropriate behaviors.
In contrast to situations where there is some confusion about a rule and/or to whom it applies, individuals may also choose not to comply when they believe that they will personally benefit from noncompliance. Sometimes ignoring a rule may save a little time or inconvenience. For example, a worker may prefer not to put on safety goggles and a helmet when entering a construction site. Other times rules may be ignored in the belief that following the rules may be financially costly. For example, a sales representative may ignore a company rule forbidding expensive gifts to prospective clients in an attempt to secure a large sales commission. When compensation/reward structures are based on commissions and/or quotas, research shows that employees may find it easier to rationalize inappropriate behaviors (Litzky et al., 2006).
Special issues related to compliance may emerge in associations and voluntary organizations because of the nature of the relationship between the organization and its members. Most employees feel dependent upon their employer, especially in economic hard times, and may fear losing their jobs if they fail to comply with organizational rules. In contrast, members of voluntary organizations may feel less compelled to comply because they have less of a vested interest in retaining their membership in the organization. For example, an individual who would never consider intentionally being late to a meeting at work might feel comfortable arriving late or even skipping a committee meeting for the local food bank where she volunteers.
Three of the triggers identified by Litzky et al. (2006) relate to how employees feel they have been treated. When managers exhibit negative and untrusting attitudes, treat people unfairly, and/or violate their employees' trust, employees are likely to feel that noncompliance or even destructive deviance is an appropriate response (see, for example, Eddleston, et al., 2002; Harris & Obgonna, 2002; Kidder, 2005; Robinson, 1996; Robinson & Bennett, 1995). Such retaliation is viewed as appropriate because the manager (and/or organization) "had it coming." In a study of service workers, for example, one employee remarked, "...Managers have always asked for more than's fair and customers have always wanted something for nothing. Getting back at them is natural—it's always happened, nothing new in that" (Harris & Ogbonna, 2002).
Employees who are publically reprimanded in front of customers and peers may react very quickly and negatively to such a breach of trust. "In these types of situations, one of the most common responses by the employees was for them to do exactly what the managers told them not to do once the manager left the room. This type of behavior was often accompanied with much gusto, so that other employees and on-looking customers could play party to the unacceptable act" (Litzky et al., 2006, p. 96).
Finally, some individuals may choose not to comply with a rule that they disagree with, not for their personal benefit, but because they believe that their actions are aligned with the overall interests of the organization or society. Researchers have used a variety of labels to refer to this type of behavior. We use positive deviance (Quinn, 1996; Spreitzer & Sonenshein, 2003). Other terms, including constructive deviance (Warren, 2003), functional or creative disobedience (Brief, Buttram & Dukerich, 2001), and tempered radicalism (Meyerson & Scully, 1995), all refer to the same basic idea—that in the particular situation in question, not complying was the right thing to do.
Positive deviance often includes speaking up to protest something being done in the organization. Although such "whistle-blowing" violates informal rules about accepting the status quo and not exposing information that might harm the organization, the motivation for positive deviance often is based on a desire to improve the organization and thereby improve the long-term outcomes for organizational stakeholders.
Organizations use a variety of tactics to encourage compliance. For example, cities that wish to reduce accidents at intersections may install cameras and issue automated tickets to vehicles that fail to stop when the light turns red. Hospitals that wish to reduce the spread of infections may provide checklists to be followed along with information about the benefits of activities such as frequent hand washing (Gawande, 2009). Corporations that wish to reduce travel and entertainment expenditures may require itemized receipts for reimbursements. A list of specific tactics could go on and on. To help managers improve compliance, a more general strategic framework is needed.
Traditionally, tactics for encouraging compliance have been captured in the metaphor of the carrot (compensation when compliance is observed) and the stick (sanctions for noncompliance). This type of dichotomous framework, however, is antithetical to the competing values approach because it encourages either/or thinking. More recently, Mitchell et al. (1999) described a more comprehensive framework that identifies six basic strategies to encourage compliance. Table M2.3 provides a summary of that framework and includes a set of metaphors that we think help explain the key differences between these strategies.
Table M2.3. Compliance Strategies (Strategies and Explanations Adapted from Mitchell, et al., 1999)
Strategy | Explanation | Metaphor |
|---|---|---|
Punitive | Increase negative consequences when people do not comply | Sticks |
Remunerative | Increase positive consequences when people do comply | Carrots |
Preventative | Make it harder for people to avoid complying | Hurdles |
Generative | Make it easier for people to comply | Fast Tracks |
Cognitive | Explain why complying is in a person's best interests | Enlightenment |
Normative | Convince people that complying is the morally right thing to do | Conversion |
Mitchell et al. (1999) begin with traditional "stick" and "carrot" approaches, which they relabel "punitive" and "remunerative" strategies, respectively. Sticks are the punishments that are imposed when individuals fail to comply with a rule. Carrots are the rewards people receive when they are observed complying with a rule. It is important to note that both sticks and carrots assume that the individual is able but unwilling (unmotivated) to comply with the existing rules. If the problem is lack of ability to comply, rather than lack of motivation to comply, sticks and carrots will be ineffective.
To be effective, stick and carrot strategies depend on the ability of the organization to provide a clear description of prohibited (undesired) or required (desired) behaviors. It is also important to have some method of monitoring behavior. In the example of the city that wanted to reduce traffic accidents, the addition of traffic cameras at intersections was an important feature when implementing that punitive strategy. The city could have just raised the cost of a ticket (also a punitive strategy), but just getting a bigger stick would not be effective without sufficient monitoring of behavior.
In contrast to attempting to alter employee motivation by focusing on consequences, the next two strategies identified by Mitchell et al. (1999), preventative and generative strategies, focus on changing the opportunities to avoid compliance. Preventative strategies are hurdles—they make it more difficult for individuals to avoid complying with rules. For example, one of our former employers wanted to reduce expenses and requested that employees not stockpile office supplies at their desks. When that request went unheeded, the managing partner had the supply cabinet locked and employees had to go through his assistant to obtain office supplies. Putting this hurdle in place made it more difficult for people to violate the no stockpiling rule.
In contrast to hurdles, which focus on decreasing opportunities to engage in undesired behaviors, fast tracks (generative strategies) attempt to increase opportunities for desired behaviors. A key assumption here is that people have not been engaging in a desired behavior because of a problem with the system, not a problem with the individual. For example, a company that wants to encourage employees to recycle might increase the number of recycling bins available to employees, perhaps placing a bin in each office. By giving employees a fast, easy way to comply with the recycling rule, the organization is able to generate a higher level of compliance.
The final two strategies identified by Mitchell et al. (1999), cognitive and normative strategies, focus on the rationale for particular behaviors. Cognitive strategies take advantage of the concept of enlightened self-interest, so we refer to these as enlightenment strategies. Enlightenment strategies assume that people mistakenly believe that following the rules is unnecessary and/or not in their best interests. Once information has been provided to correct that mistaken impression, there is no need for any additional monitoring because enlightened self-interest will result in the desired behavior. For example, workers may not realize how important wearing safety glasses is for reducing injuries. By providing information on the number and severity of injuries when safety glasses are worn versus when they are not worn, the organization may be able to change how workers think about and comply with these types of safety regulations.
In contrast to enlightenment (cognitive) strategies, normative strategies require a deeper change to the individual's values—hence our use of the term "conversion." Normative strategies assume that people need to be taught to do the right thing—they need to be converted. Once converted, these individuals will behave appropriately without any sticks or carrots and regardless of whether they are facing hurdles or have a fast track to the appropriate behavior. Because assumptions, beliefs, and values are often very deeply held, however, conversion strategies are especially challenging.
One situation when conversion strategies are likely to be used is when top executives attempt to change the values and norms of the organization as a whole. For example, an organization that has operated with monopoly power in the past may need to significantly change its attitudes about quality and customer service when competitors enter the market. It is important to recognize that changing organizational culture is a long-term project. For example, Mitchell et al. (1999) describe efforts by the NCAA beginning in the late 1950s to differentiate between professional athletes and students who participated in athletics programs. Recognizing that changes in language and rhetoric play an important role in changing values and beliefs, the NCAA insisted that the term "student-athlete" be used, rather than the terms "player" or "athlete" to reinforce the fact that these individuals were, first and foremost, students. When it comes to changing deeply held beliefs and values, however, rhetoric alone is rarely sufficient. Sustaining new values requires that structural changes be made to performance evaluation and reward systems to reinforce that rhetoric.
As noted above, managers can use different strategies to encourage compliance, but each strategy comes with a cost. In addition to concerns about direct financial costs, trying to force compliance may result, paradoxically, in less compliance and reduced effectiveness. Tight controls that result in a high degree of compliance can also result in missed opportunities and, in some cases, destructive deviance.
Punitive strategies for encouraging compliance depend heavily on an effective monitoring system—employees cannot be punished unless there is evidence that they have violated some rule.
Theoretically, remunerative strategies can rely on self-disclosure (thereby eliminating monitoring costs) because employees will want to report behaviors that are rewarded. However, if there is a risk that employees may claim to have engaged in behaviors when they actually have not, then a monitoring system may be needed. To have an impact, remunerative strategies must include rewards that are sufficiently valuable to induce employees to behave as desired and to avoid behaving in undesirable ways. Depending on the difficulty of the desired behavior and the perceived benefit of violating rules, the costs of rewarding compliance can be substantial.
In addition to the financial costs associated with punitive strategies, the use of monitoring systems and punishments signals a lack of trust in employees, which can be a trigger for noncompliance. Even if employees continue to comply with rules, they may choose to "work to rule," doing exactly what is required and nothing more. Research on organizational effectiveness has found that organizations depend on employees going above and beyond what is explicitly required by their job descriptions. When employees chose to "work to rule," they stop performing these types of extra-role or organizational citizenship behaviors, and organizational performance suffers.
While remunerative strategies may avoid the appearance of negative attitudes about employees, they may also result in motivation problems once they have been in use for some time. Research shows that the impact of extrinsic rewards often diminishes over time, as employees begin to feel entitled to the reward, rather than motivated by it. In addition, research summarized by Gagne and Deci (2005) suggests that in some cases providing extrinsic rewards to individuals for doing a task may actually reduce their initial intrinsic motivation. Finally, if the company attempts to eliminate remunerative strategies to save money, employees may feel that they are being treated unfairly and retaliate.
Sometimes organizations need members to challenge or even break rules, as in the case of positive deviance. In the Competing Values Framework, the Internal Process (Control) quadrant is directly opposite the Open Systems (Create) quadrant, indicating the tension between maintaining the status quo and encouraging change. So it should be no surprise that one of the costs of standardization and control is stifled creativity and missed opportunities. In organizations where the phrase, "That's how we've always done it," is regularly repeated, it can be difficult to convince people to consider new ideas and to implement and sustain change (two competencies we address in depth in Module 4).
Many examples of destructive deviant behavior are likely to be triggered when employees feel that the organization "had it coming." Research by Green and Alge (1998) suggests that acts of deviance are often preceded by perceptions of unfairness. Employees who feel that they are underpaid may feel they have the right to take organizational property or to use organizational resources for their personal benefit. Employees who feel that performance expectations are too high may look for ways to cut corners or hide poor performance from their supervisors.
It is important to keep in mind that even if destructive deviance is not targeted directly at the organization, the organization can suffer serious consequences. For example, even though the direct target of sexual harassment may be a coworker, supplier, or customer, that behavior deviates from both legal requirements and ethical standards. Organizations should also recognize that sexual harassment is not dependent only on the personality of the harasser; the organizational culture and specific circumstances also play a role. For example, when Krings and Facchin (2009) studied the sexual harassment of women by men, they found that men who felt they had been treated unfairly were more likely to engage in the sexual harassment of women than men who did not feel that they were treated unfairly. Workplace deviance has been estimated to collectively cost organizations billions of dollars per year (Ferris, Brown, Lian & Keeping, 2009). Although individual differences play a part in predicting destructive behavior by employees, situational triggers such as poorly designed compensation/reward systems, ambiguous performance expectations, and disrespectful or unfair treatment by managers form an important part of the equation.
Up to this point, we have focused our attention on compliance at the individual level. Now we turn our attention to the emerging field of organizational compliance.
In the vernacular, "compliance" means acting in accordance with a request or a rule— something that organizations have always needed members to do. Over the past 20 years, however, the term "compliance" has taken on another, more specific meaning as the United States and other countries have attempted to create incentives for organizations to behave more responsibly.
As a manager, it is important to understand that organizations can be penalized for failing to comply with countless laws and regulations. Although our focus will be on organizational compliance initiatives in the United States at the federal level, you should recognize that the United States is not alone in its quest to encourage organizational accountability and good global citizenship. Australia and the European Union have been active in developing systems that encourage organizations to institute compliance programs, while leaders in Japan, Europe, and the United States have come together to emphasize the importance of developing a set of international ethical standards (Izraeli & Schwartz, n.d.).
In 1991 federal sentencing guidelines for organizations (referred to hereafter as "the Guidelines" were issued by the United States Sentencing Commission (USSC) and began to influence the internal mechanisms organizations use to reduce the likelihood of criminal activity. Although organizations are intangible entities and cannot be imprisoned, they can be found guilty of criminal conduct and punished (Desio, n.d.).
It is important to understand that the federal sentencing guidelines do not just apply to large corporations. According to the Guidelines:
"Organization" means "a person other than an individual." 18 U.S.C. § 18. The term includes corporations, partnerships, associations, joint-stock companies, unions, trusts, pension funds, unincorporated organizations, governments and political subdivisions thereof, and non-profit organizations (U.S. Sentencing Commission, 2007, p. 488).
Although organizations were prosecuted for criminal activity before 1991, research by the U. S. Sentencing Commission found problems with both the severity and the consistency of punishments. For example, average fines often were less expensive than the costs associated with obeying the law—suggesting "that corporate crime did in fact 'pay'" (U. S. Sentencing Commission, 1995, p. 26). In addition, there were large inconsistencies in how different organizations were being treated, even when the facts of specific cases were nearly identical (U. S. Sentencing Commission, 1995).
The Guidelines were created as a manual for judges to use when determining the appropriate sentence for organizations convicted of a federal crime (Izraeli & Schwartz, n.d.). Just as important, they also attempted to reduce organizational wrongdoing by incorporating multiple strategies for encouraging voluntary compliance.
Although the original 1991 Guidelines did appear to have a positive impact on consistency in sentencing, as the many accounting scandals in the early 2000s demonstrated, there was still much room for improvement with respect to the goal of actually reducing inappropriate activities by organizations. As a consequence, the USSC voted to make the standards under the Guidelines more stringent (U.S. Sentencing Commission, 2004).
One key aspect of the original Guidelines was the provision for a reduction in punishment for companies that had "meaningful compliance programs" in place at the time the criminal activity occurred (Kaplan, 2004). A compliance program requires substantially more than a code of conduct—it is an operational program that includes "policies, procedures and actions within a process to help prevent and detect violations of laws and regulations" (Kral, 2009, p. 1).
Not surprisingly, however, some organizations were found to have followed the letter, but not the spirit of the 1991 Guidelines, creating compliance programs that appeared to be good on paper but that were ineffective because of a bad organizational culture (Kaplan, July/Aug 2004).
To increase accountability, more responsibility was put on boards of directors and top executives for managing and overseeing compliance programs. Specifically, the revised Guidelines mandate that organizations periodically conduct risk analyses to estimate the likelihood of criminal conduct and use the findings of these analyses when designing, implementing, and/or modifying their compliance and ethics programs (Kaplan, July/August 2004).
At a more general level, the revised Guidelines call for organizations to "promote an organization culture that encourages ethical conduct and a commitment to compliance with the law" (U. S. Sentencing Commission, 2007) An April 13, 2004, press release announcing the new requirements noted, "The Commission's focus on ethical corporate behavior is a unique development in the 13-year history of the organizational sentencing guidelines" (U. S. Sentencing Commission, 2004, p. 1).
According to Paula Desio, Deputy General Counsel of the U.S. Sentencing Commission, "The organizational guidelines criteria embody broad principles that, taken together, describe a corporate "good Citizenship" model, but do not offer precise details for implementation. This approach was deliberately selected in order to encourage flexibility and independence by organizations in designing programs that are best suited to their particular circumstances" (Desio, n.d., p. 1).
As stated in the Overview of the Organizational Guidelines (Desio, n.d., p. 1), the six key criteria for effective compliance and ethics programs include:
Oversight by high-level personnel
Due care in delegating substantial discretionary authority
Effective communication to all levels of employees
Reasonable steps to achieve compliance, which include systems for monitoring, auditing, and reporting suspected wrongdoing without fear of reprisal
Consistent enforcement and compliance standards including disciplinary mechanism
Reasonable steps to respond to and prevent further similar offenses upon detection of a violation
Not surprisingly, career opportunities focused on compliance and ethics have grown substantially since 1991. Only about 20 ethics officers attended the first meeting of the Ethics Officer Association in 1992; renamed the Ethics and Compliance Officers Association in 2005, the organization had 1,116 members as of March 2010 (E. M. L. Hebert, personal communication, 2010, March 4). Many consulting firms offer services to organizations seeking assistance meeting compliance standards. Some firms focus on industry-specific compliance (e.g., banking, health care, insurance), while other firms focus more broadly, providing training, software, and other services to a variety of organizations.
Regardless of the type or size of an organization, it is important to recognize that one-time training sessions on the importance of compliance are not sufficient. An organizational culture of encouraging and enabling compliance and ethical conduct requires that appropriate values and behaviors be integrated into the daily activities of the organization (Teicheira, 2008). As a manager you may be able to make a great contribution by playing your part in building a culture of integrity.
Objective | This analysis exercise will give you the opportunity to test your understanding of different strategies for encouraging compliance as well as to learn more about the U.S. Federal organizational sentencing guidelines. |
Directions | The United States Sentencing Commission has posted the current version of the Federal Sentencing Guidelines Manual on their web site. Download a copy of Chapter 8 (the organizational sentencing guidelines—a version is available at
|
Reflection | If you have never read any federal regulations before, you may have been surprised at the length and complexity of Chapter 8 of the U.S. Sentencing Guidelines. Creating laws and regulations to help ensure fair competition is an extremely complicated task. It is also a highly political task. In some cases, exclusions are created for specific industries or even specific organizations. For example, states often attempt to attract new business by offering tax breaks that are not available to existing businesses. |
Objective | This exercise is designed to give you the opportunity to practice analyzing and developing policies to encourage and enable compliance. |
Directions | Assume that you work for a university that wants to reduce health care costs. The President, a marathon runner, is especially interested in getting employees to exercise more. One of your colleagues in HR has proposed a program to reward employees who exercise. Review the program description below and then write a memo that identifies the strengths and weaknesses of the program as proposed and offers suggestions for improving the program. |
As part of the University's "Get Healthy, Get Credit" program, faculty and staff are encouraged to maintain a healthy lifestyle including physical activity. Faculty and Staff are encouraged to be physically active a minimum of 30 minutes each day. A form has been provided to keep track of your daily or weekly hours of physical activity, excluding classes or programs sponsored by the University. Eligible faculty and staff may earn a $25 incentive credit for completing 25 hours of physical activity hours between February 1 and June 11 (20 weeks). Please note this form should only be completed for physical activity outside of University programs (i.e., if you participate in a group exercise class, you will get one point per class, and hours should NOT be tracked on this form.) Hours of physical activity must be tracked in increments of 30 minutes (= .5) OR 60 minutes (= 1).
Reflection | Not everyone is comfortable with the idea of organizations creating programs like the one described above, which focus on personal behavior outside the workplace. In addition to programs aimed at changing lifestyle behaviors that might affect health (e.g., exercise, smoking), many organizations have created programs to track employees' community service, even when that service takes place outside of work hours. Although some employees appreciate being recognized for their community activities, others feel that these types of behaviors are private and should not be tracked and used by the company to burnish its public image (Tschirhart & St. Clair, 2008). |
This exercise is designed to help you assess how your organization attempts to encourage and enable compliance. | |
Directions | If you are currently employed, use the questions below to evaluate how your organization attempts to obtain compliance with rules, policies, and regulations. If you are not currently employed, you can use the questions when interviewing potential employers or answer the questions with respect to your school or even how different teachers attempt to obtain compliance from students in the classes you are taking.
|
Reflection | Encouraging and enabling compliance is not just the job of compliance officers and top managers. Every member has the opportunity to set a good example by learning about organizational policies and procedures, role modeling appropriate behavior, and, if necessary, challenging the status quo. |
Objective | The final exercise in each module is intended to give you a starting point for developing a comprehensive strategy for mastery that you can implement and monitor in the future. These competency evaluation matrices will be used at the end of this book to help you develop a long-term development plan that focuses on enhancing your behavioral complexity |
Review | The first competency in the Control quadrant focused on organizing information flows for the individual manager, with an emphasis on increasing the efficiency of handling information inflows and improving the effectiveness of information outflows. Next, we expanded our view of the manager's job to consider how managers can work and manage across functions. The third competency focused on planning and coordinating activities in general, while the fourth competency focused on monitoring and measuring performance to ensure that actual outcomes were aligned with goals established in the planning phase. Finally, we considered control and stability in light of pressures from the external context, particularly issues of compliance with U.S. federal guidelines for corporate accountability. |
Directions | Answer the questions in Table M2.4 for each of the competencies covered in this module based on the reading material, class discussions, and your personal work (e.g., Assessment exercises, Application exercises, etc.). |
Reflection | Completing the matrix in Table M2.4 should give you some ideas about how you can continue to improve on competencies that focus on establishing and maintaining stability and continuity, consistent with the goals of the internal process quadrant. |
Table M2.4. Module 2 Control-Focused Competency Evaluation Matrix
With respect to this competency: | Organizing Information Flows | Working Managing Across and Functions | Planning Coordinating and Projects | Measuring and Monitoring Performance and Quality | Encouraging and Enabling Compliance |
|---|---|---|---|---|---|
1. What do I know about my current performance? | |||||
2. How could I be more effective? | |||||
3. Who are some people I could observe? | |||||
4. What books should I read? | |||||
5. What objectives and deadlines should I set? | |||||
6. With whom should I share my objectives? | |||||
7. How will I evaluatemy efforts? |
Abrahamson, E., & Freedman, D. H. (2007). A perfect mess: The hidden benefits of disorder—how crammed closets, cluttered offices, and on-the-fly planning make the world a better place. New York: Little, Brown and Company.
Alesandrini, K. (1992). Survive information overload: 7 best ways to manage your workload by seeing the big picture. Homewood, Ill.: Business One Irwin.
Ali, A.Bani, S., Anbari, F. T., & Money, W. H. (2008). Impact of organizational and project factors on acceptance and usage of project management software and perceived project success. ProjectManagement Journal, 39(2), 5–33.
Allen, D. (2001). Getting things done: The art of stress-free productivity. New York: Penguin Books.
Alster, N. (1989, February 13). What flexible workers can do." Fortune, 62–66.
Anantatmula, V. S. (2008). The role of technology in the project manager performance model. Project Management Journal, 39(1), 34–47.
Ashford, S. J., & Tsui, A. S. (1991). Self-regulation for managerial effectiveness: The role of active feedback seeking." Academy of Management Journal, 34(2)251–280.
Badiru, A. B. (1993). Quantitative models for project planning, scheduling and control. Westport, CT: Quorum.
Baker, W., R. Cross, & Wooten, M. (2003). Positive organizational network analysis and energizing relationships. In K. S. Cameron, J. E. Dutton, and R. E. Quinn (Eds.), Positive organizational scholarship: Foundations of a new discipline (pp. 328–342). San Francisco, Berrett-Koehler.
Baltzan, P., & Phillips, A. (2008). Business driven information systems (2nd ed.). New York: McGraw/Hill Irwin.
Bandyopadhyay, J. K. (2005). A model framework for developing industry specific quality standards for effective quality assurance in global supply chains in the new millennium." International Journal of Management, 22(2), 294—299.
Beard, J. W., & Peterson, T. O. (2003). Coming to grips with the management of information: A classroom exercise. Journal of Information Systems Education, 14(1), 15–30.
Benavent, F. B. (2006). TQM application through self-assessment and learning: Some experiences from Two EQA applicants. Quality Management Journal, 13(1), 7–25.
Berrger, W. (1999, August). Life sucks and then you fly. Wired, 156–163.
Better World Shopping. (n. d.). Top ten companies. Available: http://www.betterworldshopper.com/topten.html.
Bisgaard, S., & De Mast, J. (2006). ? Six Sigma—What's next ? Quality Progress 39(1), 30–35.
Bowen, H. K.., Clark, K. B., Holloway, C. A., & Wheelwright, S. C. (Eds.). (1994). The perpetual enterprise machine. New York: Oxford University Press.
Bridges, W. (1994, September 19). The end of the job. Fortune, 62–74.
Brief, A P.Buttram, R. T., & Dukerich, J. M. (2001). Collective corruption in the corporate world: Toward a process model. In M. E. Turner (Ed.), Groups at work: Theory and research (pp. 471–499). Mahwah, NJ: Lawrence Erlbaum Associates.
Bunin, R. B. (2009). New perspectives on Microsoft® Office Project 2007 introductory. Boston: Cengage Learning, Course Technology.
Buckingham, M. (2005). "What great managers do. Harvard Business Review, 83(3), 70–79.
Butler, T., & Waldrop, J. (1999). Job sculpting, the art of retaining your best people. Harvard Business Review, 77(5), 144–152.
Cabana, Ronald E., & Purser, S. (1998). The self-managing organization: How leading companies are transforming the work of teams for real impact. New York: Free Press.
Cameron, K. S., & Thompson, M. (2000). The problems and promises of Total Quality Management: Implications for organizational performance. In R. E. Quinn, R. M. O'Neill, and L. St. Clair (Eds.). Pressing Problems in Modern Organizations (pp. 215–242). New York: AMACOM,.
Campbell, J. (1982). Grammatical man: Information, entropy, language and life. New York: Simon & Schuster.
Carlzon, J. (1989). Moments of truth. New York: Perennial Library.
Champy, J. (1995). Reengineering management: The mandate for new leadership. New York: HarperBusiness.
Chen, P., & Bouvain, P. (2009). Is corporate responsibility converging? A comparison of corporate responsibility, reporting in the USA, UK, Australia and Germany. Journal of Business Ethics, 87, 299–317.
CMS Office of Public Affairs. (2009; July 9). New ratings for America's hospitals now available on hospital compare web site. Available: http://www.cms.hhs.gov/apps/media/press/release.asp?Counter=3477&intNumPerPage=10&checkDate=&checkKey=&srchType=1&numDays=3500&srchOpt=0&srchData=&keywordType=All&chkNewsType=1%2C+2%2C+3%2C+4%2C+5&intPage=&showAll=&pYear=&year=&desc=&cboOrder=date.
Collinson, P. & Jones, R. (2009). "Liar loans" banned as watchdog clamps down on risky mortgages. Guardian [On-line.] Available: http://www.guardian.co.uk/money/2009/oct/19/fsa-clampdown-on-risky-mortgages.
Covey, S. R. (2004). The 7 habits of highly effective people. New York: Free Press.
Cox, A. (1990). Straight talk for a Monday morning: Creative values, vision and vitality at work. New York: John Wiley & Sons.
Cross, R., Ehrlich, K., Dawson, R. & Helferich, J. (2008) Managing collaboration: Improving team effectiveness through a network perspective. California Management Review, 50(4), 74–98.
Davenport, T. H., & Prusak, L. (1998). Working knowledge: How organizations manage what they know. Boston: Harvard Business School Press.
Davis, J. B. (2008). Information overload. ABA Journal, 94(7), 14.
Denison, D., Hart, S., & Kahn, J. (1993). From chimneys to cross-functional teams: Developing and validating a diagnostic model. University of Michigan, working paper.
Dertouzes, M. L.., Lester, R. K., Solow, R. M., & the MIT Commission on Industrial Productivity. (1989). Made in America: Regaining the productive edge. Cambridge, MA.: MIT Press.
Desio, P. (n.d.). An overview of the organizational guidelines. Available: http://www.ussc.gov/corp/ORGOVERVIEW.pdf.
Dodin, B. (2006). A practical and accurate alternative to PERT. In J. Józefowska and J. Weglarz (Eds.), International series in operations research and management science: (Vol. 92). Perspectives in modern project scheduling (pp. 3–23) New York: Springer.
Drucker, Peter. (1999). Managing oneself. Harvard Business Review, 77(2), 64–74.
Dumaine, Brian. (1991, June 17). The bureaucracy busters. Fortune, 36–50.
Eddleston, K. A.., Kidder, D. L., & Litzky, B. E. (2002). Who's the boss? Contending with competing expectations from customers and management. Academy of Management Executive, 16(4), 85–95.
Elkington, J. (1998). Cannibals with forks: The triple bottom line of 21st century business. Gabriola Island BC, Canada: New Society Publishers.
Ferris, D. L.., Brown, D. J., Lian, H., & Keeping, L. M. (2009). When does self-esteem relate to deviant behavior: The role of contingencies of self-worth. Journal of Applied Psychology, 94(5), 1345–1353.
Frame, J. D. (1999). Building project management competence. San Francisco: Jossey-Bass.
Galbraith, J. R. (1973). Designing complex organizations. Reading, MA.: Addison-Wesley.
Gates, B. (1999). Business @ the speed ofthought: Using a digital nervous system. New York: Warner Books.
Gawande, A. (2009). The checklist manifesto. New York: Metropolitan Books.
Gilovich, Thomas. (1991). How we know what isn't so: The fallibility of human reason in everyday life. New York: Free Press.
Greenberg, J., & Alge, B. J. (1998). Aggressive reactions to workplace injustice. In R. W. Griffin, A. O'Leary-Kelly, & J. M. Collins (Eds.), Dysfunctional behavior in organizations: Violent and deviant behaviors (pp. 43–117). Stamford, CT: JAI Press.
Grove, A. S. (1995). High output management. New York: Vintage Books.
Guenther, K. (2001). Creating cross-functional web teams. Online, 25(3), 79–81.
Gundry, L. K.., Kickul, J. R., & Prather, C. (1994). Building the creative organization. Organizational Dynamics, 22, 22–37.
Hackman, J. R., & Oldham, G. (1975). Development of the job diagnostic survey. Journal of Applied Psychology, 60, 159–170.
Hackman, J. R., Oldham, G., Janson, R., & Purdy, K. (1975). A new strategy for job enrichment. California Management Review, 17(4), 57–71.
Hallowell, Edward M. (1999). The human moment at work. Harvard Business Review, 77(1), 58–66.
Hammer, M., & Champy, J. (1993). Reengineering the corporation: A manifesto for business revolution. New York: HarperCollins.
Harris, L. C., & Ogbonna, E. (2002). Exploring service sabotage: The antecedents, types and consequences of frontline, deviant, anti-service behaviors. Journal ofService Research, 4(3), 163–183.
Harrison, F. L. (1992). Advanced project management: A structured approach. New York: Halsted.
Hayward, S. F. (2003, March 17). The triple bottom line. Forbes, 42.
Henderson, L. S. (2008). The impact of project managers' communication competencies: Validation and extension of a research model for virtuality, satisfaction, and productivity on project teams. Project Management Journal, 39(2), 48–59.
Henkoff, R. (1994, October 3). Finding, training and keeping the best service workers. Fortune, 110–122.
Heras, M. (2005). The state-of-the-art in performance measurement in Spain. Measuring Business Excellence, 9(3)53.
Herzberg, F. (1968). One more time: How do you motivate employees ? Harvard Business Review, 46, 53–62.
House, R. S. (1988). The human side of project management. Reading, MA.: Addison-Wesley.
Izraeli, D., & Schwartz, M. S. (n.d.) What can we learn from the U.S. Federal Sentencing Guidelines for Organizational Ethics? European Institute for Business Ethics. Available: http://actrav.itcilo.org/actrav-english/telearn/global/ilo/code/whatcan.htm.
Jones, B. (2002). Nurses and the "code of silence." In M. M. Rosenthal and K. M. Sutcliffe (Eds.). Medical error: What do we know? What Do We Do? (pp. 84–100). San Francisco: Jossey-Bass.
Kanter, R. M., Stein, B., & Jick, T. D. (1992). The challenge of organizational change: How companies experience it and leaders guide it. New York: Free Press.
Kaplan, J. M. (2004). Sentencing Guidelines 2.0: The next generation in compliance programs. Corporate Governance Advisor, 12(6), 10–12.
Kaplan, J. M. (2004, July-August). The New Corporate Sentencing Guidelines. Ethikos and Corporate Conduct Quarterly [On-line.] Available: http://www.singerpubs.com/ethikos/html/guidelines2004.html.
Kaplan, R. S. (2005). How the balanced scorecard complements the McKinsey 7-S Model. Strategy & Leadership, 33(3), 41–45.
Kaplan, R. S., & Norton, D. P. (1992). The balanced scorecard: Measures that drive performance. Harvard Business Review, 70(1), 71–79.
Keller, R. T. (2001). Cross-functional project groups in research and new product development: Diversity, communications, job stress, and outcomes. Academy of Management Journal, 44(3), 547–555.
Kerr, S. (1975). ? the folly of rewarding A, while hoping for B. Academy of Management Journal 18(4), 769–783.
Kerzner, H. (2009). Project management: A systems approach to planning, scheduling, and controlling (10th ed.). New York: John Wiley & Sons.
Kidder, D. L. (2005). Is it "who I am," "what I can get away with," or "what you've done to me"? A Multi-theory examination of employee misconduct. Journal of Business Ethics, 57, 389–398.
Kim, D. H. (1994). System archetypes: Diagnosing systemic issues and designing high-leverage interventions. Waltham, MA: Pegasus Communications.
Kimmons, R. L. (1990). Project management basics: A step by step approach. New York: Marcel Dekker.
Kral, R. (2009). Effective corporate compliance programs. Corporate Compliance Insights. Available: http://www.corporatecomplianceinsights.com/2009/effective-corporate-compliance-programs-ron-kral-candela.
Krings, F., & Facchin, S. (2009). Organizational justice and men's likelihood to sexually harass: The moderating role of sexism and personality. Journal of Applied Psychology, 94(2), 501–510.
Krumholz, H. M., Normand, S. T., Spertus, J. A., Shahian, D. M., & Bradley, E. H. (2007).
Measuring performance for treating heart attacks and heart failure: The case for outcome measurement. Health Affairs, 26(1), 75–85 [On-line.].
Laframboise, K., & Reyes, F. (2005). Gaining competitive advantage from integrating enterprise resource planning and total quality management. Journal of Supply Chain Management, 41(2), 49–64.
Lawler, E. E., III. (1992). The ultimate advantage: Creating the high-involvement organization. San Francisco: Jossey-Bass.
Lawler, E. E., III, & Finegold, D. (2000). Individualizing the organization: Past, present, and future. Organizational Dynamics, 29(1), 1–15.
Layne, A. (2000, November). He's navigating the dotcom dustbowl. Fast Company. Available: http://www.fastcompany.com.
Litzky, B. E, Eddleston, K. A., & Kidder, D. L. (2006). The good, the bad, and the misguided: How managers inadvertently encourage deviant behavior. Academy of Management Perspectives, 20(1), 91–103.
Marr, B. (2005). Business performance measurement: An overview of the current state of use in the USA. Measuring Business Excellence 9(3), 56–62.
Message Overload: Employees Work to Stay Afloat as Message Volume Booms. (1999). Knowledge Management, 34.
Meyer, C. (1993). Fast cycle time. New York: Free Press.
Meyerson, D., & Scully, M. (1995). Tempered radicalism and the politics of ambivalence and change. Organizational Science, 6, 585–600.
Mitchell, R. B., Crosset, T., & Barr, C. A. (1999). Encouraging compliance without real power: Sports associations regulating teams. Journal of Sport Management, 13, 216–236.
Mitroff, I. & Killman, R. (1984). Corporate tragedies: Product tampering, sabotage, and other catastrophes. New York: Praeger.
Mohrman, S. A. (1993). Integrating roles and structures in the lateral organization. In Jay R. Galbraith, Edward E. Lawler III, et al. (Eds.), Organizing for the Future (pp. 109–141). San Francisco: Jossey-Bass.
NIST 2010. Baldrige Stock Studies. [On-line] Available: http://www.nist.gov/baldrige/publications/archive/stock_studies.cfm.
NIST 2006. National Institute of Standards and Technology. Baldrige national quality program: Health care criteria for performance excellence (brochure). Available: http://www.baldrige.nist.gov/HealthCare_Criteria.htm.
NIST 2005. National Institute of Standards and Technology. Baldrige national quality program: criteria for performance excellence (brochure).
Nosbisch, M. R., & Winter, R. M. (2006). Managing resource leveling. Cost Engineering, 48(7), 24–34.
Nordenson, B. (2008) Overload! Journalism's battle for relevance in an age of too much information. Columbia Journalism Review, 47(4), 30–42.
Norman, W., & MacDonald., C. (2004). Getting to the bottom of "Triple Bottom Line." Business Ethics Quarterly 14(2), 243–262.
O'Dell, C., & Grayson, C. J., Jr. (1998a). If only we knew what we know. New York: Free Press.
O'Dell, C., & Grayson, C. J. Jr. (1998b). If only we knew what we know, identification and transfer of best practices. California Management Review, 40(3), 154–174.
Parker, G. M. (1994). Cross-functional teams: Working with allies, enemies, and other strangers. San Francisco: Jossey-Bass.
Perry, L. & Denna, E. (1993). Retrofitting process reengineering. Unpublished manuscript, Brigham Young University.
Peters, T. J., & Waterman, R. H., Jr. (1982). In search of excellence. New York: Harper & Row.
Peters, T. (1994). The Tom Peters seminar: Crazy times call for crazy organizations. New York: Vintage Books.
Peters, T. (1999, May). The Wow Project. Fast Company. Available: http://www.fastcompany.com.
Pfeffer, J., & Sutton, R. I. (2000). The knowing—doing gap. Boston: Harvard Business School Press.
Porter, M. E. (1985). Competitive advantage. New York: Free Press.
Quinn, R. E. (1996). Deep change: Discovering the leader within. San Francisco: Jossey-Bass.
Quinn, R. W., & Quinn, R. E. (2009). Lift: Becoming a positive force in any situation. San Francisco, Berrett-Koehler.
Rethinking Work. (1994, October 17). Business Week, 74–117.
Robb, D. (2009). Perfecting project management. HRMagazine, 54(6), 115–118.
Robinson, S. L. (1996). Trust and breach of the psychological contract. Administrative Science Quarterly, 41(4), 574–599.
Robinson, S. L., & Bennett, R. J. (1995). A typology of deviant workplace behaviors: A multidimensional scaling study. Academy of Management Journal, 38(2), 555–572.
Roman, D. D. (1986). Managing projects: A systems approach. New York: Elsevier Science.
Rummler, G. A., & Brache, A. P. (1990). Improving performance: How to manage the white space on the organization chart. San Francisco: Jossey-Bass.
Sapsed, J. D. (2005). How should "Knowledge Bases" be organized in multi-technology corporations ? International Journal of Innovation Management 9(1), 75–102.
Sasser, W. E., Olson, P. R., & Wyckoff, D. D. (1978). Management of services operations: Text, cases, and readings. Boston: Allyn & Bacon.
Schmid, B., & Adams, J. (2008). Motivation in project management: The project manager's perspective. Project Management Journal, 39(2), 60–71.
Schueler, J. (2000). Customer service through leadership: The Disney way. Training and Development, 54(10), 26–31.
Sellen, A. J., & Harper, R. H. R. (. (2002). The myth of the paperless office. Cambridge, MA: MIT Press.
Senge, P. (1990). The fifth discipline: The art and practice of the learning organization. New York: Doubleday.
Senge, P., Roberts, C., Ross, R., Smith, B., & Keller, A. (1994). The Fifth Discipline fieldbook: Strategies and tools for building a learning organization. New York: Doubleday.
Seventh Generation. (2008). Crossroads: Reinventing the purpose and possibility of business. Corporate consciousness report. Available: http://www.seventhgeneration.com/corporateresponsibility/2007.
Shapiro, E. C. (1991). How corporate truths become competitive traps. New York: John Wiley & Sons.
Shenk, D. (1997). Data smog: Surviving the information glut. New York: HarperCollins.
Simons, R. (2000). Performance measurement & control systems for implementing strategy: Text and cases. Englewood Cliffs, NJ: Prentice-Hall.
Smith, A. (1937). The Wealth of nations. New York: Random House, 1937. (Original work published 1776).
Soames, M. (1988). The biography of a marriage: Clementine and Churchill. New York: Paragon House.
Spinner, M. P. (1989). Improving project management skills and techniques. Englewood Cliffs, NJ: Prentice-Hall.
Spreitzer, G. M., & Sonenshein, S. (2003). Positive deviance and extraordinary organizing. In K. S. Cameron, J. E. Dutton, and R. E. Quinn (Eds.) Positive organizational scholarship: Foundations of a new discipline. San Francisco: Berrett-Koehler Publishers.
Stewart, T. A. (1994, July 11). Managing in a wired company. Fortune, 44–56.
Skok, W., & Kobayashi, S. (2007). An international taxicab evaluation: Comparing Tokyo with London, New York and Paris. Knowledge and Process Management, 14(2), 117–130 [On-line.].
Taub, J. S. (2009). Enablers of exuberance: Legal acts and omissions that facilitated the global financial crisis. Available: http://ssrn.com/abstract=1472190.
Taylor, F. W. (1911). The principles of scientific management. New York: Harper & Row.
Teicheira, D. (2008, Nov.-Dec.). Compliance and ethics training: Event versus process. Journal of Health Care Compliance, 61–72.
Tetzeli, R. (1994, July 11). Surviving information overload. Fortune, 60–64.
Text Messaging Chat Abbreviations. (2010). Webopedia. Available: http://www.webopedia.com/quick_ref/textmessageabbreviations.asp.
Thornberry, N. E. (1987, October). Training the engineer as project manager: How to turn technical types into top-notch project managers. Training and Development Journal, 60–62.
Tschirhart, M., & St. Clair, L. (2008). Fine lines: Design and implementation challenges in employee volunteer programs. In M. Liao-Troth (Ed.), Challenges in volunteer management—A volume of research in public management (pp. 205–225). Charlotte, NC: Information Age Publishing.
Toulmin, S., Rieke, R., & Janik, A. (1984). An introduction to reasoning. New York: Macmillan.
U. S. Sentencing Commission. (1995, September 7–8). Corporate crime in America: Strengthening the "good citizen" corporation. Proceedings of the Second Symposium on Crime and Punishment in the United States, Washington, D. C. Available: http://www.ussc.gov.
U. S. Sentencing Commission. (2004). Sentencing commission toughens requirements for corporate compliance and ethics programs. Available: http://www.ussc.gov/PRESS/rel10404.htm accessed 8 December 2009.
U. S. Sentencing Commission. (2007). Chapter 8, Sentencing of organizations. In Guidelines manual. Available: http://www.ussc.gov/2007guid/CHAP8.pdf.
Waddock, S. A., Bodwell, C., & Graves, S. B. (2002). Responsibility: The new business imperative. Academy of Management Executive, 16(3), 132–178.
Walsh, P. (2005). Dumbing down performance measures. Measuring Business Excellence, 9(4), 37–45.
Warren, D. E. (2003). Constructive and destructive deviance in organizations. Academy of Management Review, 28(4), 622–632.
Wenger, E. C., & Snyder, W. M. (2000). Communities of practice: The Organizational frontier. Harvard Business Review, 78, 139–145.
Wicks, A. & St. Clair, L. (2007). Competing values in heath care: Balancing the (un)balanced scorecard. Journal of Healthcare Management, 52(5), 305–232.
Winston, S. (2001). The organized executive: New ways to manage time, paper and people. New York: Warner.
Winston, S. (2004). Organized for success: Top executives and CEOs reveal the organizing principles that helped them reach the top. New York: Crown Business.
Wurman, R. S. (1989). Information anxiety. New York: Doubleday.
Wurman, R. S. (2001). Information anxiety 2. Indiana: QUE.
[5] Source: Dan Denison, Stuart Hart, and Joel Kahn, "From Chimneys to Cross-Functional Teams: Developing and Validating a Diagnostic Model." Working Paper, University of Michigan, 1993. Used with permission.