
Chapter 2
The Science of Change
In 1996, Harvard Business School professor John Kotter reported to the world the results of his 10-year study of more than 100 companies that attempted large-scale organizational change. In his book, Leading Change, he wrote, “I estimate today more than 70 percent of needed change either fails to be launched, even though some people clearly see the need, fails to be completed even though some people exhaust themselves trying, or finishes over budget, late and with initial aspirations unmet.”1 His thinking resonated with findings published three years earlier by Michael Hammer and James Champy in Reengineering the Corporation, who estimated that “50 percent to 70 percent of the organizations that undertake a reengineering effort do not achieve the dramatic results they intended.”2 Truth be told, all of this research happened before our time playing leadership roles in the workplace. In fact, it wasn’t until the early 2000s, when we read Dr. Martin E. Smith’s Success Rates for Different Types of Organizational Change, that reality sunk in for us. Smith’s article reviewed 49 studies that in total encompassed a sample size of over 40,000 respondents. Each of the studies he analyzed had already been published in various business and professional publications (e.g., by the Conference Board, the Academy of Management, Harvard Business Review, The Economist, the Wall Street Journal, and so on). His conclusion? Thirty-three percent of large-scale change programs succeed.3 To use a football (soccer for our readers in the United States) analogy, the weight of the evidence was such that if the success rates were a “yellow card” on leaders, it was a “red card” on their advisers. Especially for us, we felt, given we were young leaders of the Organization Practice of McKinsey & Company, the preeminent consulting firm to whom clients bring their hardest, biggest, and most important change challenges. We felt compelled to provide better answers to our clients, so they can beat the odds. Since then, each of us has spent nearly 20 years in this pursuit. Our journey is not a hero’s journey, however. We have been fortunate to be in the right organization at the right time, conducting research on a scale previously unimaginable. McKinsey & Company has an incredible global reach: a presence in 129 cities in 65 countries, clients that represent 80 percent of the Fortune 500, and unrivaled access to CEOs and senior teams. Our work has also been conducted at the front end of the digital age—with the advantage of instant, global 24/7 connectivity and computing power to store and analyze data in ways that would have seemed like science fiction back when management classics such as In Search of Excellence were written. With a vast pool of potential data sources at our fingertips, our first challenge was to decide what to ask. How could we investigate the difference between change success and failure in a way that would yield robust new insights? Finding out the companies that had been successful and the ones that had failed would be relatively easy. So would probing what had happened to them. But how should we investigate the central question of why? We began by invoking Isaac Newton’s notion of standing on the shoulders of giants. Before we started to gather data at scale, we wanted to consult three groups of giants in particular: our colleagues, a small group of senior executives, and a select group of leading thinkers from the academic world. If we could draw on the help of these three sources to develop an integrated view of what makes organizations successful in making change happen, we could then use McKinsey’s global reach to test and refine it at scale. Our first group of giants was by far the hardest to tame. We began by interviewing our colleagues who had deep experience in leading major change programs, and colleagues whose clients had sustained high performance over long periods. We then brought our sources together for a series of working sessions. Discussions about the real drivers of success soon turned into heated debates. One camp contended, “The right incentives are 80 percent of the answer,” while another countered with “The real secret is to engage hearts and minds.” Yet another insisted, “You start with strategy, then get the structure right, then produce a strong implementation plan and you’re there,” only to be contradicted with, “Top-down solutions don’t work in large, complex global organizations—what you need is shared vision and values, then you kick off change from the bottom up.” These debates went on late into the night and were continued via e-mail for months after the formal sessions were over. Our second group of giants—the senior executives—were better behaved, but equally diverse in their recipes for success.4 We heard, “It’s all about your vision,” as well as, “A vision was the last thing on my agenda.” Some said, “Make a clear plan and pursue it consistently,” while others asserted, “You have to adapt as you go and pray for all the things you can’t control.” One set emphasized, “Trust and collaboration are the key,” and others focused on, “Individual accountability and incentives are what matter.” To say that no clear consensus emerged would be putting it mildly. The third group—the academic giants we spoke to, and those authorities whose work we reviewed—also offered a vast array of contrasting advice. Some suggested that long-term competitive advantage is determined largely by the nature of the industry a company competes in; others placed the emphasis on the top team and decision-making patterns within the organization. Still others argued that luck plays as big a role as any other factor. We were also struck by the many different angles they used to approach the topic, which ranged from the technical (we learned much about “meta-analytic path estimates,” “empirical tests of relative inertia,” and “efficacy-performance spirals”) to the playful (as found in Who Moved My Cheese?, The Complete Idiot’s Guide to Change Management, and Fish! A Remarkable Way to Boost Morale and Improve Results
, among others), with seemingly every other approach in between. None of the groups converged on an answer—that would have been too easy—but when we stepped back to look for patterns across everything we had heard and read, we saw three themes emerging. There was no doubt that long-term success required some sort of internal alignment on direction—a compelling vision and well-articulated strategy that are meaningful to individual employees and supported by the culture and climate of the organization. A high quality of execution was also key: this meant having the right capabilities, effective management processes, and high motivation. The final common thread was a capacity for renewal: an organization’s ability to understand, interact with, shape, and adapt to changes in its situation and the external environment. With these three themes in mind, we put together a first draft of a framework to describe the essential components of successful and sustainable change. At this point, although we had done a lot of work, we didn’t have an answer. All we had was a starting point and a route. We also knew that there would be many roadblocks, detours, and dead ends along the way. So, we set off on the next phase of our work. First, we started to gather data from hundreds of organizations and thousands of senior leaders around the world, using both surveys and workshop-based approaches. Second, we tested our hypotheses in the field by applying them in large organizations and monitoring their impact over long periods of time—not weeks or months, but years. Third, we embarked on a deeper dive into the relevant literature to pressure-test our emerging model. On the survey front, our first step was to create a tool to measure the themes of alignment, execution, and renewal that had emerged from our earlier work. In putting it together, we used a combination of our own experience and psychometric best practices to judge what to include, what to leave out, and how to group the various elements. We had an initial version of the survey completed by the end of 2002. As we gathered more data, we continued to develop and refine it. Over the next few years, it evolved rapidly, and by 2005, it had become a robust tool for measuring organizational health, known as the Organizational Health Index (OHI). By that time, we had a sizeable database that we could mine to validate the link between self-reported health data and objective financial performance. That gave us confidence that we were on the right road to what promised to be an exciting destination. The OHI had enabled us to identify and measure the heretofore largely opaque “soft” characteristics that enabled change success and sustainability of that success over time. However, it didn’t give us much insight into what the organization could do to improve its health. Imagine you go to a doctor with a bad cold, and the doctor tells you, “You have a cold. It means your nose is running, your head feels stuffed up, your eyes are watering, you sneeze and cough, your temperature is all over the place, and you probably aren’t sleeping well. When I look at the data on others with your condition, I can say with a high degree of certainty that you won’t be able to achieve much in this state. Were you to not have a cold you’d both feel better and be able to do a lot more.” So you ask, “Okay, what can I do to get better?” The doctor replies, “Good question. I’m not really sure.” Chances are that’s not a doctor you’ll be visiting again. Therefore, the next step in our journey was to gather data related to our emerging hypotheses about how organizations could become—and stay—healthy. We started with a simple three-step model that we referred to as the 3D approach: first, diagnose your current state; second, design an intervention program; and third, deliver against the plan. Over time we came to believe that the diagnostic step should have two elements: first, setting a performance aspiration; second, assessing the organization’s readiness for change. We also found it was helpful to separate the delivery step into two: first, delivering against the plan; second, making the transition from being in a “change program” mode to a steady-state characterized by continuous improvement. As we learned these lessons, the 3D approach became the 5As (Aspire, Assess, Architect, Act, Advance). In order to understand the work required on performance and health at each stage of a transformation, we looked to the 32,000-member Global Executive Survey Panel, a portion of the McKinsey Quarterly’s million-plus reader base. This group, with its broad geographic reach and representatives from the full spectrum of industries, functions, and ownership models, was an ideal sounding board for testing our approach as it developed.5 As well as conducting surveys, we also gathered input through a series of multi-day workshops that we call the Change Leaders Forum (CLF). CLFs are peer-learning events involving executives from a cross-section of leading organizations throughout the world. Through 2010, we held 18 forums in a variety of locations including the United States, the United Kingdom, France, Dubai, and South Africa. As participants shared best practices at these events, we took the opportunity to refine our thinking about how to make change happen at scale during what were often heated debates. We then drew further insights from staying in touch with the network of more than 1,000 participants from these sessions, gathering further feedback from them on what was and wasn’t working in the field. Although surveys and focus groups gave us huge amounts of data to work with, they ultimately rely on perceptions: we ask people a set of questions, and they tell us what they think. We wanted to go further and test our emerging hypotheses in the crucible of real large-scale change efforts. To do that, we set out to compare experimental and control groups over long periods of time—typically two years. One group would embark on making change happen in a fairly traditional fashion, and the other would use the new approach we were starting to develop—one that gave equal weight to performance and health and employed our embryonic Five Frames approach. We conducted such trials in industries as diverse as financial services, retail, mining, and telco, and in every case, the very positive results compelled us to continue to push our research forward (these results are shared in Exhibit 1.3). Survey data, workshops, and field tests still weren’t enough, however. We were getting a good sense of what worked in practice, but why did it work in theory? For this we went back to academia. We had a strict screening criterion for credible sources. Studies needed to have applied tests of statistical significance at 95 percent certainty levels; the impact reported had to include “hard” financial, economic, commercial, technical, or social metrics; and articles had to have been published in top-tier peer-reviewed journals.6 Further, we asked four eminent scholars to challenge and extend our findings. By 2010, we had conducted a body of research that we were confident was more exhaustive than anything previously undertaken in the field. We had also seen success in so many varied contexts that we were confident our findings were broadly applicable for any leader whose change efforts required people to adjust their behaviors to be successful. Meanwhile, we had regularly confirmed that in the broader world of management practice, the success rates of large-scale change programs had remained unchanged. Our 2006 survey of 1,536 global business executives who had experienced a large-scale change program in the last five years found that 30 percent were “mostly” or “completely” successful in both delivering the desired performance and equipping the organization to sustain it over the long-term.7 In our 2008 survey of 3,199 and 2010 survey of 2,314 executives we found a similar result: one in three programs were considered successful.8 Given this, we put pen to paper and wrote the first version of Beyond Performance. Since then, our research has continued and our experience in applying the findings has expanded exponentially. A big part of our focus has been on upskilling leaders and our McKinsey colleagues on the Five Frames of Performance and Health approach to change. To do so, we made our CLFs into two-day events where senior McKinsey colleagues and senior client executives attend in pairs, with overall group sizes ranging from 20 to 40 participants. During a typical CLF, 20 percent of the time is spent learning the methodology, and 80 percent is spent discussing how it applies to their organizations. At the time of this writing, we have done over 150 of these McKinsey-client training sessions. With the increased use of the OHI during change programs, the amount of data in our OHI database has exploded. As such, we’ve been able to continually refine our findings both in terms of the business impact that a focus on health delivers and, more predictively, how to help organizations choose the aspects of health to focus on—something that we’ll cover in depth with our most recent data in Chapter 3. We’ve also taken our own medicine in McKinsey & Company, discarding our previous employee satisfaction and engagement surveys in favor of the OHI. Further, we’ve reframed all of our internal impact reviews as “Performance and Health Dialogues.” One thing that worried us, however, was the length of the OHI survey. To get an objective view on the matter, we hired Stanford PhD and Duke University professor, Dr. Sunshine Hillygus, an expert in survey methods, to challenge and pressure-test the instrument. She helped us streamline the survey, cutting its length by over a third, in ways that maintained scale reliability and construct validity (we’ll talk more about these shortly for those inclined to want to dive into such things—if you know what Cronbach’s coefficient alphas, P-values, and factor analyses are, the next section will be for you!). We’ve also developed a number of additional tools to support large-scale change programs, including the McKinsey “WAVE” implementation tracking software solution that allows activities and impact to be rigorously managed during the Act stage. WAVE has now been used by over 600 clients globally, and by analyzing the data in the tool at the aggregate level we can now answer questions such as: What proportion of initiatives typically don’t deliver their forecasted impact? What do these initiatives have in common? What portion of milestones in change programs will likely get delayed, by how long, and why? These findings have enabled us to further sharpen our views on what it really takes to make, and execute against, robust plans. In the Introduction, we shared the full list of statistics regarding the research base that supports everything we cover in this revised edition. As we mentioned, if a more comprehensive effort has ever been undertaken, we aren’t aware of it. It’d be hard to overstate just how fortunate we feel to have been able to tap into such a massive pool of data, experience, and expertise to help us develop and refine the thinking you hold in your hands. When we look at the academic world, even those who have been conducting research in the field for over 20-plus years at most can claim to have “worked with hundreds of companies”—nothing on the order of the thousands we’ve had privileged access to learn from. When we look at the business world, there are few if any firms that have the global reach and top management access that McKinsey has, and the nature of turnover in the consulting industry is such that it’s hard to find anyone who has had the luxury of spending 20-plus years in one field. In our first edition, we closed this section by saying, “We’re convinced that many more new and valuable insights will emerge as our sample continues to grow from 500 today to—who knows?—maybe 5,000 organizations one day.” Now, with over 2,000, we’re well on our way. Even so, we remain humble and excited about learning more between this and the publishing of Beyond Performance 3.0. Perhaps by then we can bring you insights gleaned from well beyond a 5,000-organization sample! Stay tuned … Enough about the journey, let’s talk about the destination. You’ll remember that we identified three key attributes of good health: internal alignment, quality of execution, and capacity for renewal. We had also identified nine aspects of organizational life that were empirically proven to drive performance. We put these two bodies of thinking together to develop our definition of organizational health as shown in Exhibit 2.1. Exhibit 2.1 Nine Elements of Organizational Health Let’s take a look at each of the nine elements.
These elements are an organization’s health “outcomes.” Every organization has within it a certain, measurable amount of each (motivation, capability, external orientation, and so on). Knowing how much you have of each of these is important in the same way that when you go to the doctor for a health check-up, the first part of the appointment is assessing your health outcomes: pulse, blood pressure, oxygenation, cholesterol, weight, and so on. All are vital indicators of health. Our definition and measurement of health doesn’t stop here, however; it goes one step further to also look at health “practices.” To continue the analogy with human health, by the end of your appointment a good doctor won’t just talk about your outcomes, she’ll also inquire about your practices—the things you do that give you the results you have. If you have high blood pressure and are overweight, she’ll want to know about diet, exercise, stress at work, and so on. Organizational health is similar. If, for example, accountability is low, we wouldn’t just say you need to get more of it. Instead, we’d want to discuss your management practices—the things you do—that create accountability. We’d talk about the extent to which performance contracts create clear objectives and measurable targets, the extent to which there is role clarity, how consequence management is used, and how more intrinsically driven personal ownership is fostered. For each of the nine health outcomes, there is a set of management practices that drive them. In total, we’ve identified 37 management practices (listed in Exhibit 2.2) that drive the nine health outcomes. These management practices take health from the conceptual to the exceedingly tangible, observable, and above all, actionable—not qualities that are always associated with models of organizational effectiveness and change management. Exhibit 2.2 The Practices Underpinning Organizational Health The OHI survey, a tool for measuring health in a rigorous and comprehensive manner, is based on these nine outcomes of organizational health and their related 37 practices. We are often asked how it differs from other surveys, in particular those used to assess employee satisfaction and engagement. The differences are legion, including among them:
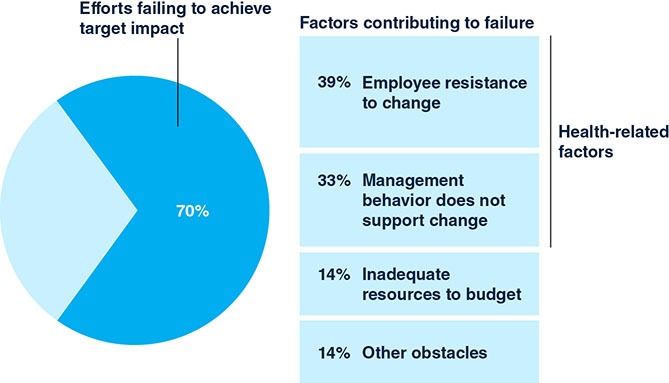
To be honest, we worry about companies who are still using traditional engagement or satisfaction surveys. A staggering number of companies in poor health have been using them for years. Leaders of these companies were no doubt sold on these tools by vendors sharing some empirical data suggesting what they measure is correlated to business performance, and appealed to the leaders’ intuitive sense that they needed a “people measure.” It’s not that the vendors were lying, of course; in fact, no doubt they were very well-intentioned. The problem is that this is like someone selling you a scale by saying, “If you maintain a healthy weight, you’ll both never get sick and be able to perform at your peak!” Sure, one’s weight is correlated to health and one’s health is correlated to performance, but it’s certainly not the only thing. As anyone whose life has been enhanced or even saved by early detection of cancer or other issues will attest, getting a good all-points physical is absolutely worth the extra effort. We could fill pages with similar analogies—would you drive a car that only had a mileage counter on the dashboard (no speedometer, fuel gauge, temperature gauge, tachometer, voltmeter, oil pressure gauge, warning lights, and so on) simply because total miles driven by a vehicle are correlated to its safety and soundness? Would you invest in a stock having only knowledge about its dividends (nothing on earnings growth, stability, industry comparisons, debt-to-equity ratios, price-to-earnings ratios, and so on)? We suspect not, so why would you use an engagement survey that typically covers less than 20 percent of the topics assessed by the OHI, the latter of which was built to measure all of the organization-related elements proven to drive value creation? And it’s not just engagement surveys that are anemic in this way—typical employee satisfaction surveys fare little better, covering about 25 percent of topics included in the OHI. As indicated above, one of the most attractive elements of the OHI is that an organization’s health can be benchmarked at multiple levels, be it overall, by industry or geography (or both). Our database spans all major industries included in the Datastream global index, which represents the 15 sectors shown in Exhibit 2.3. Exhibit 2.3 Industries Represented in the OHI Sample In developing the OHI so comprehensively and robustly, our aspiration was to establish for organizational health what the accountancy profession has long had for financial health: a consistent method of measurement that allows “apples to apples” comparisons to be made both within and between organizations. We were convinced that if organizations had at their disposal a reliable evidence-based tool for measuring organizational health, the results it reported would be just as important as this quarter’s profits or last year’s operating performance as far as shareholders, customers, employees, regulators, governments, and other stakeholders were concerned. Alas, this did not happen in the wake of the first edition of Beyond Performance. Some interesting trends have appeared, however, such as the application of the OHI to entire industries and countries. In South Korea, for example, the Korean Chamber of Commerce & Industry (KCCI) sponsored the survey in over 100 companies simultaneously. In Brazil, over 70 companies operating in 18 industries participated in the survey at the same time. These national benchmarks are changing the discourse about how to run successful businesses in these countries. In South Korea, moves are being made to address issues related to the work environment outcome that drive habitual overwork and gender equality issues, as well as the coordination and control outcome that drives inefficient meetings and reporting. In Brazil, work is underway to address the cultural overreliance on the “challenging leadership” practice, while also improving practices related to the accountability outcome. In the current state, leaders tend to be very challenging of employees, yet employees generally aren’t clear as to what their performance (and health) expectations are. It’s too early to know what impact this elevated attention to health will create in these countries but suffice to say all involved have found the effort invaluable. Sponsoring organizations have been thrilled with the level of insight provided that enables them to act and provide services to their member organizations on a broader scale. The companies who have taken the survey have been thrilled to see their results vis-à-vis fresh data from their peers as well as global benchmarks, helping them pinpoint the health improvements that will lead to performance improvements. Finally, employees and society at large have weighed in by commenting on the news reporting of the findings, indicating, “At last, we are getting to the real issues that hold us back.” This broad-based embracing of organizational health gives us hope that there may still come a day when organizational health becomes a public standard. The case for such, we believe, is stronger now than ever. Our guess is that if you’re deciding whether to expand internationally, you would find it extremely helpful to have not only economic, sociodemographic, and market data at your fingertips, but also information on the general heath of management practices in your target country. If you’re contemplating a merger, having a window into how well (or badly) your management practices will dovetail with the other company’s practices could give you a head start. If you’re making strategic decisions, knowing how healthy your industry is compared with others could have a bearing on your future direction. And if you’re voting for elected officials, imagine the difference it would make if you could understand the health of the institutions your taxes pay for, and see the direct results of any changes as they happen over time. Here’s another “human” example to clarify. Let’s say you’ve signed an athlete to a five-year contract to play on the team that you own and coach. If, through regular health check-ins, you find out the player is drinking, smoking, staying up late, and letting her diet go, that’s vital information to have and to act on, even if today she is performing at world-class levels (she won’t be for long!). The more time it takes you to detect the brewing health issues and intervene, the more likely it costs your team some games and the harder and longer the road will be back to the top for the player in question. The same is true for organizations, and if you’re an owner or investor, we’re hard-pressed to think of any reason why you wouldn’t demand to know the health of the organizations you’re investing in. In spite of our optimism, some have advised us to give up our hopes in this area. Health will never be a concept regularly encountered in annual reports, analyst reports, or in the business press, they tell us. Why? Because analysts and traders are forever fixated on the next quarter’s earnings, and therefore, so are boards and management teams. We believe this is selling those in the business community short. In spite of a noisy segment of short-term focused analysts and investors, the evidence suggests that capital markets do value those things that drive long-term performance. As a former managing director of McKinsey and current chairman of Rolls-Royce, Ian Davis, observes, “An examination of share prices demonstrates that expectations of future performance are the main driver of shareholder returns. In almost all industry sectors and almost all stock exchanges, up to 80 percent of a share’s market value can be explained only by cashflow expectations beyond the next three years. These longer-term expectations are in turn driven by judgments on growth and on long- term profitability.”9 This makes us believe that those leaders who are first movers in reporting their organization’s health will be rewarded. If there’s a more robust, concrete, and measurable current indicator of future success than organizational health, we have yet to see it. With the importance of organizational health and its link to performance now fully established, let’s return to why it is essential to making change happen at scale. A review of the significant amount of research that exists into why change programs fail tells us all we need to know. What we might think of as the usual suspects—inadequate resources, poor planning, bad ideas, unpredictable external events—turn out to account for less than a third of change program failures. In fact, more than 70 percent of failures are driven by what we would categorize as poor organizational health, as manifested in such symptoms as negative employee attitudes and unproductive management behavior (Exhibit 2.4).10 Exhibit 2.4 Barriers to Organizational Change Given that organizational health-related issues are the predominant stumbling blocks to change success, it comes as little surprise that when executives are asked to nominate the areas where they need better information to help them design and lead large-scale change programs, only 16 percent chose “determining what needs to be done to generate near-term performance.” On the other hand, more than 65 percent chose “determining what needs to be done to strengthen the company’s health for the longer term.”11 The magnitude of people-related challenges in making change happen also accounts for why the data suggests that, while the best answer in leading change is putting equal emphasis on performance and health, it also reveals that if you’re going to err on one side or the other, your odds of success are higher if you overemphasize health than if you overemphasize performance.12 In light of the above, while we’ll be talking about both the performance and health-related aspects of managing change extensively throughout the rest of this book, you’ll find the content skewed toward insights, methods, and tools to get the health side of the equation right. By this point, we hope we’ve persuaded you that we’ve done our homework, and that the advice and guidance you’ll find throughout this book have a solid foundation in evidence. We’re tempted to dive straight into the “How to” of the Five Frames of Performance and Health. But we suspect there may be a few statisticians, academics, or skeptics out there who’d like to know more about our survey methods or analyses that underpin our definition of organizational health. If you’re one of these, please continue reading. If you aren’t, we strongly suggest you skip to the next chapter, unless you happen to be reading in bed and need help falling asleep. You have been warned! Here is a brief summary of the primary and secondary research that contributed to our identification of the nine elements of organizational health.
Phew! Don’t say we didn’t warn you that this section is only for the statisticians, academics, or hardcore skeptics! That said, in truth the preceding data provided is but a brief, representative summary of our primary and secondary research. Our hope is that it gives you the same confidence we have that our model of organizational health is robust. The rest of this chapter is somewhat more engaging, but we still encourage those looking for practical examples versus theory and statistics to head to the next one! Completing the survey involves answering a number of questions about the nine health outcomes and their respective management practices. In the “outcomes” part of the survey, we make statements describing a positive, healthy attribute of an organization and ask respondents to what extent the statement applies to their company or organization. For instance, under the outcomes relating to “direction,” we include the following statement: “The vision for the company’s future is widely understood by its employees,” and ask respondents the extent to which they agree. The possible responses are: 1 Strongly disagree; 2 Disagree; 3 Neutral; 4 Agree; 5 Strongly agree. Each respondent is asked up to three questions of this nature on each of the nine outcomes. We combine the answers to these questions to determine an overall score for each outcome. This is reported in two ways: as an average between 1 and 5, and as an overall “agreement” score (defined as the percentage of respondents who answer 4 or 5). We typically report the latter since many people find it easier to understand. In the “practices” part of the survey, we make statements describing the actions that an organization and its leaders can take to drive the associated outcome and ask respondents how often these practices are demonstrated at their organization. For instance, in the section on the practice of “shared vision” (which is one of the drivers of the “direction” outcome), we include the statement: “Management articulates a vision for the future of the company that resonates with my personal values.” Respondents are asked the extent to which this is true of their organization. The possible responses are: 1 Never; 2 Seldom; 3 Sometimes; 4 Often; 5 Always. Each respondent is asked one or two questions of this nature for each of the 37 practices. As with the questions on outcomes, the responses to all questions on a given practice are combined to arrive at an overall score for that practice. For a list of the 37 practices covered in the survey, see Exhibit 2.2. As we mentioned earlier, the OHI was built using a rigorous process and a strong research foundation. But some people may still be wondering, is this survey any good? The best way to assess whether a survey is high quality is to measure its reliability and validity. The reliability of a survey refers to its consistency and stability. When a survey has high reliability, it generally produces consistent results over time. Take a bathroom scale used to weigh oneself. If every time you step on the scale, it reports the same weight (assuming your weight has not changed), it can be considered reliable. That is no guarantee that the number the scale is reporting is your actual weight, however, which is where validity comes into play. Validity refers to the accuracy of an assessment. The goal of any survey or assessment is to have high reliability and high validity, so you can feel confident in the inferences you’re able to draw from it. The most widely used assessment of reliability is the Cronbach’s coefficient alpha, which measures an intercorrelation of the individual items in the survey, so as to evaluate its internal consistency. Alpha scores range from 0.0 (not reliable) to 1.0 (perfectly reliable—items are all measuring the exact same thing). Ideally, you want to fall at least roughly within 0.70–0.99.31 Reliability is important for each characteristic you are measuring, and not for the entire assessment—unless that assessment is only measuring one characteristic. For example, in the OHI, you wouldn’t expect that items relating to leadership will be consistent with items measuring accountability or external orientation. As can be seen in Exhibit 2.5, the reliability of each dimension on the OHI is strong and falls within the desired window we mentioned earlier. Exhibit 2.5 Scale Reliabilities For validity, there are several different types of evidence that can be gathered. One is face validity. This tests whether, to a lay person, the survey seems to measure what it’s intended to measure. The second is content validity, which tests whether subject-matter experts think the questions cover each of the facets and dimensions within a given construct (i.e., accountability). This ensures that the conclusions drawn can be considered accurate. The third is criterion-related validity, where it is statistically demonstrated that the variables of interest are related to important outcomes, which in our case is company performance. On all three of these fronts, we’ve already established that the OHI is on very safe ground. A fourth validity test is construct validity, which uses multivariate statistical procedures to determine whether a test measures the intended construct. In order to test for construct validity, we ran two types of factor analyses: an exploratory factor analysis (EFA) and a confirmatory factor analysis (CFA). An EFA is used to reduce data into a smaller set of summary variables. Results of an EFA show the number of overall factors (i.e., the number of concepts you’re measuring in the survey) and the individual item factor loadings, which map onto a larger concept to show that the items are measuring what they’re supposed to. In the case of the OHI, for example, for it to be valid the EFA would need to say that nine factors would emerge (our nine outcomes) and that each of the items relating to the factors would “load” onto that factor. As can be seen in Exhibit 2.6, we found support for the overall structure of the OHI with minimal cross-loadings and relatively strong factor loadings—suggesting that the internal structure of the assessment has validity. Exhibit 2.6 Exploratory Factor Analysis (EFA) Whereas the EFA is conducted to discover the summary variables from a data set, the CFA is used to test hypotheses about the summary variables one expects to find. With a CFA, there are an assortment of fit indices to look at, and we chose to focus on two that are relatively robust to issues like sample size and model complexity: the Comparative Fit Index (CFI) and the Standardized Root Mean Square Residual (SRMR). The CFI is a “goodness of fit” measure and the goal is to have a CFI over 0.85. On the other hand, the SRMR is a “badness of fit” measure, where the desired index is 0.05 or lower. Exhibit 2.7 shows the results from the CFA, and as can be seen through the fit indices and paths, the data is a good fit for the structure, and there is further validity evidence for the OHI. Exhibit 2.7 Confirmatory Factor Analysis (CFA) We did warn you we’d be nerding-out in this section! The data gathered during the OHI survey is pulled in accordance with strict criteria. For inclusion in the analysis, surveys have to be completed in full, not in short or customized versions; they have to come from a broad cross-section of the organization in question, not just top team members; and a large enough group must be involved to be representative of the organization concerned. Surveys also have to meet one further requirement: that robust, publicly available data on financial results is available either for the organization concerned or for the broader corporation to which it belongs. Nonprofits, government entities, and private companies are excluded for analytical purposes if financial performance data is unavailable or inadequate. The data from our survey is assumed to reflect the state of the organization’s health at the time the survey is administered and for a period of roughly six months prior to that. Separate surveys for the same company are aggregated and matched to financial data for the appropriate fiscal year. In the analysis of the external data on financial results, scores are again aggregated at the company level. We use Bloomberg and Compustat as sources for raw data on metrics such as sales, pretax income, EBITDA, net income, employee numbers, book value, shareholder equity, and net debt. We convert this data into ratios (such as return on sales and EBITDA to sales) and percentages (such as sales growth). We normalize our data on financial results by constructing industry benchmarks for each of the industry sectors for which we have OHI data. We select at least 100 publicly traded global companies for each industry sector and create percentile benchmarks for selected ratios and growth numbers. We then allocate, to each company in the survey, a percentile ranking for each financial metric on the basis of benchmarks for the year in which the survey was conducted or the year following. Companies are categorized as to whether they were performing at, above, or below the industry median on the metric in question. We use this as the critical criterion or dependent variable for further analysis. The companies surveyed have shown a wide range of performance relative to industry peers, suggesting that our sample is robust and representative. ■ ■ ■ Albert Einstein reputedly had a poster in his office that declared, “Not everything that counts can be counted, and not everything than can be counted counts.” The people-related aspects of leading successful change at scale have long been grouped into the realm of those things that cannot be counted. In the exhaustive research underpinning our definition of organizational health and the OHI measurement tool that we’ve developed, we believe this is no longer the case. We also believe the evidence that’s been amassed demands only one verdict: organizational health counts!The Quest Begins
The Road Less Traveled
Organizational Health Defined


A Far Better Measure than Employee Engagement
A New Management Accounting?

Healthy Change Programs
More on Our Methodology
What Research Underpins the Nine Elements of Organizational Health?
How Is the OHI Survey Organized?
OUTCOMES
PRACTICES
What Is the Reliability and Validity of the OHI Survey?


What Data Is Used in Analyzing the Correlation between Health and Financial Performance?
Notes