
CHAPTER 5
Using Alternative and Big Data to Trade Macro Assets
Saeed Amen and Iain Clark
5.1 INTRODUCTION
In recent years, there has been a rapid increase in the amount of data being generated from a wide variety of sources, both by individuals and by companies. Traditionally, the most important datasets for traders have consisted of data describing price moves. For macro traders, economic data has also been a key part of the trading process. However, by augmenting their existing processes with these new alternative datasets, traders can gain greater insights into the market. In this chapter, we delve into the topic of alternative data and big data. We split our discussion into three parts.
In the first section, we seek to define general concepts around big data and alternative data. We explain why data is being generated at a rapidly increasing rate and the concept of ‘exhaust data’. We discuss various approaches to developing models to describe the market, comparing traditional approaches to machine learning. We elaborate on the various forms of machine learning and how they might be applied in a financial setting.
In the next section, we focus more on general applications for alternative data in macro trading. We note how it can be used to improve economic forecasts, for example, or in the construction of nowcasts. Real‐life examples of big data and alternative datasets such as those derived from newswires and social media are also listed.
In the final section, we go into more detail, presenting several case studies using alternative datasets or unusual techniques to understand macro markets. We show how there is a strong relationship between sentiment derived from Federal Reserve communications and moves in the US Treasury yields. We discuss using machine readable news to inform price action in the foreign exchange (FX) market and how news volume relates to implied volatility. We also examine an index representing investor anxiety based upon web traffic to the financial website Investopedia. We show how it can be used to create an active trading rule on the S&P 500 to outperform long‐only and VIX‐based filters. Finally, in a case study, we use a more conventional dataset (FX volatility data) but analyzed in a novel way to try to understand the risks in price action around scheduled events, using the example of GBP/USD around Brexit.
5.2 UNDERSTANDING GENERAL CONCEPTS WITHIN BIG DATA AND ALTERNATIVE DATA
5.2.1 What is big data?
The term big data has perhaps become overused in recent years. There are certain characteristics of what constitutes big data, which are collectively known as the 4Vs: volume, variety, velocity and veracity.
5.2.1.1 Volume One of the most well‐known characteristics of what constitutes big data is the sheer volume. Big data can range from many gigabytes to terabytes or even petabytes. One of the challenges of using big data is simply trying to store it.
5.2.1.2 Variety Big data can come in many varieties. Whilst data traditionally used by traders is generally in a time series format containing numerical values and is structured, this is not always the case with big data. Take, for example, web content. A large amount of the web consists of text and other media, not purely numerical data.
5.2.1.3 Velocity Another defining characteristic of big data is the frequency with which it is generated. Unlike more typical datasets, it can be generated at high frequencies and at irregular time intervals. One example of high‐velocity data in finance is tick data for traded assets.
5.2.1.4 Veracity The veracity of big data is often more uncertain. Often big data can emanate from unverified individuals or organizations. One of the most obvious examples is Twitter, where accounts may try to actively spread disinformation. However, even with financial big data, whose source may be regulated exchanges, data can often still require cleaning to remove invalid observations.
5.2.2 Structured and unstructured data
Structured data, as the name might suggests, is a dataset which is relatively organized. Typically, it might have enough structure to be stored as a database table. The dataset will often be relatively clean. If a structured dataset is primarily text data, it will also have metadata to describe it. For example, it might be accompanied by sentiment scores and usually tags outlining the general topic of the text and timestamps representing when it was collected.
By contrast, unstructured data is much less organized. Typically, it could consist of text scraped from web pages or other sources. Web scraped data will often be in its raw form, including all its HTML tags or formatting, which will need to be removed at a later stage. It will have minimal metadata to describe it. It is often a time‐consuming step to transform unstructured data into a more usable structured dataset. In practice, most big data starts in an unstructured form and requires work to turn it into structured data.
5.2.3 Should you use unstructured or structured datasets?
It is easier and quicker to use structured datasets. Rather than spending a lot of time cleaning the unstructured data and creating metadata, a vendor has already done this for you. However, in some instances, you might still prefer to use unstructured datasets, for reasons other than cost, particularly if there are no associated structured datasets available from data vendors. Furthermore, there might be instances where the unstructured dataset is proprietary and a ready‐made structured dataset is not available. It can also be the case that you might wish to structure data in a different way. Once a dataset is structured into a specific format, it can reduce the types of analysis you are able to perform on it, for example. In order to do that, you need to have access to the actual raw data. Whilst large quant funds are often keen on having access to raw data and have the capabilities to number crunch it, many other investors are likely to prefer using smaller structured datasets.

Figure 5.1 Structured dataset – Hedonometer Index.
In Figure 5.1, we give an example of a structured dataset, the Hedonometer Index, created by the University of Vermont, which was developed to give an idea of users' happiness on Twitter. It takes around 10% of the tweets and classifies each according to happiness, using a bag of words‐style technique. A dictionary contains a large number of words, which are scored for their relative happiness, by people, using the Amazon Mechanical Turk service. Words such as ‘joy’ score highly, whilst words such as ‘destruction’ score lowly in the dictionary (see Figure 5.2).

Figure 5.2 Scoring of words.
In Figure 5.3, we take an average score for each day of the week. Perhaps unsurprisingly, we see that people are least happy on Monday and their happiness rises throughout the week. We have shown this example to illustrate how despite the fact that unstructured big data (in this case extracted from Twitter) can be compromised of very large datasets, once structured, it is easier to make inferences about the data.

Figure 5.3 Days of the week – Hedonometer Index.
5.2.4 Is big data also alternative data?
Let us first consider what alternative data is in the context of financial markets. It is simplest to consider those datasets which are not commonly used in finance. Admittedly, in the years ahead, the datasets which we currently consider as ‘alternative’ are likely to become more mainstream and newer datasets may appear in alternative data space. Importantly, alternative data need not always consist of big data. An alternative dataset could actually be relatively small in the order of megabytes as opposed to gigabytes/terabytes or petabytes, which we tend to associate with big data. Indeed, it may be possible to even store the whole raw alternative dataset in an Excel spreadsheet, which is certainly not the case with big data.
5.2.4.1 Where Is All This Data Coming From? According to IDC (2017), in 2016 around 16.3 ZB of data were being generated globally, which equates to around 1.5 GB per person per day. IDC forecast this to rise to 163 ZB in 2025. Where is this data being generated? In its report it breaks down the sources for data into three categories: core, edge and endpoint.
The core relates to datacentres including those on the cloud and enterprise networks. The edge is comprised of servers outside of their datacentres. The endpoint encompasses everything at the edge of a network, which includes PCs as well as other devices such as phones, connected cars, sensors and so on. Many of these data sources in the edge are, of course, new devices. Many devices at the endpoint are IoT devices (Internet of Things). The report estimates that the majority of data is actually created in the endpoint, with the rest split between the core and edge areas. A large amount of this data is in unstructured form.
The pace of storage technology has not kept up with how fast we are generating data. As a result, large amounts of data are not stored. In many cases, we can avoid storing data in multiple places. Take, for example, the streaming of music or video content – typically it is consumed by users and not stored locally, given it can be streamed again from copies on the cloud at any point. There might be other instances where data is not stored in any place at all and is simply lost once it has been consumed.
5.2.4.2 Monetizing Datasets and the Exhaust We have discussed on a broad basis the areas where data is generated. In this section, we give examples of how datasets can be monetized by selling to traders. We also discuss the idea of ‘exhaust data’, which can be the source of alternative datasets which are used by traders.
Data usually has a primary usage. Consider a financial exchange. As part of its everyday business, it generates a large amount of market data, which is generated by market participants using the exchange. This can be both from quotes posted and actual executions between market participants. Clearly, this market data is important for the exchange to function.
Whilst trading fees can make up a large part of the income for an exchange, they can generate additional income by selling their data feeds. If market participants want a very granular feed with market‐depth data, they will pay more than those simply wanting to receive daily closing quotes. Exchanges can also store all the data generated and sell the history for quants to use in their backtesting of models.
What about an example outside of finance? Let's return to our media content example. If we consider video data, such as movies or TV, it is primarily generated for consumers to watch as entertainment. The same is true of music content. These might seem like obvious statements. However, we might be able to use this dataset for other purposes. For example, they might be able to do speech recognition on movies to generate subtitles and then perhaps natural language processing to identify the sentiment of a movie, to help classify it.
A media streaming company is also likely to collect secondary data, which is a by‐product of users listening to music or watching TV. What songs and video are they streaming, at what time and from what location? There are countless data points we could collect. Once all the datasets are properly aligned, which in itself can be a time‐consuming process, the media streaming company can answer many questions to help personalize the experience for each user. Recommendations about what to watch will obviously vary considerably between users. However, there are other uses of this so‐called ‘exhaust data’ which is generated by companies as part of their everyday business. In practice, it can often be the case that data is collected before its full utility is understood. This can be the case in multiple domains, not purely in finance.
In our earlier financial example, we noted that exchanges monetize their datasets by selling them to financial market participants, which seems like a very direct use case. Corporates can also monetize their datasets by selling them to traders to help them make better trading decisions. However, before doing so they need to be aware of the legal issues associated with doing this.
5.2.5 Legal questions around distributing alternative datasets
5.2.5.1 Personal Data In our example about a media streaming company, we noted that one of the uses of ‘exhaust data’ was to help personalize the experience of individual users. However, if a company wishes to distribute such data to traders, it needs to consider several legal questions, in particular its adherence to various data protection terms. Do the legal terms of its agreement with users allow this, and what is the format in which the data can be distributed? For example, very often the company will need to anonymize the dataset. Sometimes simply blanking out personal details might not be sufficient. Consider a social network. Even if a user's real name is not available, it is possible to infer a lot of details about an individual by who they are connected to. It might also be possible to combine this with linguistic analysis to identify individuals.
In practice, traders do not need or require the identity of individuals from data to use in their trading strategies. Companies can also aggregate the raw data into a more structured form before distributing.
5.2.5.2 Alternative Datasets and Non‐Public Information Alternative datasets are ‘alternative’ because they are not in as common use as traditional datasets are within finance such as price data. We might conjecture that if certain alternative datasets have some specific tradable value, if fewer market are participants using them there could be more of an edge. This is particularly the case when there might be limited capacity on a strategy. One example from a macro viewpoint could be a dataset which helps us better predict economic data releases and enables us to trade around these actual data releases. For liquidity reasons, such trading strategies have a relatively small capacity.
If a company is distributing data exclusively about itself to a single client, which no one else can buy, is there a risk that it is giving out ‘material, non‐public information’? This obviously depends on the nature of the dataset. One way to alleviate this can be if the data is aggregated in some form and in such a way that any sensitive information cannot be reverse engineered from it. Fortado et al. (2017) note that certain funds prefer not to deal with exclusive datasets for this reason.
We could argue that if a third party is collecting information about a specific company, a process which others could potentially replicate, this is much less of a risk, particularly if the source is public information available on the web. Traders of macro assets typically are more interested in broader‐based macro modelling as opposed to data on specific companies. There is, of course, still potential for ‘material non‐public information’ in macro markets, such as through leaks in economic data releases or decisions by central banks.
5.2.6 How much is an alternative dataset worth?
The marketplace for data is not new. Data about financial markets has been sold and distributed for centuries in many forms, even if the way it is distributed has changed from paper, such as in newspapers, to electronic methods, over the various public and private networks. In many cases, there might be multiple vendors distributing similar price datasets, which can aid price discovery.
However, by definition, as we have mentioned, alternative datasets are much less commoditized than most price datasets. Even the most ‘common’ alternative datasets such as machine‐readable news, which are distributed by multiple vendors, are still far less common than price datasets. Furthermore, even here there is variation between the machine‐readable news datasets in how they are structured and also the raw data sources which are used.
For some alternative datasets, there could potentially be only a single vendor who sells that specific data. As discussed earlier, it is also possible for funds to be exclusive users of a specific alternative dataset, which would likely raise the price of the dataset.
The question for any trader, whether macro or otherwise, is how much is an alternative dataset worth? Equally, for sellers of such datasets, what price point should they pitch? It is difficult for both parties. A trader for obvious reasons is not obliged to say precisely how they use a dataset to a vendor. However, without such information it is difficult for a vendor to know how valuable a dataset is to a trader (and hence how much they should charge).
Clearly, traders need to consider how useful the dataset is to understand how much they are willing to pay for it. Just because a dataset is considered ‘alternative’ does not necessarily mean that it is worth millions of dollars. The amount of history in a dataset can help determine its price. Without any history, it becomes very difficult to do any historical backtesting on an alternative dataset to understand how useful it is. Unfortunately, given that alternative datasets are often newer (and in some cases collected using totally new techniques), their history can be much smaller than more traditional datasets. More generally, as with any dataset, the quality of the data is very important. If the dataset is messy and has many missing values, it could reduce its utility.
When considering the value of an alternative dataset, we also need to be able to quantify how much it might improve our strategy. If the effect of the alternative dataset is marginal on a backtest, then it might not be worth buying, particularly if we cannot offset the initial cost of purchasing it.
There is also the question of economies of scale when using data. A larger fund may find it easier to absorb the costs of data. Whilst a dataset cost is often related to the number of users, the additional cost might be proportionally less than the amount of capital a larger firm can run on a strategy related to that dataset.
We need to ask whether the dataset will be used only for very specific and very low‐capacity strategies, or whether it can be used in multiple trading strategies. A larger fund is likely not as interested in data which is only useful in lower‐capacity strategies, compared with a small‐scale trading operation. In effect, here it is advantageous to be a smaller trader. More broadly, the value of data is unlikely to be the same for different traders. From my experience, I have found very different feedback on the use of exactly the same alternative datasets from multiple funds. There can be many reasons for this, in terms of asset classes traded and also the varying approaches used in actually contrasting a trading strategy.
The costs of an alternative dataset should not be measured purely in financial terms of buying a licence to use it, there is also the cost of evaluating the dataset and developing strategies around it. A dataset is worthless without the resources to consume it. Hence, we need to consider whether this alternative dataset is worth investigating versus other priorities. Very often, large quant hedge funds are regularly approached by data vendors with new datasets. It is difficult to evaluate every single dataset offered in a full fashion, even for very large funds.
5.3 TRADITIONAL MODEL BUILDING APPROACHES AND MACHINE LEARNING
Traditionally, when developing a trading strategy or indeed any sort of forecast, we try to find a hypothesis first. We can then validate (or indeed invalidate) our hypothesis using statistical analysis. The rationale is that this exercise can help to reduce the likelihood of data mining. We are essentially pruning our search space to (hopefully) only the areas which we think are relevant.
5.3.1 What is machine learning?
The idea of machine learning techniques is that we don't need to know the form of the relationship between variables beforehand. This contrasts to linear regression, for example, where we are already assuming a certain type of relationship between variables (or features, to use machine learning terminology). Instead, our machine learning algorithm can help us model the function, even if it is highly nonlinear. This will enable us to find relationships between variables we have not already thought of, particularly if we use techniques from machine learning.
5.3.2 Difference between traditional machine learning and deep learning
With traditional machine learning, we define a set of features and then allow the algorithm to find the appropriate function. However, in some instances, it is very difficult to hand craft features which are likely to be relevant. Take the case where we are trying to identify an object in an image. Easy‐to‐define features, such as taking the average brightness or colour of all the pixels in an image, are unlikely to give us any useful information for gauging what object is in an image. Deep learning techniques instead try to extract the features without having to define them. Deep learning techniques have become very successful for certain areas such as image classification. For deep learning to be effective, it requires the availability of large amounts of training data.
5.3.2.1 Supervised, Unsupervised and Reinforcement Learning Machine learning relies on training to identify patterns. This usually requires a training set. In supervised learning, we provide a training set which has been labelled in pairs. It can be time consuming to manually label data and this can limit the size of the training set we use. With unsupervised learning, we have unlabelled training data and the algorithm is designed to infer patterns from the training data without ‘hints’. As a result, it can be easier to use much larger datasets, given that we do not have the constraints associated with labelling data. Deep learning often uses unsupervised learning. Reinforcement learning is a different approach. Here, we create a simple set of rules that our algorithm can follow, which is designed to maximize a reward function. This has been used successfully in the field of games. In this situation, the reward function could be defined as winning a game against an opponent. Reinforcement learning lets a computer teach itself the best approach to solve a problem. In the example of games, it may end up playing in a way very different from that of a human player. DeepMind has used reinforcement learning extensively in the field of games. DeepMind's AlphaZero learnt how to play chess using reinforcement learning and managed to beat the world's best chess playing computer, Stockfish 8 (Gibbs 2017).
5.3.2.2 Should We Use Machine Learning to Develop Trading Strategies? It could be argued that with very large datasets, we might try to let the data ‘talk’ using machine learning techniques. The difficulty, however, is that we might end up finding patterns in what is essentially noise. Furthermore, the nature of financial problems is not stable. Financial time series are non‐stationary. Markets experience changing regimes. The market in 2008 was very different to the market in 2016, for example. This contrasts to other situations in areas where machine learning has been successful, where the problems do not change over time, such as image classification or playing games.
In practice, identifying and constructing the important factors (or features, to use the terminology from machine learning) is still a key part of developing trading strategies. However, we believe that techniques from machine learning are still useful for trading, it is just that we must apply a cautious approach when using machine learning in developing trading strategies.
There is also the case that if we are running a black box trading model, we might simply have to turn off the model when it starts losing money if we cannot understand what it is doing. There are ways we can try to alleviate the problem of model interpretability. One way is to create a simpler linear model to proxy a machine learning trading rule, which might make it easier to understand how changing inputs affect our trade.
To avoid the issues around non‐stationary financial time series, we can instead apply machine learning in our trading problem, not purely focusing on forecasting the time series of the asset itself. After all, creating a trading strategy is not purely about defining the signal; we also need to pre‐process and clean the dataset before constructing any actual trading rule. In our discussion about the effectiveness of machine learning in trading, we would draw the distinction between the various areas. Domains such as high‐frequency trading have very large datasets and as such could be more amenable to machine learning techniques (Dixon et al. 2017). Machine learning, in particular deep learning, has also been used to improve the performance of longer‐term equity factor models (Alberg and Lipton 2017).
Pre‐processing can also involve classifying parts of the dataset, applying techniques such as sentiment analysis or topic identification of text. In these instances, we would suggest that machine learning could be a useful technique.
5.4 BIG DATA AND ALTERNATIVE DATA: BROAD‐BASED USAGE IN MACRO‐BASED TRADING
5.4.1 How do we use big data and alternative data in a macro context?
What are the general approaches we can use to make sense of big data and alternative data more broadly for macro traders? Here, we give a few ideas of where to start.
5.4.1.1 Improve Nowcasts/Economic Forecasts There are many different unusual datasets we might wish to use to improve our forecasts for the monthly change in nonfarm payrolls. If we have a sufficiently good forecast of this number we can trade around this number on an intraday basis. We might also seek to get a real‐time estimate that can be generated throughout the month to aid our trading strategy. Obviously, this approach can be replicated for other economic releases, aside from nonfarm payrolls. We might also seek to use alternative datasets to improve longer‐run economic forecasts or there can be alternative datasets which directly give us a forecast, which may be useful for broader‐based investing. We can also trade on a short‐term basis, around economic data releases, if we can generate reasonable forecasts.
5.4.1.2 Market Positioning and Sentiment for Assets A key part of trading is to understand what the rest of the market is thinking and in particular how they are positioned. If the market is very heavily long, it can sometimes increase the chances of a short squeeze, for example. There is potential to use alternative datasets to help model these factors. We could use alpha capture data, which we discuss later, to gauge market positioning, and also combine this with proprietary flow indicators from market makers.
5.4.1.3 Improving Volatility Estimates It is possible to show that there is a reasonable relationship between market volatility and the volume of news, whether it is derived from more traditional sources such as newswires or newer sources such as social media. Hence, we can use enhance volatility forecasts through the use of volume data related to news and social media.
5.4.2 Real‐life examples of big data and alternative datasets
In this section, we build upon the generalized cases described earlier. We list a few examples of big data and alternative data, which could be relevant for traders. Later, we describe structured datasets suitable for financial applications, which can be considered as alternative data. These datasets are often available both for human traders and in machine‐readable form. Typically, this machine‐readable data can be distributed in via APIs for real‐time ingestion by computers or on a lower‐frequency basis (for example end of day) in flat files, which is more suitable for longer‐term investors.
5.4.2.1 Big Data
5.4.2.1.1 High‐Frequency Market Data Market data is disseminated from exchanges, trading platforms and market makers. As well as top of book data, which gives quotes for smaller trade sizes and also executed trade data, more granular data, such as market depth, can be available. Traders can use the market depth data to calculate metrics such as market imbalance and its skew, which can be used to shed insights into high‐frequency price action.
5.4.2.1.2 Web Content On a broad basis, content from the web is unstructured. If we scrape data from the web, it will often be in an unstructured form. It is then necessary to clean the dataset and also classify it, creating additional metadata to describe it. Web content can be made up of many different forms, including text, video and audio. We can also have exhaust data derived from web content, such as page views.
5.4.2.1.3 Social Media Many forms of social media are available for machine‐readable parsing, such as Twitter, which is available via Twitter's Gnip feed. The format of this text, however, can be particularly difficult for a computer to understand. Not only is the text typically much shorter than that from a news article, it can be difficult to understand the veracity of the text. Interpreting the sentiment of such text can be tricky, given the use of abbreviations and sarcasm. There are also issues of understanding the context of tweets. One way to help understand context is to combine with other similar sources such as machine‐readable news.
Breaking news can sometimes be on Twitter before it is reported on newswires and before an impact is felt on markets. Hence, it has become an important source of news in its own right. One particular example was seen during the earlier days of President Trump's office, when he would often tweet about companies. Indeed, apps have been created specifically to flag when such tweets were sent by him (Turner 2017). As a result of Twitter's importance in breaking news, some newswires, such as Bloomberg News (BN), also directly report important tweets in their feed.
5.4.2.1.4 Mobile Phone Data Tracking data associated with mobile phones is available from various vendors. On an aggregate level this data can be used to map flows of people. We could use this to model the foot flow through shops, for example, to help estimate retail sales data. We can also use such data to understand employment levels if we consider the overall foot flow in and out of rail stations during the rush hour, or the volume of cars on the roads during these periods.
5.4.2.2 More Specific Datasets
5.4.2.2.1 Newswires News articles generated by newswires are primarily output for human readership. BN articles are typically designed to be used for consumption by Bloomberg Terminal users. However, Bloomberg also provides this news in a machine‐readable form, with considerable amounts of additional metadata, including topic classification. Other newswires such as Thomson Reuters and Dow Jones (via RavenPack) offer machine‐readable news. News datasets can be used to assess market sentiment, both in terms of broader economic sentiment and around specific assets.
5.4.2.2.2 Alpha Capture One of the most well‐known alpha capture datasets is aggregated by TIM Group, an independent trade ideas network. Essentially this involves collecting together broker trade recommendations in a systematic manner. Many hedge funds also use alpha capture‐based strategies in their portfolios, in particular for single stocks. They are also used to a lesser extent in macro asset classes. Alpha capture datasets can be followed by investors in a systematic manner. They can also be used to give indications of market positioning. For example, if many brokers are recommending the purchase of a specific bond, this suggests that positioning is quite heavily long in that asset.
5.4.2.2.3 Forecasts and Nowcasts Forecasts have long been available for market participants. Historically, the sources of these forecasts have usually been the research teams of sell‐side brokers, which are then aggregated by data vendors such as Bloomberg. However, many forecasts now available have been crowdsourced from both the sell side and individual investors.
Bloomberg publishes a forecast based on estimates provided by individuals on Twitter (see Figure 5.4) for the monthly change in US nonfarm payrolls, which is one of the most important economic data releases in a month. Later, in a case study, we present a forecast for payrolls based on several variables, including one derived from tweets.

Figure 5.4 Bloomberg nonfarm payrolls chart.
Estimize crowdsources forecasts for equity earnings numbers and economic releases. Alpha capture datasets involve collecting together trade recommendations from sell‐side brokers into an easily navigable dataset.
There are many vendors providing satellite photography, such as Orbital Insights. This can be used by commodity traders to estimate current oil storage levels in silos or crop yields, for example.
5.4.2.2.4 Web Content Whilst it is possible to directly scrape content from the web, there are several datasets of specific web content which can be downloaded in easier‐to‐use formats. One of the most well known of these is the Wikipedia corpus. The entire dataset is available for downloading and analysis. Furthermore, readership statistics are available, which can shed insights into what are hot topics. Another way to view the popularity of topics is through Google Trends. This gives statistics on the relative volume for specific search terms over time.
5.4.2.2.5 Social Media We noted that broadly, social media can present challenges, in particular because of the length of messages. There are many financial data vendors that offer their own structured datasets derived from Twitter, tagging messages for their topics and sometimes with sentiment. These vendors include Dataminr, Knowsis, Bloomberg and Thomson Reuters, amongst many others.
There are also social media networks specifically for financial applications, such as StockTwits, which has around 1.5 million active users (Roof 2016), which is also available in machine‐readable form.
5.5 CASE STUDIES: DIGGING DEEPER INTO MACRO TRADING WITH BIG DATA AND ALTERNATIVE DATA
We have given many broad‐based examples on various datasets and a quick summary of how they could be used by macro traders. In this section, we dig deeper into the subject, giving brief case studies on each of them.
5.5.1 Federal reserve: Cuemacro federal reserve sentiment index for FX and bonds
From an intuitive perspective, it seems reasonable to expect that Federal Reserve communications impact macros. In particular, we note significant volatility around Federal Open Market Committee (FOMC) meetings. However, it is more difficult to quantify the impact on markets. Cuemacro's Federal Reserve sentiment index attempts to quantify the communications in a systematic manner.
The raw input data consists of text extracted from Federal Reserve communications, which is of a relatively small size. It is then structured into a tabular data format. This includes speeches, statements and minutes released by the Federal Reserve. Metadata is then derived from this text, such as sentiment scores, which are generated using natural language processing.
These sentiment scores are aggregated into a time series to represent an index which tracks the overall sentiment of the Federal Reserve over time. The idea isn't so much to create an index, which is traded at high frequency – for example, only around FOMC announcements – instead it is designed to give a representative view of Fed sentiment over recent weeks.
This time series can then be more easily used by traders particularly to understand moves in FX or bond markets. In Figure 5.5, we plot 1M changes in US Treasury 10Y yields against the sentiment index. We note that stylistically there is a strong relationship between both the time series. Furthermore, if we regress them against each other, the T statistic is around 2, which suggests this relationship is significant. We note that there are of course some divergences in the index, which is intuitive, given the Fed is not always the key driver of the US Treasury curve. One such example can be seen in November 2017, when yields moved higher following the election of Donald Trump rather than any specific changes in Fed policy.
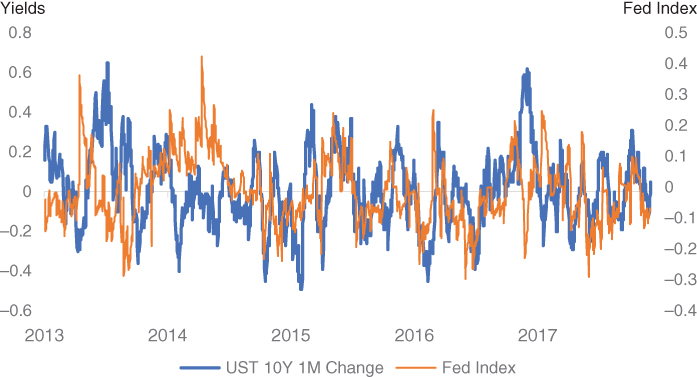
Figure 5.5 Fed index vs recent USD 10Y yield changes.
5.5.2 Machine‐readable news: Bloomberg news to understand price action in FX
The various newswires produce a large amount of news daily. The notion that news is an important facet of what moves markets is not new. After all, human traders follow news as part of their decision‐making process, attempting to extract the signal from the noise within news. However, it is extremely difficult for a human to read all this news on a daily basis; in practice, a human will be able to read only a small snapshot. Hence, it seems reasonable to ask whether this news reading process can be automated in some way, to help shed insight on markets.
In our case study, which is based upon results from Amen (2018), we examine articles from the BN newswire from 2009 to 2017. Whilst BN is typically consumed by users of the Bloomberg Terminal, it is also available in a machine‐readable form, making it amenable as an input into systematic trading strategies.
The focus of our case study is on understanding whether this news dataset can be used to trade developed market FX crosses. In particular, the idea is to develop a daily trading rule rather than a high‐frequency trading rule, which makes trading decisions after a single news article.
The dataset is already structured, which helps make the analysis somewhat easier. However, we still need to do a small amount of cleaning of the body text of each news article, removing the start and end of each article, which have the names and contact details of the journalists writing the article. In addition, we reduce the size of the dataset by removing fields which we are not going to use later.
In order to make the dataset more usable, we need to prune which news articles to examine and focus on those we think are likely to be most impactful for our asset class (in our case, FX). Hence, the next step is to filter the dataset for articles which refer to specific currencies. This has the added benefit of again reducing the dataset size.
Whilst filtering for the assets we are trading is the most obvious approach, there are equally valid ways of filtering news articles. An alternative way could have been to filter for news topic we believe are important for currencies, such as economic news for each country. In these instances, there might well be no mention of currencies in these articles. However, economic news has an impact on monetary policy expectations, which is a key part of the behaviour of currencies. We might also choose to read news relating to other factors which impact currencies, such as geopolitical news.
Natural language processing is then applied to these filtered articles to create sentiment scores for each filtered news article. As noted earlier, the objective of our analysis is to assess sentiment for a large number of news articles rather than attempting to do high‐frequency trades immediately after each article. Hence, these sentiment scores are then aggregated into daily normalized scores for each currency. Using individual currency scores, we can then generate daily scores for currency pairs. For example, the score for USD/JPY is simply USD score – JPY score (see Figure 5.6).

Figure 5.6 USD/JPY Bloomberg score.
Our trading rule is based upon the short‐term momentum. It is based on the premise that in the short term, ‘good’ news about an asset is likely to impact an asset in a positive fashion. Hence, we buy a currency pair if its news score is positive. Conversely, we sell a currency pair if it has a negative score. Potentially, there can be other approaches for deriving signals from news. In particular, we could have attempted to apply much longer‐term windows for assessing news and then used mean reversion‐based trading rules. The rationale is that over very long periods, if news is persistently ‘good’, the market will adjust expectations to it. We might expect a similar effect with continually poor news.
In Figure 5.7, we show the historical returns for a basket of developed market currencies against USD. Both transaction costs and carry are included. We plot the returns versus a generic trend‐following model in FX. We have chosen trend, given it is typically one of the strategies that is used by traders to trade FX. Amen (2013) discusses how trend‐ and carry‐based strategies can be used to explain a large amount of FX fund returns. Hence, generic trend and carry strategies can be considered as proxies for beta in FX.

Figure 5.7 News basket trading returns.
We find that our news‐based strategy outperforms trend on a risk adjusted basis over this period. Furthermore, there is little correlation between the two strategies. This suggests a news‐basis strategy can be used to diversify the returns of a typical FX fund manager.
Whilst it is possible to extract a directional signal from gauging the sentiment of machine‐readable news, the volume of news can also be useful in itself for other reasons. In Figure 5.8, we plot the T statistics of the linear regressions between implied volatilities in various crosses alongside news volume related to those currencies. We see that there is very often a statistically significant positive correlation between implied volatility and news volume. This suggests that we can use news volume as an input to model implied volatility.

Figure 5.8 Regressing news volume vs implied volatility.
There are many further results in Amen (2018). The paper also discusses how news before European Central Bank (ECB) and FOMC meetings can be used to estimate the behaviour of FX volatility around these data points. The volume of news linked to FOMC and ECB statements have a strong impact on short‐term FX volatility.
5.5.3 Web traffic data: Using investopedia's anxiety index to understand market sentiment
Investopedia is a financial education website. Can we glean anything from the topics users search for on Investopedia? The principle behind its Anxiety Index is to track search terms made by users, which results in Investopedia page views. It focuses on those search terms related to investor anxiety, such as ‘short selling’. In total there are 12 different URLs referenced in the final index, which typically have high page view counts (Kenton 2017). In Figure 5.9, we plot the Investopedia Anxiety Index (IAI) against VIX, which is often referred to as the ‘Wall Street Fear Gauge’. We note that when VIX rises, indicating options are becoming more expensive, we see a rise in investor anxiety as indicated by IAI. Conversely, falls in VIX are also generally accompanied by declines in investor anxiety. These observations seem intuitive, namely that option prices are related to investor anxiety.

Figure 5.9 Plot of VIX versus IAI.
Amen (2016) discusses how IAI can be used to create an active trading rule on the S&P 500. In Figure 5.10, we present the returns from this paper for an active trading rule for S&P 500 futures based upon IAI and compare it to one using VIX, and also long only the S&P 500. Essentially, when IAI is high, we are flat S&P 500 and long otherwise. We apply a similar rule for VIX. We find that risk adjusted returns in our sample are highest for the IAI filtered strategy, improving upon those from the VIX filtered strategy. The lowest risk adjusted returns are from a long‐only strategy.

Figure 5.10 Trading S&P 500 using IAI based rule vs VIX and long only.
5.5.4 Volatility data: Forecasting FX spot behaviour around scheduled events with a focus on BREXIT
As a dataset, volatility data is not especially unusual; after all, FX options have been trading for several decades. However, perhaps less common is the use of volatility data to inform the behaviour of spot around scheduled data events. In particular, we can infer from the volatility surface before an event the implied distribution of spot. Clark and Amen (2017) discuss how the GBP/USD volatility surface could be used to infer distributions of spot over the subsequent Brexit vote on 23 June 2016.
They originally estimated, based on their visual observation of implied probability densities available up to 13 June 2016, extracted from GBP/USD implied volatility surface, that the market expected that a vote to leave could result in a move in the GBP/USD exchange rate from 1.4390 (spot reference on 10 June 2016) down to a range in 1.10–1.30, i.e. a 10–25% decline – very probably with highly volatile price action. In Figure 5.11, we present the implied probability distributions of GBP/USD on a number of dates preceding the Brexit vote.

Figure 5.11 Implied distribution of GBP/USD around Brexit.
They also constructed a mixture model related to two scenarios for the GBP/USD exchange rate after the referendum vote, one scenario for ‘remain’ and one for ‘leave’. Calibrating this model to four months of market data, from 24 February to 22 June 2016, we find that a ‘leave’ vote was associated with a predicted devaluation of the British pound to approximately 1.37 USD per GBP, a 4.5% devaluation, and quite consistent with the observed post‐referendum exchange rate move down from 1.4877 to 1.3622.
5.6 CONCLUSION
We have discussed the general characteristics of big data, namely the 4Vs. In addition, we have talked about the differences between structured and unstructured data, and how most of the data generated is in an unstructured form.
We noted how the data being generated is growing rapidly and is forecast to increase further. Large amounts of data are collected by companies as part of their everyday business, so‐called ‘exhaust data’. These datasets can be monetized by selling to traders.
Machine learning can be used to find patterns in large datasets. We wrote about the various forms of machine learning and also where they could be used within the trading process. We then spent time discussing the various types of big data and alternative data, which could be relevant for financial market participants.
Lastly, we dug into more detail, presenting several case studies for macro‐based traders using alternative datasets, including the use of machine‐readable news and web traffic data, as well as a novel technique on FX options data to infer the subsequent distribution of price action in spot.
REFERENCES
- Alberg, J. and Lipton, Z.C. (2017). Improving Factor‐Based Quantitative Investing by Forecasting Company Fundamentals. Retrieved from arxiv.org: https://arxiv.org/abs/1711.04837
- Amen, S. (2013). Beta'em Up: What is Market Beta in FX? Retrieved from SSRN: https://papers.ssrn.com/sol3/papers.cfm?abstract_id=2439854
- Amen, S. (2016). Trading Anxiety – Using Investopedia's Proprietary Dataset to Trade Risk. London: Cuemacro.
- Amen, S. (2018). Robo‐News Reader. London: Cuemacro.
- Clark, I. and Amen, S. (2017). Implied Distributions from GBPUSD Risk‐Reversals and Implication for Brexit Scenarios. Retrieved from MDPI: http://www.mdpi.com/2227‐9091/5/3/35/pdf
- Dixon, M.F., Polson, N.G. and Sokolov, V.O. (2017). Deep Learning for Spatio‐Temporal Modeling: Dynamic Traffic Flows and High Frequency Trading. Retrieved from arxiv.org: https://arxiv.org/abs/1705.09851
- Fortado, L., Wigglesworth, R. and Scannell, K. (2017). Hedge funds see a gold rush in data mining. Retrieved from FT: https://www.ft.com/content/d86ad460‐8802‐11e7‐bf50‐e1c239b45787
- Gibbs, S. (2017). AlphaZero AI beats champion chess program after teaching itself in four hours. Retrieved from Guardian: https://www.theguardian.com/technology/2017/dec/07/alphazero‐google‐deepmind‐ai‐beats‐champion‐program‐teaching‐itself‐to‐play‐four‐hours
- IDC. (2017). Data Age 2025. Retrieved from Seagate: https://www.seagate.com/files/www‐content/our‐story/trends/files/Seagate‐WP‐DataAge2025‐March‐2017.pdf
- Kenton, W. (2017). The Investopedia Anxiety Index. Retrieved from Investopedia: https://www.investopedia.com/anxiety‐index‐explained
- Roof, K. (2016). StockTwits raises funding, gets new CEO. Retrieved from Techcrunch: https://techcrunch.com/2016/07/06/stocktwits‐raises‐funding‐gets‐new‐ceo
- Turner, K. (2017). This app will notify you if Trump tweets about a company you're invested in. Retrieved from Washington Post: https://www.washingtonpost.com/news/the‐switch/wp/2017/01/07/this‐app‐will‐notify‐you‐if‐trump‐tweets‐about‐a‐company‐youre‐invested‐in/?utm_term=.2c6d2a89d135