
This chapter is about debugging tools, monitoring, diagnosing problems, and testing your code, to remove bugs and ensure high performance, stability, and reliability.
This chapter covers the following topics:
- Debugging tools
- Monitoring performance and resource usage
- Unit testing an application
In this section, you will learn how to debug problems at design time, trace problems at runtime, and use types such as Debug, Trace, Process, and Stopwatch that are in the System.Diagnostics namespace.
For Visual Studio 2017, press Ctrl + Shift + N, or navigate to File | New | Project....
In the New Project dialog, from the Installed | Templates list, select Visual C#. In the list at the center, select Console App (.NET Core), type the name Ch05_Debugging, change the location to C:Code, type the solution name Chapter05, and then click on OK.
For Visual Studio Code, create a new folder named Chapter05, create a new subfolder named Ch05_Debugging, and open the folder in Visual Studio Code. In the Integrated Terminal pane, enter the dotnet new console command, and restore packages.
Modify the template code to look like this:
    using static System.Console;

    namespace Ch05_Debugging
    {
      class Program
      {
        static double Add(double a, double b)
        {
          return a * b; // deliberate bug!
        }

        static void Main(string[] args)
        {
          double a = 4.5; // or use var
          double b = 2.5;
          double answer = Add(a, b);
          WriteLine($"{a} + {b} = {answer}");
          ReadLine(); // wait for user to press ENTER
        }
      }
    }
Run the console application and view the output:
4.5 + 2.5 = 11.25
There is a bug: 4.5 added to 2.5 should be 7 and not 11.25!
We will use the debugging tools in Visual Studio 2017 or Visual Studio Code to squash the bug.
Breakpoints allow us to mark a line of code that we want to pause at to find bugs. Click on the open curly brace at the beginning of the Main method and press F9.
A red circle will appear in the margin bar on the left-hand side to indicate that a breakpoint has been set, as shown in the following screenshot:

Breakpoints can be toggled with F9. You can also left-click in the margin to toggle the breakpoint on and off, or right-click to see more options, like remove, disable, or edit the breakpoint.
In Visual Studio 2017, go to Debug | Start Debugging, or click on the Start toolbar button, or press F5.
In Visual Studio Code, go to View | Debug, or press Shift + Cmd + D , and then click on the Start Debugging button, or press F5.
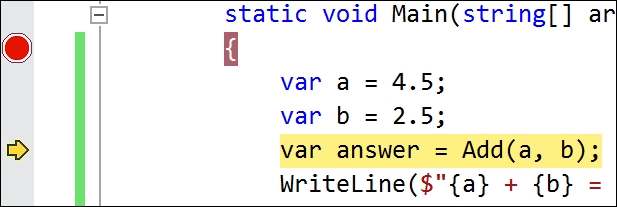
Visual Studio starts the console application executing and then pauses when it hits the breakpoint. This is known as break mode. The line that will be executed next is highlighted in yellow and a yellow arrow points at the line from the gray margin bar, as shown in the following screenshot:

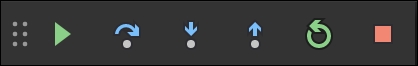
Visual Studio 2017 enables some extra toolbar buttons to make it easy to access debugging features. Here are a few of those:
- Continue/F5 (green triangle): This button will run the code at full speed from the current position
- Stop Debugging/Shift + F5 (red square): This button will stop the program
- Restart/Ctrl or Cmd + Shift + F5 (circular black arrow): This button will stop and then immediately restart the program
- Step into/F11, Step over/F10, and Step out/Shift+ F11 (blue arrows over dots): This button will step through the code in various ways
The following screenshot illustrates Visual Studio 2017's extra toolbar buttons:

The following screenshot illustrates Visual Studio Code's extra toolbar buttons:
Visual Studio 2017 makes some extra windows visible so that you can monitor useful information, such as variables, while you step through your code. If you cannot find one of these windows, then, in Visual Studio 2017, on the Debug menu, choose Windows, and then select the window you want to view, as shown in the following screenshot:

In Visual Studio Code, the windows are all in the Debug view on the left-hand side, as shown in the earlier screenshot.
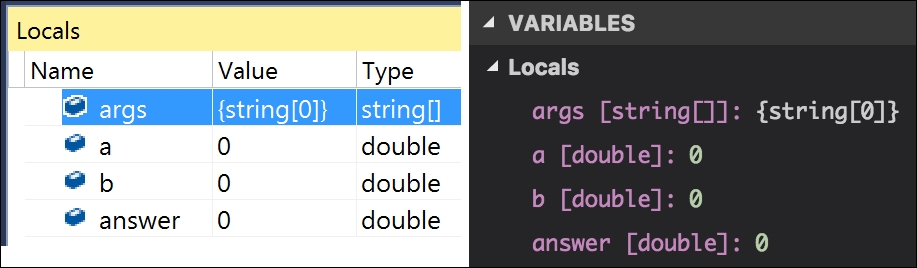
The Locals windows in Visual Studio 2017 and Visual Studio Code, show the name, value, and type for any local variables. Keep an eye on this window while you step through your code, as shown in the following screenshots:
In Chapter 1, Hello, C#!, Welcome, .NET Core!, I introduced you to the C# Interactive window. The similar but more basic Visual Studio 2017 Immediate Window, and Visual Studio Code Debug Console, also allow live interaction with your code.
For example, you can ask a question such as, "What is 1+2?" by typing 1+2 and pressing Enter, as shown in the following screenshots:

From Visual Studio 2017's Debug menu, choose Debug | Step Into, or in both Visual Studio 2017 and Visual Studio Code, click on the Step Into button in the toolbar, or press F11.
The yellow highlight steps forward one line, as shown in the following screenshot:

Choose Debug | Step Over or press F10. The yellow highlight steps forward one line. At the moment, there is no difference between using Step Into or Step Over.
Press F10 again so that the yellow highlight is on the line that calls the Add method:
The difference between Step Into or Step Over can be seen when you are about to execute a method call. If you click on Step Into, the debugger steps into the method so that you can step through every line in that method. If you click on Step Over, the whole method is executed in one go; it does not skip over the method!
Click on Step Into to step inside the method. If you are using Visual Studio 2017, hover your mouse over the multiply (*) operator. A tooltip will appear, showing that this operator is multiplying a by b to give the result 11.25. We can see that this is the bug. You can pin the tooltip by clicking on the pin icon as I have done here:

Fix the bug by changing the * to +.
We don't need to step through all the lines in the Add method, so choose Step Out or press Shift + F11.
If you rerun the console application, you will find that it now calculates correctly.
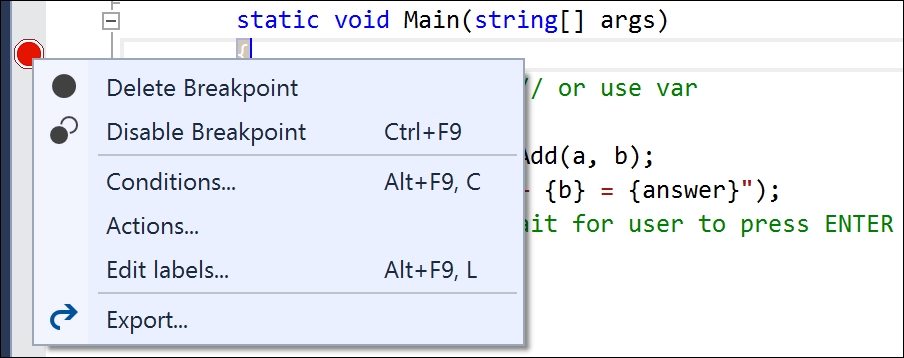
You can also right-click on a breakpoint and choose additional options, such as Conditions..., as shown in the following screenshot:
The conditions for a breakpoint include an expression that must be true and a hit count to reach for the breakpoint to apply.
In the example, as you can see in the following screenshot, I have set a condition to only apply the breakpoint if both the answer variable is greater than 9 and we have hit the breakpoint three times:

Visual Studio Code has similar, but more limited customization options.
You have now fixed a bug using some of Visual Studio's debugging features.