
By default, only one thread is used to execute a LINQ query. Parallel LINQ (PLINQ) is an easy way to enable multiple threads to execute a LINQ query.
To see it in action, we will start with some code that only uses a single thread to double 200 million integers. We will use the StopWatch type to measure the change in performance. We will use operating system tools to monitor CPU and CPU core usage.
Use either Visual Studio 2017 or Visual Studio Code to add a new console application project named Ch09_PLINQ.
Import the System.Diagnostics namespace so that we can use the StopWatch type; System.Collections.Generic so that we can use the IEnumerable<T> type, System.Linq; and statically import the System.Console type.
Add the following statements to the Main method:
    var watch = Stopwatch.StartNew();
    Write("Press ENTER to start. ");
    ReadLine();
    watch.Start();
    IEnumerable<int> numbers = Enumerable.Range(1, 200_000_000);
    var squares = numbers.Select(number => number * 2).ToArray();
    // var squares = numbers.AsParallel()
    //   .Select(number => number * 2).ToArray();
    watch.Stop();
    WriteLine($"{watch.ElapsedMilliseconds:#,##0} elapsed
    milliseconds.");
Run the console application, but do not press Enter to start yet.
In Windows 10, right-click on the Windows Start button or press Ctrl + Alt + Delete , and then click on Task Manager.
At the bottom of the Task Manager window, click on the More details button. At the top of the Task Manager window, click on the Performance tab.
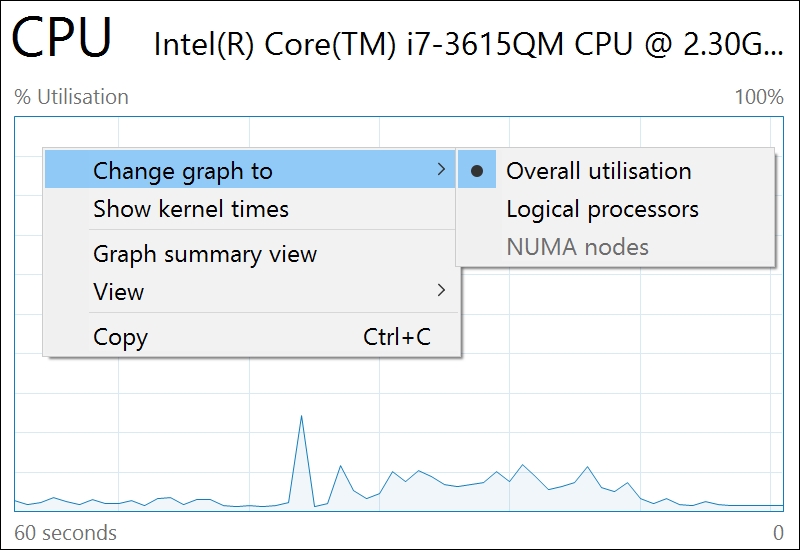
Right-click on the CPU Utilization graph, choose Change graph to, and then Logical processors, as you can see in the following screenshot:
In macOS, run Activity Monitor. Increase the frequency of CPU measurements by navigating to View | Update Frequency | Very often (1 sec). To see the CPU graphs, navigate to Window | CPU History.
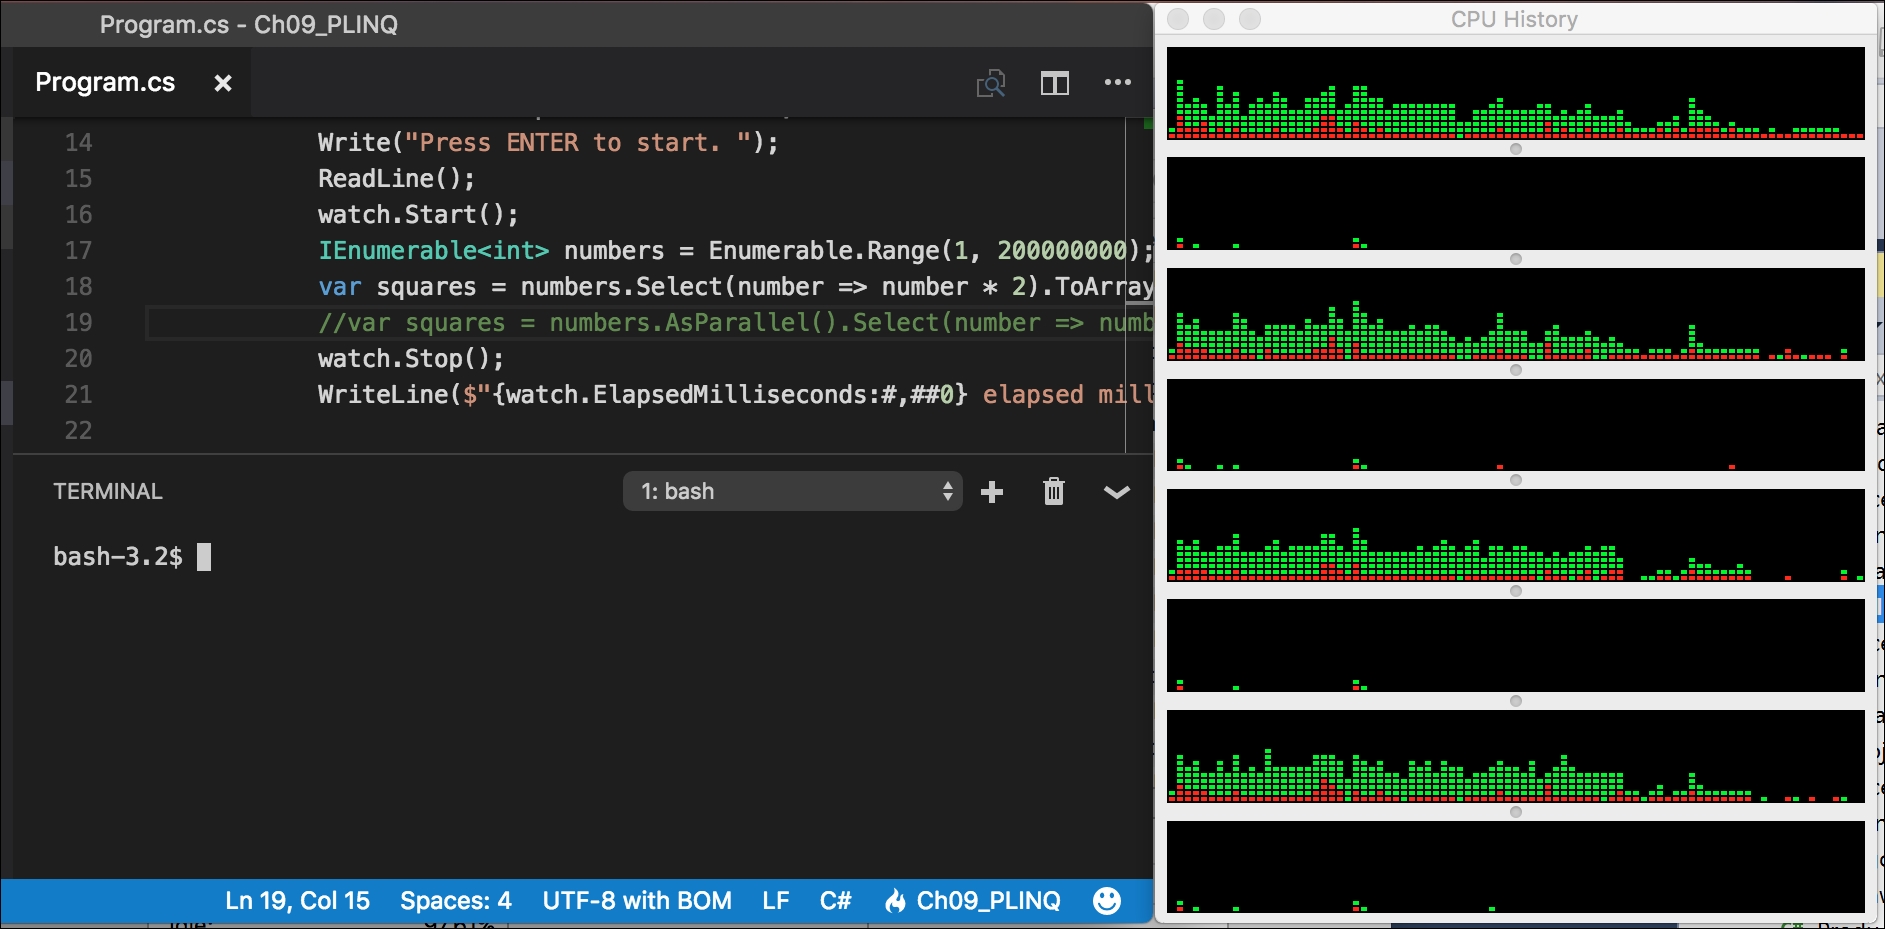
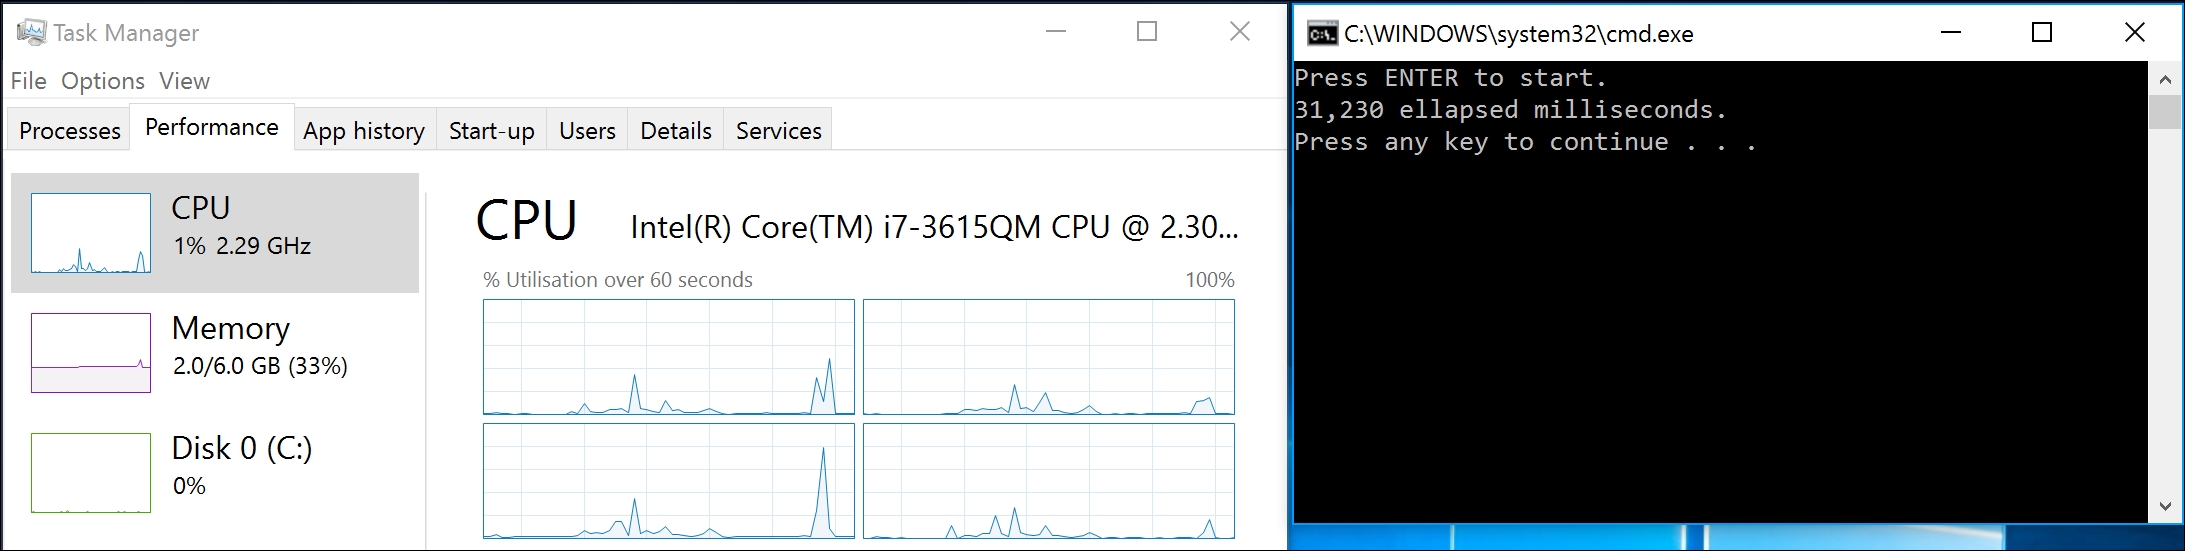
Rearrange Task Manager and your console application, or CPU History and Visual Studio Code Integrated Terminal so that they are side by side, as shown in the following screenshot:
Wait for the CPUs to settle and then press Enter to start the stopwatch and run the query. Your output should look like this:
Press ENTER to start.
31,230 elapsed milliseconds.
On macOS, it'll look something like this:
Task Manager or CPU History windows should show that one or two CPUs were used the most. Others may execute background tasks at the same time, such as the garbage collector, so the others CPUs won't be completely flat, but the work certainly is not being evenly spread amongst all possible CPUs.
Back in the Main method, modify the query to make a call to the AsParallel extension method as follows:
    var squares = numbers.AsParallel()
      .Select(number => number * 2).ToArray();
Run the application again. Wait for the Task Manager or CPU History windows to settle and then press Enterto start the stopwatch and run the query.
This time, the application should complete in less time (although it might not be as less as you might hope for-managing those multiple threads takes extra effort!).
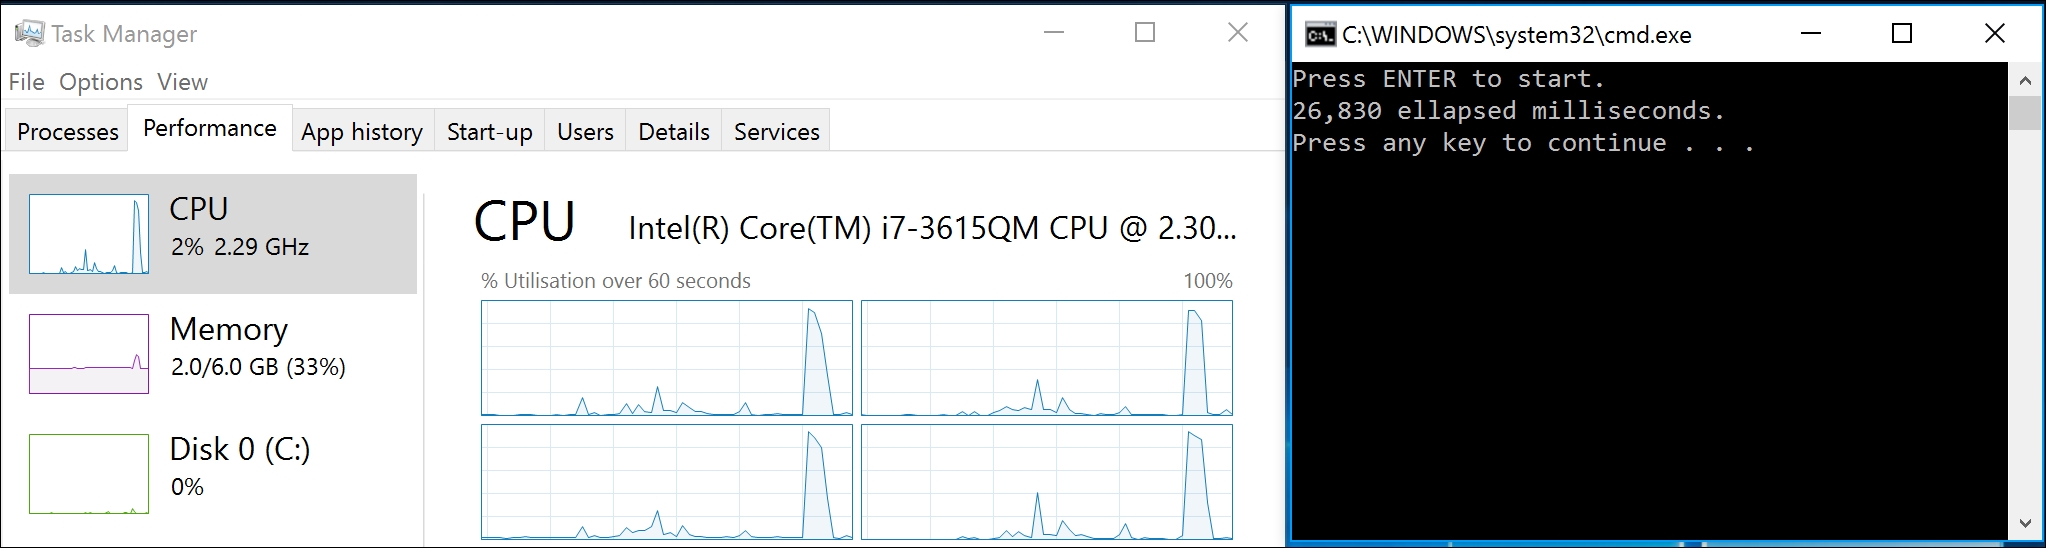
Press ENTER to start.
26,830 elapsed milliseconds.
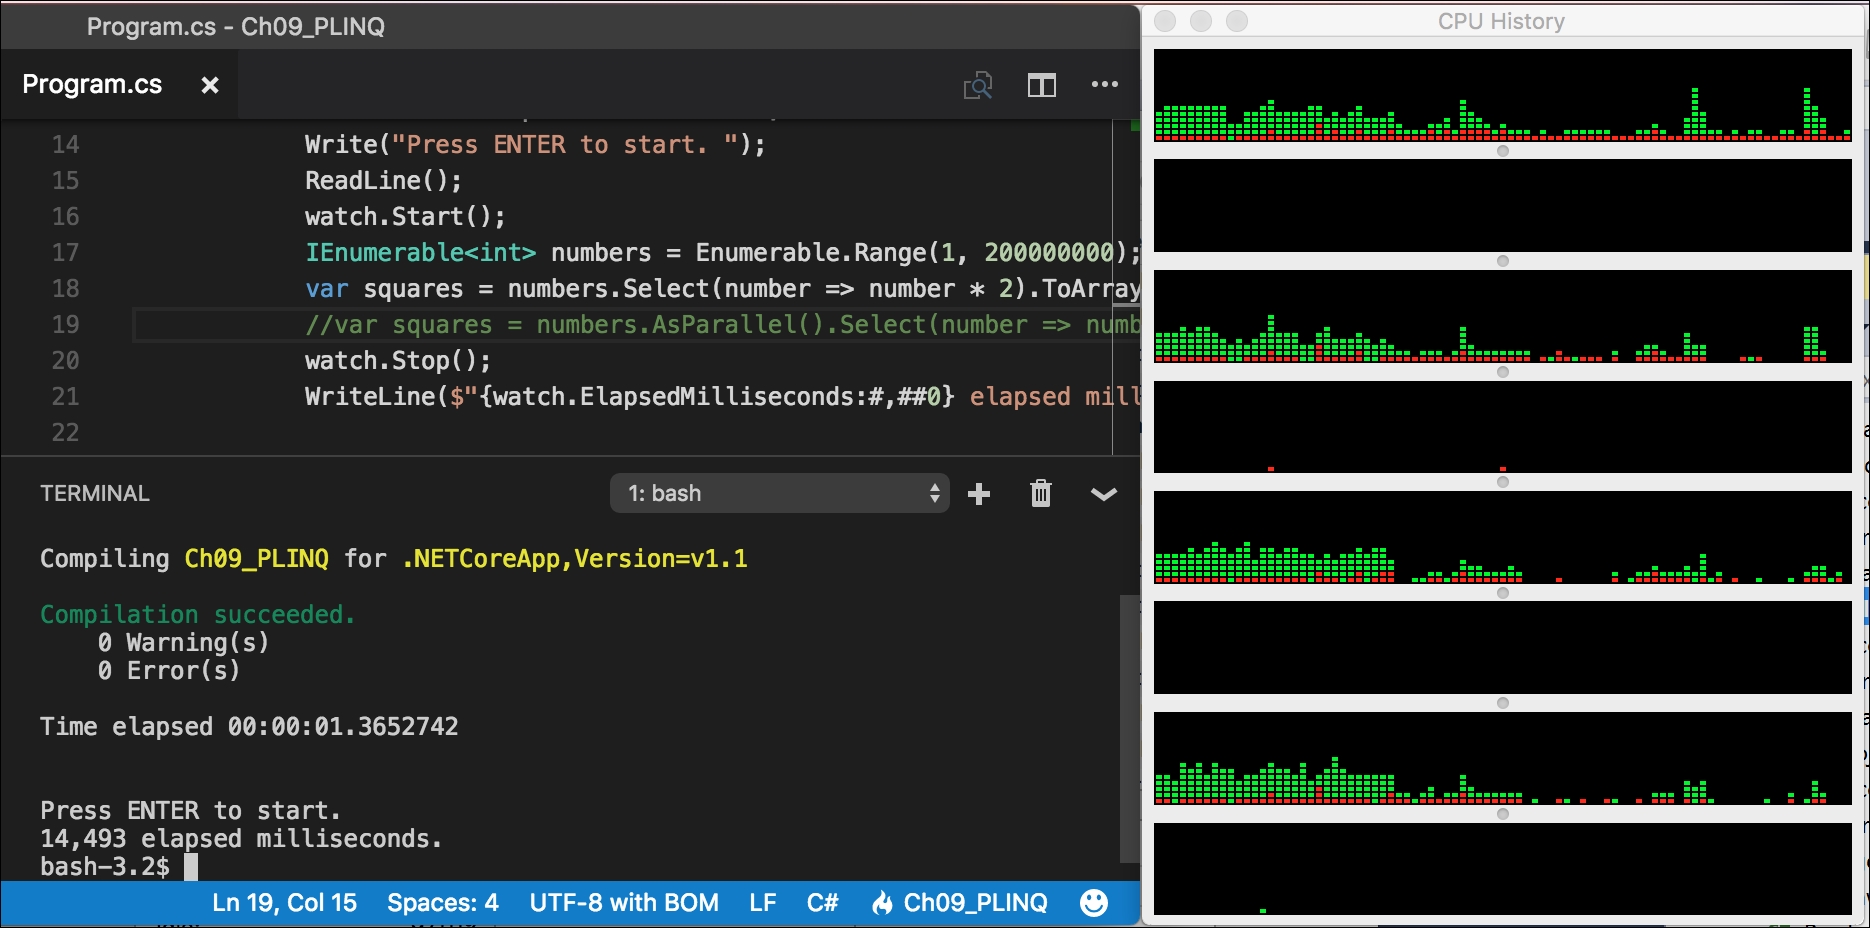
The Task Manager or CPU History windows should show that all CPUs were used equally to execute the LINQ query, as shown in the following screenshot for Windows 10:
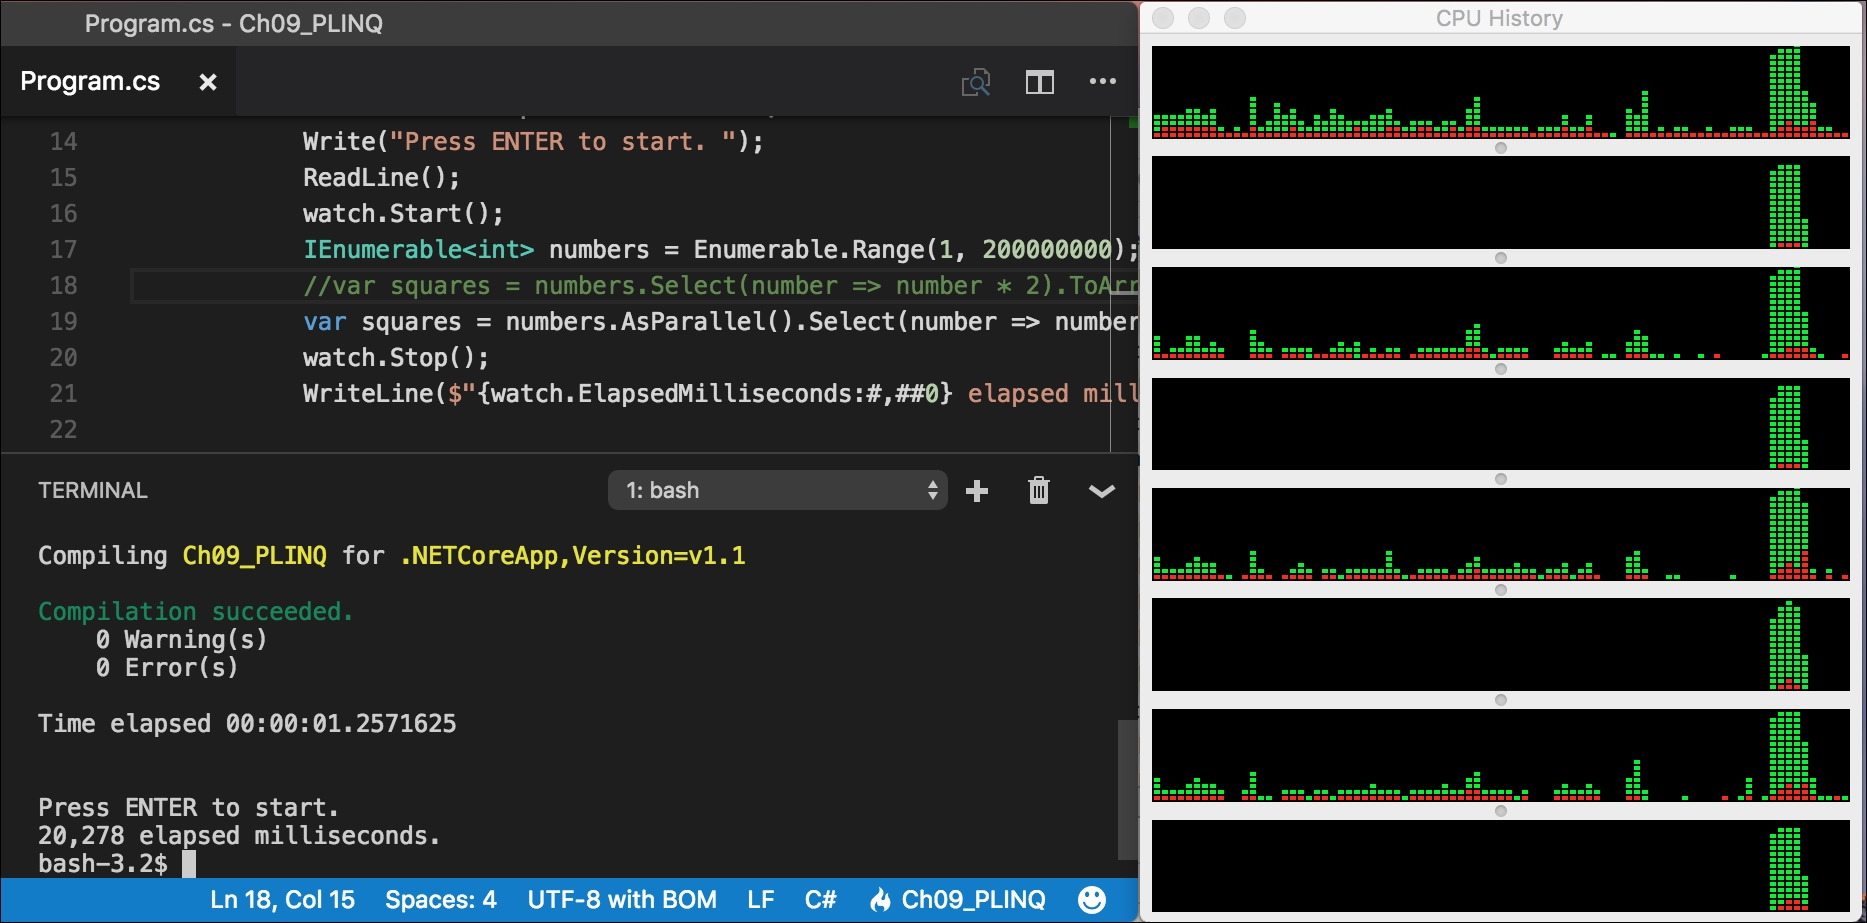
And, in this screenshot for macOS:
Note
You will learn more about managing multiple threads in Chapter 12, Improving Performance and Scalability with Multitasking.