Chapter 8
Capturing Traffic for Advanced Analysis
This chapter provides an overview of the following topics:
Packet Capture Essentials: This section illustrates the threat defense security engines and their components. The illustrations help you understand the root cause of a packet drop by the threat defense.
Best Practices for Capturing Traffic: In this section, you learn some of the best practices for keeping system performance at the optimal level while capturing traffic.
Capturing of Packets Using Secure Firewall: This section demonstrates the process of capturing traffic from the data interfaces of a threat defense using the management center GUI.
The objectives of this chapter are to learn about
The packet capture utility on the management center GUI
Capturing live traffic from the threat defense data interfaces
The differences between the packet capture and packet tracer tools
After configuring a threat defense in the desired deployment mode, you start creating various security policies. When the policies are deployed, you expect that only the desired traffic will go through the threat defense. However, if your deployment exhibits any connectivity issues, you should first verify your configurations. When you are unable to find any issues with the configurations, you might want to capture live traffic and analyze it. Capturing traffic is an advanced but critical step in investigating any connectivity issues in a network. This chapter discusses the processes to capture live traffic from the data interfaces of a threat defense.
“Do I Know This Already?” Quiz
The “Do I Know This Already?” quiz enables you to assess whether you should read this entire chapter thoroughly or jump to the “Exam Preparation Tasks” section. If you are in doubt about your answers to these questions or your own assessment of your knowledge of the topics, read the entire chapter. Table 8-1 lists the major headings in this chapter and their corresponding “Do I Know This Already?” quiz questions. You can find the answers in Appendix A, “Answers to the ‘Do I Know This Already?’ Quizzes.”
Table 8-1 “Do I Know This Already?” Section-to-Question Mapping
Foundation Topics Section | Questions |
|---|---|
Packet Capture Essentials | 1 |
Best Practices for Capturing Traffic | 2 |
Capturing of Packets Using Secure Firewall | 3, 4 |
Caution
The goal of self-assessment is to gauge your mastery of the topics in this chapter. If you do not know the answer to a question or are only partially sure of the answer, you should mark that question as wrong for purposes of the self-assessment. Giving yourself credit for an answer you correctly guess skews your self-assessment results and might provide you with a false sense of security.
1. Which engine is responsible for analyzing traffic in a threat defense?
ASA engine.
Snort engine.
Lina engine.
All of these answers are correct.
2. Which of the following statements is true?
Capturing traffic can increase the CPU utilization of a threat defense.
A threat defense is designed to capture traffic only for troubleshooting purposes.
You can use the management center GUI to capture traffic from the threat defense interfaces.
All of these answers are correct.
3. What does the Stop When Full option do?
It stops a threat defense from further packet inspection.
It stops a threat defense from capturing traffic when the database is full.
It stops a threat defense from capturing traffic when the buffer is full.
It stops a threat defense from filling up the buffer when excessive traffic is in interfaces.
4. Which of the following statements is true about captured packets?
You can store captured packets into a file directly using the management center.
You can store the traces of captured packets in a cleartext format.
Packets that are seen live by the threat defense interfaces can be viewed offline.
All of these answers are correct.
Foundation Topics
Packet Capture Essentials
Threat defense software is a unified image that converges the features of a traditional Cisco ASA firewall, Snort-based IDS/IPS, and next-generation security features, including various advanced security technologies, such as network discovery, security intelligence, application control, file control, and an intrusion detection and prevention system. When a threat defense blocks the traversal of a packet from the ingress to the egress interface, it could happen due to any of these security components. Therefore, if two hosts experience any connectivity issues while sending traffic through a threat defense, it is essential to analyze packets to determine the root cause of the issue.
Figure 8-1 illustrates the various reasons for a packet drop by a threat defense.

Figure 8-1 Potential Reasons for a Packet Drop by a Threat Defense
After receiving packets on the ingress interface, a threat defense analyzes them based on all the enabled security policies. After the packets pass the security checks, the threat defense sends them to its egress interface. Primarily, two types of security engines analyze the packets throughout this process. They are the Snort engine and the firewall engine (see Figure 8-2 and Figure 8-3). So, when a packet is dropped by the threat defense, how could you determine the engine or the component that is responsible for that drop? The packet analysis can be a great troubleshooting step in this case.
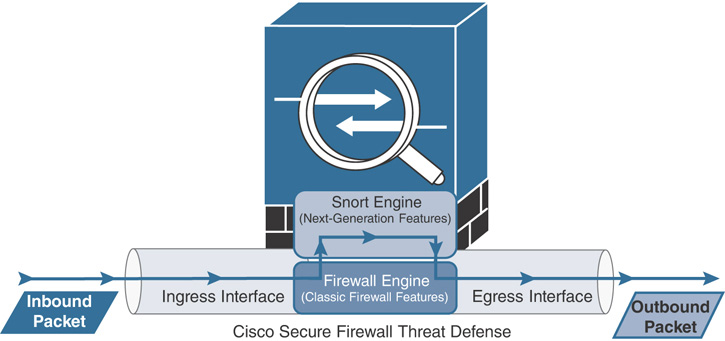
Figure 8-2 Flow of a Packet Through a Threat Defense

Figure 8-3 Processing of Packets by Various Components of Security Engines
Best Practices for Capturing Traffic
Before you consider capturing traffic, make sure you understand the following:
The primary objective of a threat defense is not to capture live traffic all the time. Besides controlling and inspecting traffic, a threat defense supports capturing live traffic only for troubleshooting purposes. If you need to capture traffic for a long period, you should find a dedicated system designed for this purpose.
Capturing live traffic on a production system can increase the CPU utilization; hence, it can degrade system performance. When necessary, capture traffic during a maintenance window.

Use specific packet filtering criteria to capture traffic. For example, define the source host and destination host precisely instead of including a broader subnet. Similarly, specify your desired protocol name instead of capturing traffic of all protocols.
Do not turn on the capture process to capture packets continuously because it can fill the buffer quickly. Use the Stop When Full feature to limit the number of packets to capture.
Use the management center GUI to capture traffic. Although the threat defense CLI allows you to capture traffic, the GUI offers a robust and easy-to-use web-based tool to capture traffic from any data interfaces of a threat defense. You can use the management center GUI to define packet filtering criteria, to capture traffic, to manage the capture process, and to save the captured packets into a PCAP file.
Capturing of Packets Using Secure Firewall
You can use the management center to capture traffic from any of its managed threat defense devices. The management center allows you to probe on any data interfaces that are configured and enabled on a threat defense. In the following sections, you learn how to capture packets from the ingress and egress interfaces of a threat defense, save them into a file (in PCAP file format), and then view them in packet analyzer software.
Figure 8-4 shows the lab topology that is used in this chapter to capture traffic. To generate live traffic, the outside host 192.168.1.200 will access the web server 192.168.1.2, located in the inside network.
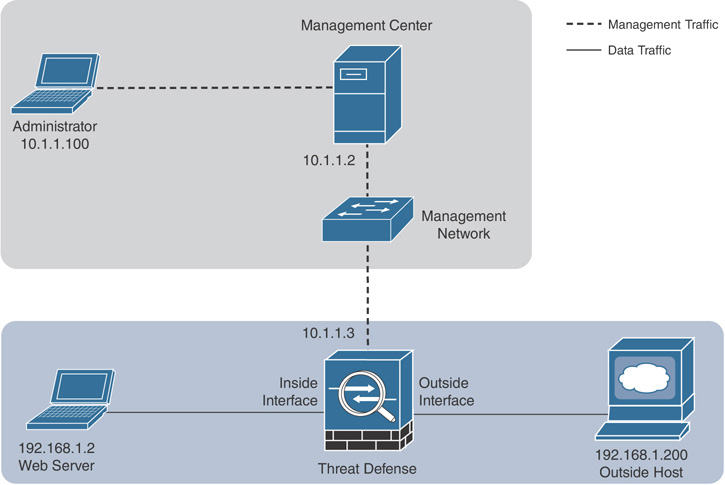
Figure 8-4 Lab Topology—Used in Chapter to Capture Packets
Configuration
To capture traffic from an interface of a managed device, follow these steps:
Step 1. Log in to the management center using a browser.
Step 2. Navigate to Devices > Device Management. The list of managed devices appears.
Step 3. Next to the threat defense name is an icon with three dots. Click the three dots. The device menu for that threat defense appears (see Figure 8-5).

Figure 8-5 Navigation to the Packet Capture Tool
Step 4. Select the Capture w/Trace option. The Advanced Troubleshooting page appears.
Step 5. On the Advanced Troubleshooting page, go to the Capture w/Trace tab. There, you can find a web interface for the packet capturing tool (see Figure 8-6).

Figure 8-6 User Interface for the Packet Capture Tool
Step 6. Click the Add Capture button. The Add Capture window appears.
Step 7. Create a capture for the outside interface. When you enter the matching criteria, try to be as specific as possible. For example, select the protocol that you want to analyze. Most importantly, define the source host and destination host precisely instead of including their broader subnet (see Figure 8-7).

Figure 8-7 Adding a Capture for the Outside Interface with Specific Filters
Step 8. You should select the Stop When Full option to ensure that the buffer will not be inundated by continuous packets. For each packet, if you want to view the actions and verdicts by every component of a threat defense, select the Trace check box. You should limit the number of packets you want to trace; otherwise, the buffer can fill up quickly. Figure 8-8 illustrates a scenario where packets are dropped due to overrun and no buffer.

Figure 8-8 Impact on Packets When the Buffer Is Full
Step 9. Save the capture. The capture process should begin automatically.
Step 10. Optionally, you can add a separate capture for the inside interface if you want to compare the packets received on both inside and outside interfaces. It can help to investigate the root cause of any connectivity issues.
Figure 8-9 shows two captures that are running on the inside and outside interfaces. You can use this page to stop, pause, modify, and save a capture.

Figure 8-9 Two Independent Capture Processes Are Running
Verification
After the packets are captured, you will start seeing them in the bottom frame of the Capture w/Trace page. If this is a lab environment (as shown in Figure 8-4), you can use the outside host to access the internal web server. It will generate traffic. If you do not see them being captured, make sure the process is running and click the circular refresh icon to retrieve the latest packets, as shown in Figure 8-9.
Figure 8-10 shows the detail of captured packets in the frame. The detail data appears when you enable the Trace option. You can scroll down to see the complete trace. Alternatively, you can copy and paste the text and save it in a text editor for future reference.

Figure 8-10 Trace of a Captured Packet (Partial View on the GUI)
Example 8-1 provides the trace data of two packets (packets 1 and 4) that are generated during the connection attempt of an outside host to a web server. The detail of trace data demonstrates how a packet is analyzed and allowed by each component of a threat defense.
Example 8-1 Detail Trace of Captured Packets (Copied from GUI)
1: 00:40:58.699258       192.168.1.200.52280 > 192.168.1.2.80: S
639843739:639843739(0) win 29200 <mss 1460,sackOK,timestamp 13333800 0,nop,wscale 7>
Phase: 1
Type: NGIPS-MODE
Subtype: ngips-mode
Result: ALLOW
Config:
Additional Information:
The flow ingressed an interface configured for NGIPS mode and NGIPS services will be
applied

Phase: 2
Type: ACCESS-LIST
Subtype: log
Result: ALLOW
Config:
access-group CSM_FW_ACL_ global
access-list CSM_FW_ACL_ advanced permit ip any any rule-id 268439552
access-list CSM_FW_ACL_ remark rule-id 268439552: ACCESS POLICY: AC Policy - Mandatory
access-list CSM_FW_ACL_ remark rule-id 268439552: L7 RULE: Ping Test
Additional Information:
 This packet will be sent to snort for additional processing where a verdict will be
reached

Phase: 3
Type: NGIPS-EGRESS-INTERFACE-LOOKUP
Subtype: Resolve Egress Interface
Result: ALLOW
Config:
Additional Information:
Ingress interface OUTSIDE_INTERFACE is in NGIPS inline mode.
Egress interface INSIDE_INTERFACE is determined by inline-set configuration

Phase: 4
Type: FLOW-CREATION
Subtype:
Result: ALLOW
Config:
Additional Information:
New flow created with id 195, packet dispatched to next module

Phase: 5
Type: EXTERNAL-INSPECT
Subtype:
Result: ALLOW
Config:
Additional Information:
Application: 'SNORT Inspect'

Phase: 6
Type: SNORT
Subtype:
Result: ALLOW
Config:
Additional Information:
Snort Trace:
Packet: TCP, SYN, seq 639843739
Session: new snort session
AppID: service unknown (0), application unknown (0)
Firewall: starting AC rule matching, zone -1 -> -1, geo 0 -> 0, vlan 0, sgt 0, src
sgt type 0, dest_sgt_tag 0, dest sgt type 0, user 9999997, icmpType 0, icmpCode 0
Firewall: allow rule,  'Default Action' , allow
Snort id 1, NAP id 2, IPS id 1, Verdict PASS
Snort Verdict: (pass-packet) allow this packet
Result:
input-interface: OUTSIDE_INTERFACE(vrfid:0)
input-status: up
input-line-status: up
Action: allow
.
.
<Traces of packet 2 and 3 are truncated for brevity>
.
.
4: 00:40:58.700342       192.168.1.200.52280 > 192.168.1.2.80: P 639843740:
639844072(332) ack 4184807056 win 229 <nop,nop,timestamp 13333801 2375771791>
Phase: 1
Type: FLOW-LOOKUP
Subtype:
Result: ALLOW
Config:
Additional Information:
Found flow with id 195, using existing flow

Phase: 2
Type: EXTERNAL-INSPECT
Subtype:
Result: ALLOW
Config:
Additional Information:
Application: 'SNORT Inspect'

Phase: 3
Type: SNORT
Subtype:
Result: ALLOW
Config:
Additional Information:
Snort Trace:
Packet: TCP, ACK, seq 639843740, ack 4184807056
AppID: service HTTP (676), application unknown (0)
Firewall: starting AC rule matching, zone -1 -> -1, geo 0(0) -> 0, vlan 0, sgt 0,
src sgt type 0, dest_sgt_tag 0, dest sgt type 0, user 9999997, url
http://192.168.1.2/files/ftd.png
Firewall: allow rule,  'Default Action' , allow
Snort id 1, NAP id 2, IPS id 1, Verdict PASS
Snort Verdict: (pass-packet) allow this packet
Result:
input-interface: OUTSIDE_INTERFACE(vrfid:0)
input-status: up
input-line-status: up
Action: allow
In addition to the detail trace data (displayed in Example 8-1), you can also save the original packets in the PCAP file format for future reference. Later, for further analysis, you can open the PCAP file in a packet analyzer tool like Wireshark (see Figure 8-11). Additionally, you can replay the captured packets in a PCAP file to emulate the connections in a lab environment. PCAP files are critical to an incident response team for forensic analysis.
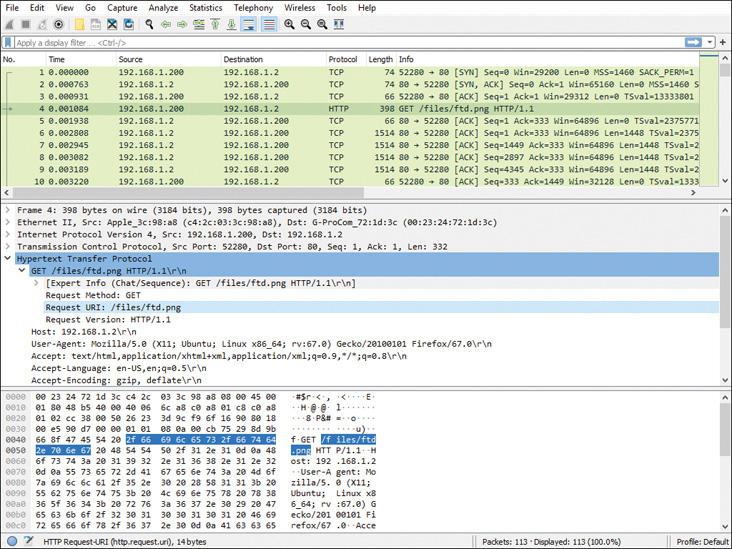
Figure 8-11 Captured Packets Are Saved and Viewed in a Packet Analyzer
Packet Capture versus Packet Tracer
The previous sections demonstrate the use of the packet capture tool. The example shows how to capture live traffic and how the trace option provides additional packet flow data. Because capturing live packets can be a CPU-intensive process, running the tool in a production environment requires careful planning. For a quick packet flow analysis, the packet tracer tool can be an easy alternative.
The packet tracer tool enables you to simulate the flow of a packet based on the security policies you deployed on a threat defense. The process is simple: you select an interface and packet type and provide the host detail, as shown in Figure 8-12. The tool uses that information to create a virtual packet. After you start the simulation, the virtual packet is evaluated against the security policies deployed on a threat defense. The verdict on a virtual packet can enable you to predict the potential impact of the security policies on live traffic. You can leverage this tool to investigate any connectivity issues in your real-world network.

Figure 8-12 User Interface for the Packet Tracer Tool
Summary
This chapter demonstrates the generation of live traffic between a web server and a client, provides detailed steps for capturing traffic between them using the management center, and then describes how to use a packet analyzer tool for further analysis. The chapter also illustrates the possible reasons for a packet drop and delineates the packet flow through different components of a threat defense. It empowers you to prepare for the next chapters because they will describe various security policies.
Exam Preparation Tasks
As mentioned in the section “How to Use This Book” in the Introduction, you have a couple of choices for exam preparation: the exercises here, Chapter 22, “Final Preparation,” and the exam simulation questions in the Pearson Test Prep practice test software.
Review All Key Topics
Review the most important topics in this chapter, noted with the Key Topic icon in the outer margin of the page. Table 8-2 lists a reference of these key topics and the page numbers on which each is found.
Table 8-2 Key Topics for Chapter 8
Key Topic Element | Description | Page |
|---|---|---|
Paragraph | Benefit of the packet capture tool | 158 |
List | Optimal performance during packet capture | 160 |
Paragraph | Packet tracer | 169 |
Memory Tables and Lists
There are no Memory Tables or Lists for this chapter.
Define Key Terms
Define the following key terms from this chapter, and check your answers in the Glossary: