
Chapter 21. Troubleshooting Wireless Connectivity
This chapter covers the following subjects
Troubleshooting Client Connectivity from the WLC: This section discusses how to use a wireless LAN controller as a troubleshooting tool to diagnose problems with wireless clients.
Troubleshooting Connectivity Problems at the AP: This section discusses how to diagnose problems between a wireless LAN controller and an AP that might affect wireless client connectivity.
As a CCNP network professional, you will be expected to perform some basic troubleshooting work when wireless problems arise. The exam blueprint focuses on configuration of Cisco wireless LAN controllers (WLCs), as well as problems with wireless client connectivity. This chapter helps you get some perspective on wireless problems, develop a troubleshooting strategy, and become comfortable using the tools at your disposal.
“Do I Know This Already?” Quiz
The “Do I Know This Already?” quiz allows you to assess whether you should read the entire chapter. If you miss no more than one of these self-assessment questions, you might want to move ahead to the “Exam Preparation Tasks” section. Table 21-1 lists the major headings in this chapter and the “Do I Know This Already?” quiz questions covering the material in those headings so you can assess your knowledge of these specific areas. The answers to the “Do I Know This Already?” quiz appear in Appendix A, “Answers to the ‘Do I Know This Already?’ Quiz Questions.”
Table 21-1 “Do I Know This Already?” Section-to-Question Mapping
Foundation Topics Section |
Questions |
Troubleshooting Client Connectivity from the WLC |
1–7 |
Troubleshooting Connectivity Problems at the AP |
8–10 |
1. Which of the following is considered to be the best first step in troubleshooting a wireless problem?
Reboot the wireless LAN controller
Gather more information to find the scope of the problem
Access the WLC and search for clients in the error logs
Access the WLC and look for alarms; if none are found, close the incident ticket
2. To troubleshoot a single wireless client, which one of the following bits of information would be most helpful in finding the client device in a wireless LAN controller?
The Ethernet MAC address of the client device
The end user’s name
The wireless MAC address of the client device
The name of the application having issues
3. Suppose you have accessed a WLC to search for a client’s MAC address. Information about the client is displayed, along with a sequence of dots indicating connectivity. The last green dot in the sequence is labeled Online. Which one of the following statements is the most correct?
The client device is powered up and online but has not begun to join the wireless network.
The client device has successfully joined the wireless network.
The client device has associated with an AP to get online but has not authenticated successfully.
None of the above
4. According to the Connectivity chart on the WLC’s Client View screen, which one of the following states indicates that a wireless client has met all of the requirements to begin using a wireless network?
Association
Start
Authentication
DHCP
Online
5. Suppose an end user tried to join a wireless network several minutes ago. The WLC Client View screen shows the client to be in the Association state but not the Authentication state. Which one of the following best describes the client’s current condition?
The client does not support any of the 802.11 amendments.
The client has an incorrect pre-shared key.
Spanning Tree Protocol is blocking the AP’s uplink.
The client failed to receive an IP address.
6. Suppose that you have a large wireless network with several controllers, many APs, a RADIUS server, and a syslog server. A user has reported connectivity problems in a specific building location but has provided no details about the AP or controller he tried to join. Which one of the following is the most efficient troubleshooting method you can use to find information about the client?
Go to the client’s location and use your own computer to associate with the network and then find out which AP and controller you are using
Access each WLC and check the status of every AP that is joined to it
Search for the client’s MAC address on each controller
Search for the client’s MAC address on the RADIUS server
7. Suppose you search a WLC for a client device’s MAC address. The results show a Connection Score value of 10%. Which one of the following correctly describes the scenario?
The client is using its connection only 10% of the time.
The client is currently in the bottom 10% of all wireless clients in data usage.
The client has a received signal strength of 10% at the AP.
The client is currently using a data rate that is 10% of its maximum capability.
8. Suppose that you have just received news that no users can connect with a newly installed AP. Which one of the following bits of information would be important when you search for the AP’s name from the WLC? (Choose all that apply.)
The AP has a valid IP address.
The AP is not found.
The AP has no channel numbers listed for the 2.4 and 5 GHz bands.
The AP has a valid MAC address.
9. Suppose you search for an AP on a WLC and notice that Noise is −20 on the 2.4 GHz band. Which of the following statements is correct?
The noise is at a very low level, which is good for wireless performance.
The noise is at a very high level, which is good for wireless performance.
The noise is at a very low level, which is bad for wireless performance.
The noise is at a very high level, which is bad for wireless performance.
10. Suppose you access a WLC and search for the name of a specific AP for which users have complained about problems. When you look at the 5 GHz information about the AP, you notice that it is using channel 60 and has 5 dBm transmit power, 65 clients, −90 noise level, 1% channel utilization, and the Air Quality value 10. Which of the following conclusions would be most accurate?
The AP has too many clients using the 5 GHz channel, which is causing poor performance.
The noise level is too low, which is causing poor performance.
The channel utilization is too low, which is keeping clients from using the channel.
The Air Quality value indicates a severe problem with interference on the channel.
Answers to the “Do I Know This Already?” quiz:
1 B
2 C
3 B
4 E
5 B
6 C
7 D
8 A, B, C
9 D
10 D
Foundation Topics
When one or more network users report that they are having problems, your first course of action should be to gather more information. Begin with a broad perspective and then ask pointed questions to narrow the scope of possible causes. You do not want to panic or waste time chasing irrelevant things. Instead, ask questions and try to notice patterns or similarities in the answers you receive.
For example, if you get reports from many people in the same area, perhaps an AP is misconfigured or malfunctioning. Reports from many areas or from a single service set identifier (SSID) may indicate problems with a controller configuration. However, if you receive a report of only one wireless user having problems, it might not make sense to spend time troubleshooting a controller, where many users are supported. Instead, you should focus on that one user’s client device and its interaction with an AP.
As you prepare to troubleshoot a single wireless client, think about all the things a client needs to join and use the network. Figure 21-1 illustrates the following conditions that must be met for a successful association:
The client is within RF range of an AP and asks to associate.
The client authenticates.
The client requests and receives an IP address.
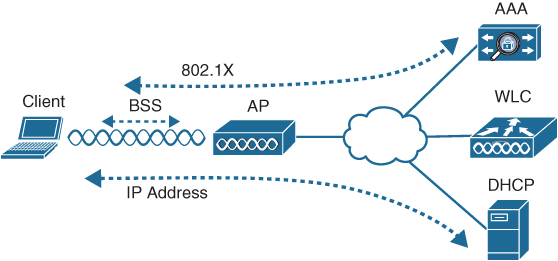
Figure 21-1 Conditions for a Successful Wireless Association
Try to gather information from the end user to see what the client is experiencing. “I cannot connect” or “The Wi-Fi is down” might actually mean that the user’s device cannot associate, cannot get an IP address, or cannot authenticate. A closer inspection of the device might reveal more clues. Therefore, at a minimum, you need the wireless adapter MAC address from the client device, as well as its physical location. The end user might try to tell you about a specific AP that is in the room or within view. Record that information, too, but remember that the client device selects which AP it wants to use—not the human user. The device may well be using a completely different AP.
The sections in this chapter start by focusing on a single client device and then broaden outward, where multiple clients might be affected.
Troubleshooting Client Connectivity from the WLC
Most of your time managing and monitoring a wireless network will be spent in the wireless LAN controller GUI. As a wireless client probes and attempts to associate with an AP, it is essentially communicating with the controller. You can access a wealth of troubleshooting information from the controller, as long as you know the client’s MAC address.
Cisco WLCs have two main GUI presentations—one for monitoring and one for more advanced configuration and monitoring. When you open a browser to the WLC management address, you see the default screen that is shown in Figure 21-2. The default screen displays network summary dashboard information on the right portion and monitoring tools in the list on the left. Most of the troubleshooting topics discussed in this chapter use the tools in the left column list.

Figure 21-2 The Initial Default WLC Display
If you know a specific wireless client’s MAC address, you can enter it into the search bar at the top right of the screen. For example, in Figure 21-3, 78:4b:87:7b:af:96 is the target of the search. Because that MAC address is known to the controller, a match is shown with a client icon below the search bar. You can either press the Enter key or click on the shaded MAC address to display detailed information about the client.
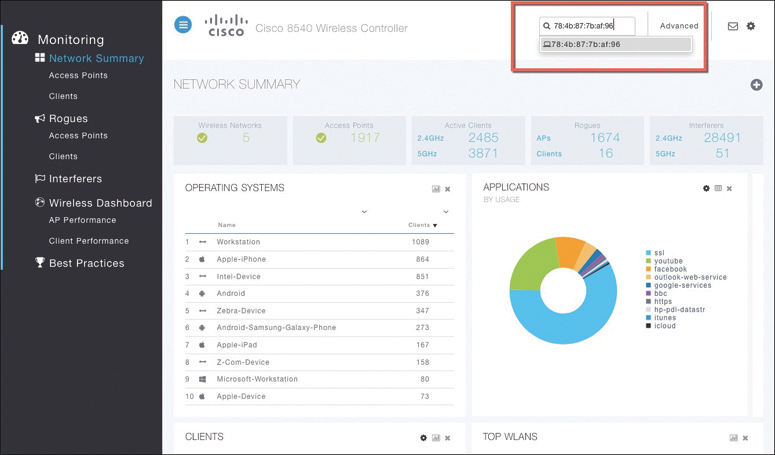
Figure 21-3 Searching for a Client in the WLC GUI
The resulting details about the client are displayed in the Client View screen, shown in Figure 21-4. From this output, you can see many details about the client device listed in the left portion of the screen, and you can see connectivity and application information displayed on the right.
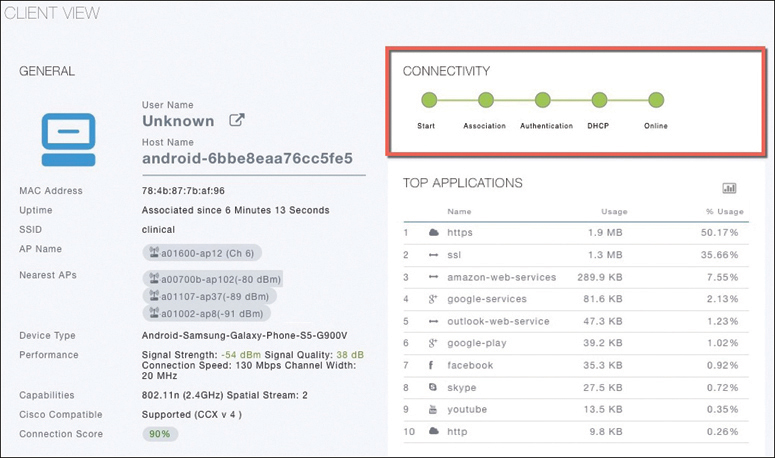
Figure 21-4 Client Search Results
Checking the Client’s Connection Status
Perhaps the most important information about the client is shown as the sequence of large dots under the Connectivity heading (refer to Figure 21-4). Before a controller will permit a client to fully associate with a basic service set (BSS), the client must progress through a sequence of states. Each state refers to a policy that the client must meet before moving on to the next state. The dots represent the client’s status at each of the following crucial steps as it attempts to join the wireless network:
Start: Client activity has just begun.
Association: The client has requested 802.11 authentication and association with an AP.
Authentication: The client must pass a Layer 2 Pre-Shared Key (PSK) or 802.1x authentication policy.
DHCP: The WLC is waiting to learn the client’s IP address from a Dynamic Host Configuration Protocol (DHCP) server.
Online: The client has passed Layer 2 and Layer 3 policies, successfully associated, and can pass traffic.
If a step was successful, a green dot is displayed. If not, a black dot appears. A probing client always begins in the Start state and then moves into Layer 2 policy states and Layer 3 policy states as required. For example, if a client is attempting to associate with a WLAN that is configured for some form of 802.1x authentication, the client must pass through the Authentication state. If it successfully authenticates, it can move further down the list of states.
A client stuck in the DHCP state is having trouble obtaining an IP address. The controller monitors the DHCP request of each client, as well as the DHCP offer returned to each client. If an offer is not seen, the client is stuck waiting. (One exception is a client that is using a static IP address, without the need for DHCP. As long as the WLAN is configured to not require DHCP, the controller will move the client on through the DHCP state.)
Ultimately, each client should end up in the Online state, where it has fully associated with the BSS and is permitted to pass traffic over the WLAN. Figure 21-4 shows a client with all green dots, so you can assume that it has successfully joined the network and is able to pass data over it. If you find a client that is consistently shown in a state other than Online, the client must be having a problem passing the policy of that state.
Checking the Client’s Association and Signal Status
Next, notice the information displayed in the left portion of the Client View screen. You can see the wireless client’s username (if it is known), hostname, wireless MAC address, wireless connection uptime, and the SSID used. In Figure 21-4, the username is not known because the client does not authenticate itself with a username. The client has associated and authenticated to the SSID named clinical. The WLC also displays the AP name where the client is associated, along with a short list of nearest neighbor APs that have overheard the client’s signal. The signal strength at which each AP received the client is also shown. You can also see the client device type (Android-Samsung-Galaxy-Phone-S5-G900V) and its wireless capabilities (802.11n with two spatial streams).
For troubleshooting purposes, you can find some important information next to Performance. In Figure 21-4, the client’s signal has been received at −54 dBm, which is sufficiently strong. The signal quality, or signal-to-noise ratio (SNR), is 38 dB, which is very good. The client’s current connection speed or rate is 130 Mbps, and the channel width is 20 MHz. Remember that the SNR measures how many decibels the signal is above the noise floor. The SNR can be a low value for lower data rates to be successfully used, but it must be greater to leverage higher data rates.
The WLC calculates a connection score, which is a percentage value represented by the client’s current data rate divided by the lower maximum supported rate of either the client or the AP. For the client shown, 130 Mbps divided by 144 Mbps (the maximum rate supported by the client—but not shown) is 0.903, or 90%. With a high Connection Score percentage, we may assume that the client is enjoying good performance over the wireless connection.
Suppose that the same client moves to a different location and then complains of poor performance. By searching for the client’s MAC address on the WLC, you see the new information shown in Figure 21-5. This time, AP is receiving the client’s signal strength at −76 dBm and the SNR at 18 dB—both rather low values, causing the current data rate to fall to 29 Mbps. A quick look at the Connection Score value reveals a low 20%. It is safe to assume that the client has moved too far away from the AP where it is associated, causing the signal strength to become too low to support faster performance. This might indicate that you need to place a new AP in that area to boost the RF coverage. Or it could indicate a client device that is not roaming soon enough to a new AP with a stronger signal.
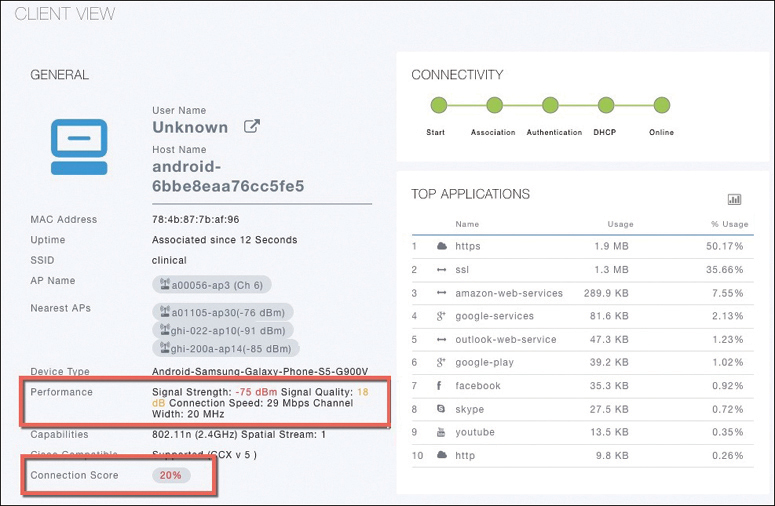
Figure 21-5 WLC Information About a Poorly Performing Client
You can click on the Connection Score value to see further details in a popup window, as shown in Figure 21-6. The 20% value is the result of the client’s current data rate (29 Mbps) divided by the lower of the AP or client maximum data rate (144 Mbps). In other words, a low score of 20% makes it clear that the client cannot take advantage of its full capability due to the poor RF conditions where it is currently located.
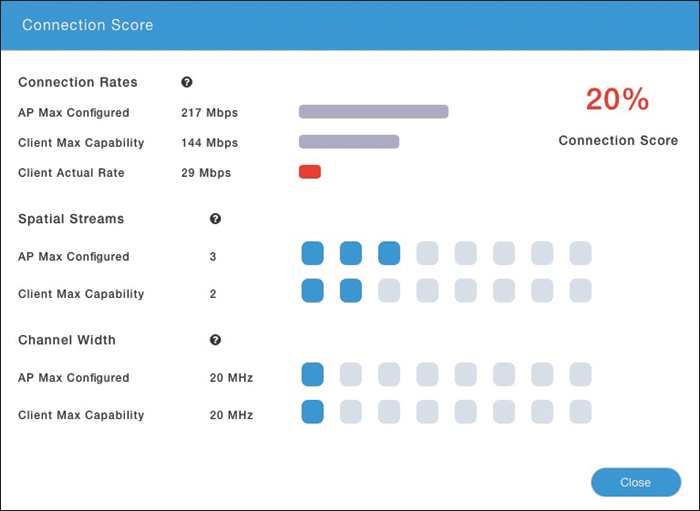
Figure 21-6 Displaying Detailed Client Performance Information
Think of the screen shown in Figure 21-6 as a graphical comparison of the connection rates, the number of spatial streams, and the channel width across the AP and the client device. The Client Actual Rate and Connection Score values are indicators of current performance, and the other graphs show what is possible on the AP and the client.
Checking the Client’s Mobility State
When a wireless network is built from many WLCs and APs, you might have difficulty finding which components a client is using at any given time. The WLC Client Search information includes a handy end-to-end graphical representation of a client’s wireless connection. When you scroll down below the General and Connectivity sections, you see a topology diagram like the one shown in Figure 21-7, with the relevant WLC on the left and the client on the right.
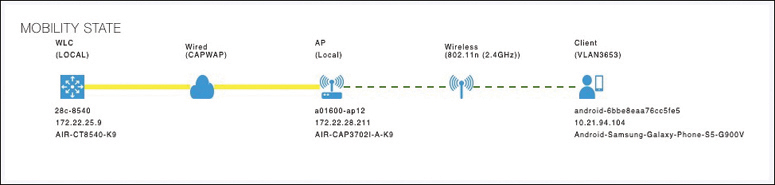
Figure 21-7 Displaying the Client Mobility State
From this information, you can quickly figure out which WLC the client is connected to. The WLC’s name, management IP address, and model are also displayed. Following the connection toward the right, you can see the AP name, IP address, and model where the client is associated, and you can see that the WLC and AP are communicating over a wired connection via the CAPWAP protocol.
Moving further to the right, you can see that the client is associated to the AP over the 2.4 GHz band using the 802.11n protocol. The client device is displayed with identifying information such as the device name, device type, VLAN number, and IP address.
Checking the Client’s Wireless Policies
By scrolling further down in the Client Search information, you can verify information about network, QoS, security, and other policies that affect the client, as shown in Figure 21-8. You can quickly learn the client’s IP address, VLAN number, QoS policy level used by the WLAN, security policy (WPA2), encryption cipher (CCMP AES), and authentication type (PSK with no EAP).
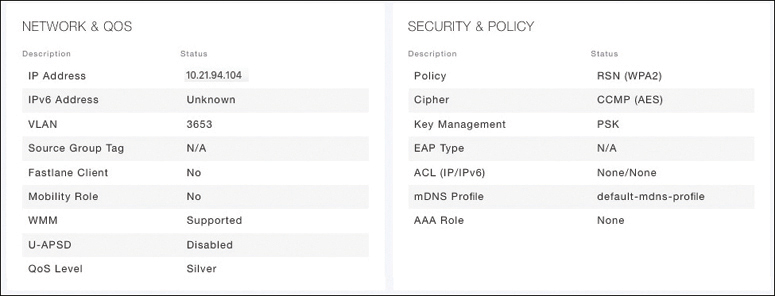
Figure 21-8 Displaying the Wireless Policies Used by a Client
Testing a Wireless Client
When you search for a specific client, the information displayed is of a static nature because it is obtained as a snapshot at the time of the search. If the client happens to move at a later time, its RF conditions and AP association could change. Therefore, you would need to refresh the client search to get up-to-date data. You can also obtain dynamic data by testing a client in real time.
By scrolling to the bottom of the client search information, you can see the Client Test section, which offers links to four client testing tools:
Ping Test: The WLC sends five ICMP echo packets to the client’s IP address and measures the response time, as shown in Figure 21-9.

Figure 21-9 Testing Ping Response Times Between the WLC and a Client
Connection: The WLC debugs the client for up to three minutes and checks each policy step as the client attempts to join the wireless network. Figure 21-10 shows a client that has successfully joined, and Figure 21-11 shows a client that failed Layer 2 authentication with a pre-shared key because its key did not match the key configured on the WLC.
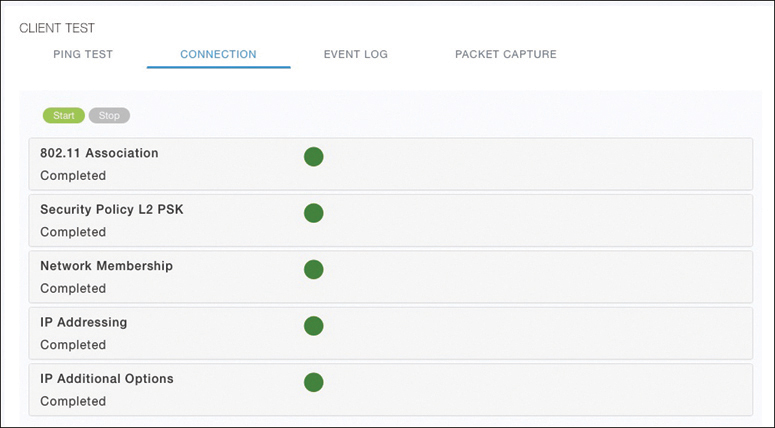
Figure 21-10 Performing a Connection Test on a Successful Wireless Client
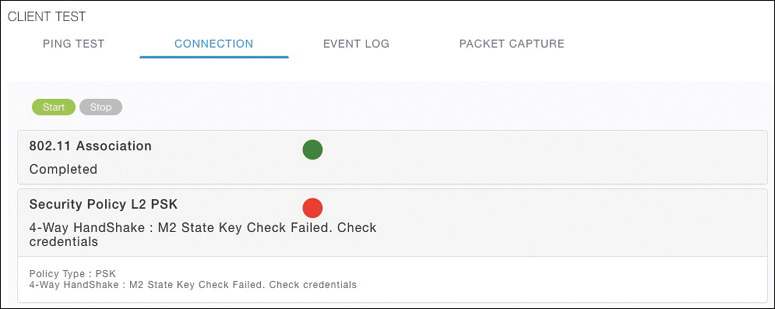
Figure 21-11 Performing a Connection Test on a Failed Wireless Client
Event Log: The WLC collects and displays a log of events as the client attempts to join the wireless network, as shown in Figure 21-12. This information is very complex and detailed and is usually more suited for Cisco TAC engineers.
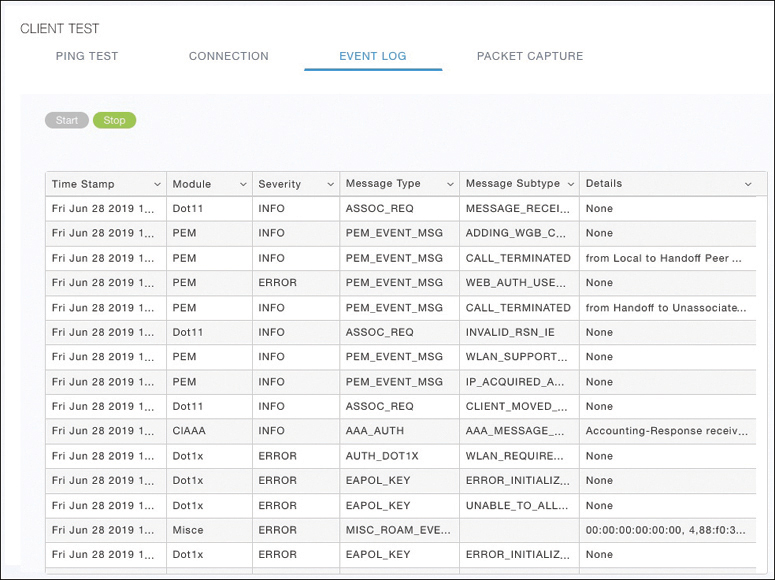
Figure 21-12 Collecting an Event Log of a Client Join Attempt
Packet Capture: The WLC enables a wireless packet capture at the AP where the client attempts to join, as shown in Figure 21-13. The captured data is saved to a specified FTP server, where it can be downloaded and analyzed using a packet analysis tool like Wireshark or LiveAction Omnipeek.

Figure 21-13 Performing a Packet Capture of a Wireless Client
Troubleshooting Connectivity Problems at the AP
In cases where you get reports from multiple users who are all having problems in the same general area, you might need to focus your efforts on an AP. The problem could be as simple as a defective radio, where no clients are receiving a signal. In that case, you might have to go onsite to confirm that the transmitter is not working correctly.
Otherwise, the split-MAC architecture creates several different points where you can troubleshoot. Successfully operating the lightweight AP and providing a working BSS require the following:
The AP must have connectivity to its access layer switch.
The AP must have connectivity to its WLC, unless it is operating in FlexConnect mode.
First, verify the connectivity between an AP and a controller. Usually you do this when a new AP is installed, to make sure it is able to discover and join a controller before clients arrive and try to use the wireless network. You can also do this at any time as a quick check of the AP’s health.
The easiest approach is to simply look for the AP in the list of live APs that have joined the controller. If you know which controller the AP should join, open a management session to it. Enter the AP’s name in the search bar. If the search reveals a live AP that is joined to the controller, information is displayed in the Access Point View screen, as shown in Figure 21-14.
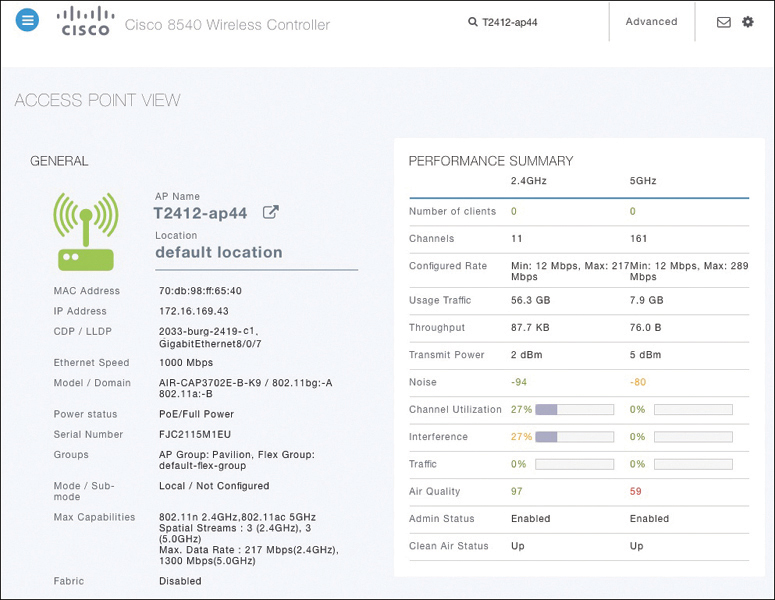
Figure 21-14 Displaying Information About an AP
The information in the left portion pertains to the AP and its connection to the wired network. For example, you can see in Figure 21-14 that the AP named T2412-ap44 has an IP address and has a valid CDP entry that shows the switch name and port number where it is connected. Obviously, the AP has a live Ethernet connection with a switch and has working Power over Ethernet (PoE). You can also confirm the AP’s maximum wireless capabilities.
In the right portion of the Access Point View screen, you can verify parameters related to the AP’s wireless performance and RF conditions. Figure 21-15 shows only this information for clarity. For example, the AP has two radios (2.4 and 5 GHz), which are both enabled and using channels 11 and 161, respectively. You can see the amount of traffic used through the AP, the average throughput, and the transmit power level used on each radio.
Notice that the channel utilization is 27% on the 2.4 GHz channel and 0% on 5 GHz. You can assume that channel 11 is rather busy in that location, while channel 161 is not. The channel utilization indicates how much of the available air time is being consumed; higher utilizations mean that wireless devices will have less time available to claim the channel and transmit data. From the top of the chart, you can see that there are no clients associated to this AP on either channel. How can channel 11 be significantly utilized if there are no clients using it? Keep in mind that there can be other APs and clients using that same channel 11 somewhere nearby. If those devices are busy transmitting on channel 11 and this AP is within range to receive their signals, the AP will note that the channel was in use.

Figure 21-15 Performance Summary Information from Figure 21-14
You might also notice that the AP has 27% interference on channel 11 and 0% on channel 161. Typically channels in the 2.4 GHz band are crowded and interference from both 802.11 and non-802.11 devices is common. Greater interference can contribute to poorer performance on a channel. Channels in the 5 GHz band are more numerous and are usually more clear of interference.
Another important indicator is the noise level on a channel. Noise is usually considered to be the energy received from non-802.11 sources. Ideally, the noise level should be as low as possible, usually around −90 or −100 dBm, so that 802.11 signals can be received intelligibly and accurately. Figure 21-15 lists the 5 GHz channel 161 as having a high noise level of −80 dBm—something that is not normal or ideal.
The channel information also shows an index of air quality. This is a measure of how competing and interfering devices affect the airtime quality or performance on a channel, presented as a number from 0 (worst) to 100 (best). For the best performance, a channel should have a high air quality value. A Cisco AP contains a built-in spectrum analyzer that can monitor wireless channels to detect and identify sources of interference.
The AP information in Figure 21-15 shows the air quality of channel 11 as 99, which is very good. However, channel 161 is 59, which is of concern. You can scroll further down in the Access Point View screen to see detailed information about the AP—a list of clients it is supporting, RF troubleshooting information, clean air assessments, and a tool to reboot the AP.
In Figure 21-16, the RF Troubleshoot tab has been selected to display interferer data for the channels in the 5 GHz band. There are no interfering neighbor or rogue APs, but there is a clean air interferer in channel 161—the channel that the AP is using.
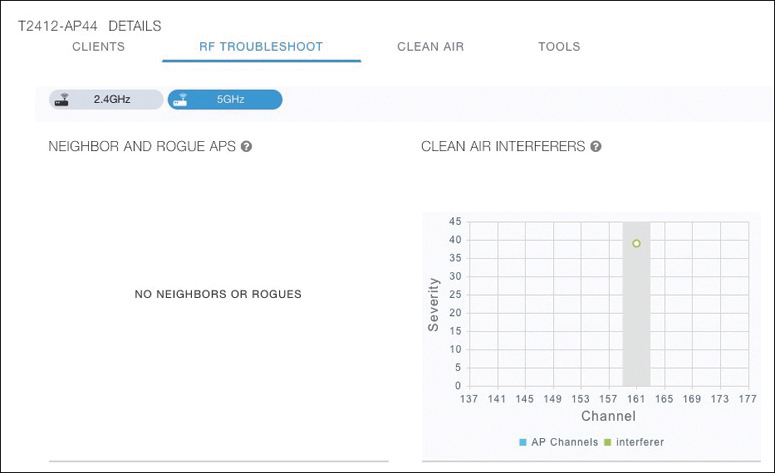
Figure 21-16 Displaying Information About RF Interferers
You can select the Clean Air tab to see more details about the interfering devices that have been detected. In Figure 21-17, the Active Interferers table lists one continuous transmitter device with a severity level of 45, a duty cycle of 100%, and an RSSI value of −78 dBm. The severity level indicates how badly the interferer is affecting the channel. The duty cycle represents the percentage of time the device is actually transmitting. Because the duty cycle is 100%, the device has the potential to affect the channel all the time, resulting in a high severity index. The two bar graphs represent the percentage of time the device is using the channel and the received signal strength level of the device. If users are complaining about problems when they are around this AP, you should focus your efforts on tracking down the continuously transmitting device. The best outcome is if the device can be disabled or moved to an unused channel. If not, you will likely have to reconfigure the AP to use a different channel to move away from the interference.
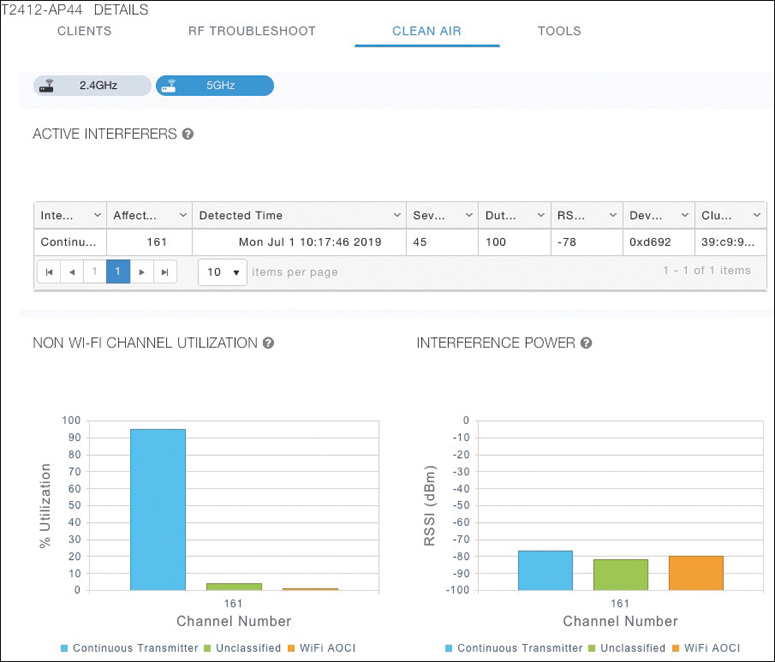
Figure 21-17 Displaying Information
Exam Preparation Tasks
As mentioned in the section “How to Use This Book” in the Introduction, you have a couple of choices for exam preparation: the exercises here, Chapter 30, “Final Preparation,” and the exam simulation questions in the Pearson Test Prep Software Online.
Review All Key Topics
Review the most important topics in this chapter, noted with the Key Topic icon in the outer margin of the page. Table 21-2 lists these key topics and the page number on which each is found.
Table 21-2 Key Topics for Chapter 21
Key Topic Element |
Description |
Page Number |
Conditions for a Successful Wireless Association |
579 |
|
List |
WLC client states |
582 |
WLC Information About a Poorly Performing Client |
583 |
|
List |
Tools to test client operation |
585 |
Displaying Information About an AP |
589 |
|
Paragraph |
Interpreting air quality values |
590 |
Complete Tables and Lists from Memory
There are no memory tables in this chapter.
Define Key Terms
There are no key terms in this chapter.