
Chapter 9
Setting and Measuring Against Realistic Goals
Even if you’re just trying to improve one or two small processes, being clear about your goals and having an explicit plan for how you will measure progress against those goals will improve your overall chances of success. In this chapter, we’ll talk about various aspects of setting goals and some aspects of measuring against them that you may not have seen before. Note that here and elsewhere in the book, when we talk about goals, we’re talking about the general notion of goals as something that you are striving to achieve. In CMMI, goals are actually a model contruct—there are Specific Goals and Generic Goals. When we are using the CMMI notion of goals, we’ll capitalize them as you see here to distinguish them from the common usage.
9.1 Setting Goals and Success Criteria Aligned with Sponsor Objectives
There is some direct guidance related to this task in three Process Areas of CMMI: Organizational Process Focus (OPF) (through the IPPD-related goals), Integrated Project Management (IPM), and Measurement and Analysis (M&A). In addition, when thinking about sources of goals, two other Process Areas—Organizational Innovation and Deployment (OID) and Causal Analysis and Resolution (CAR)—may be useful.
It may seem strange for us to mention two Process Areas that, from a Maturity Level viewpoint, are high maturity Process Areas (OID and CAR are both Maturity Level 5 Process Areas). It is true the greatest benefit from both of these comes when you have a quantitative basis for making the decisions called for in their practices. However, we see organizations making good use of the practices in these Process Areas even at the beginning of their improvement journey.
In relation to setting and measuring goals, both CAR and OID have practices related to selecting improvements to try in the organization. In CAR, the decision is based on analyzing past defects and problems to see how to prevent them in the future. In OID, the decision is based on analyzing what’s going on in the overall organization as well as outside the organizational boundaries to find potential innovations and improvements. Both of these are good sources of candidate improvement goals. Both also talk about evaluating the results from the improvements you make, which relates to measuring against your goals. In the following discussion we look at the primary process areas that directly address sources of improvement goals and measuring against them.
Organizational Process Focus emphasizes creating and following a process improvement plan that is based on the sponsor’s objectives.
In IPM, one of the specific practices is
SP 3.1 ESTABLISH THE PROJECT’S SHARED VISION.1
Establish and maintain a shared vision for the project.
1. Chrissis, Mary Beth, et al. CMMI: Guidelines for Process Integration and Product Improvement. 2d ed. (Boston: Addison-Wesley, 2006). All references to CMMI components in this chapter are from this source.
Creating a shared vision of the improvement project is one of the ways to understand whether you have correctly understood and aligned this initiative with your sponsor’s objectives. The term shared vision is defined in the CMMI glossary as “a common understanding of guiding principles including mission, objectives, expected behavior, values, and final outcomes, which are developed and used by a group, such as an organization, project, or team. Creating a shared vision requires that all people in the group have an opportunity to speak and be heard about what really matters to them.”
This is one of the places where the model uses its practices as a way to help organizations and projects (and remember, your process improvement effort is in many ways a project) understand the values upon which the model is based. This practice is at least as much about the value of open communication as it is about the mechanics of creating a shared vision.
Alignment with the organization is what is particularly called for in IPM. Organizational goals need to actually affect the behavior of the people who create organizational value or they aren’t very useful. In addition, projects are tied to the process objectives of the organization via IPM’s tailoring practices; these practices expect that your project’s process will be explicitly derived from the organization’s set of standard processes. In an organization that has invested in creating process guidance that reflects the organization’s goals, constraints, and values, this is another way to support alignment of projects with the organization.
Finally, in Measurement and Analysis, a Specific Goal focuses on establishing goals that are aligned with the organization’s objectives:
SG 1: ALIGN MEASUREMENT AND ANALYSIS ACTIVITIES
Measurement objectives and activities are aligned with identified information needs and objectives.
When you look at the Specific Practices under this Goal, you will see the focus on aligning measurement activities with the appropriate objectives and the information needed to accurately provide a perspective on whether those have been met.
9.1.1 Setting Useful Goals
As you can see from the preceding discussion, the goals that you set have a significant effect on what activities you undertake, how you decide to measure them, and what kinds of attitudes and behaviors you incentivize and discourage. So setting useful goals is something you should be willing to spend an appropriate amount of time and effort on with the leaders within your organization.
What is a useful goal? We like the model of SMART2 goals:
2. Rouillard, Larrie. Goals and Goal Setting: Achieving Measured Objectives. 3d ed. (Boston: Thomson Learning, 2003). This is only one of many sources for this acronym.
• Specific. It’s something whereby successful completion can clearly be determined.
• Measurable. The measure could be a specific value (average 500 widgets/day over 3 months), binary (yes/no), or scaled (10 percent versus 50 percent), but the measure must be appropriate for the goal.
• Achievable/Attainable. It’s something you can actually do something about.
• Realistic/Relevant. Even though it may be a stretch, it’s something you truly believe is within the capabilities of your staff and the constraints of your environment, and is something whose achievement will be beneficial to you.
• Time-based/Tangible. For some goals, a time factor is necessary; otherwise, the goal is OBE (overcome by events). Goals that are not time-based should be tangible and observable, so that an objective evaluation of their satisfaction is feasible.
Ideally, your improvement goals will be based on your business goals. There are lots of resources on business goals if you feel that you need to work on this before you get too involved in improvement activities. We often find that organizations haven’t spent enough effort thinking about their business goals to be able to tell what improvement goals would be most useful to them. If you don’t find something specifically on that topic, look in Strategic Planning references (we like the ones from www.grove.com). In particular, you might look for information on the Balanced Scorecard concept.3
3. Kaplan, David, and Norton, Robert. The Strategy-Focused Organization (Cambridge, Mass.: Harvard Business School Press, 2000).
The Balanced Scorecard concept is one that is used in many industries, and it provides a way of segmenting your goals so that no single aspect of your business gets exclusive focus. The scorecard is usually presented as a four-quadrant matrix, with typical headings including
• Financial. Goals related to the financial health of the organization.
• Customer. Goals related to the market segments and customer focus of the organization.
• Operations. Goals related to the processes, facilities, and other aspects of the organization. (This is where you most often see the initial alignment between business and improvement goals.)
• Learning and innovation. Goals related to improving the distinctive competencies of the organization and making it more responsive to the relevant changes in its technical and market environment.
Different authors use different specific labels, but these are the ones we find most useful.
In Chapter 15, we include an example of setting SMART process improvement goals for you to think about when developing your own goals.
9.1.2 A Word About Maturity Level Goals
In a book dealing with CMMI or any other model with associated achievement stepping stones, we really have to say something about a common improvement goal that we see in many organizations: the Maturity Level goal. This goal usually takes the form “Achieve Maturity Level <n> by <date y>.” The parts of SMART that this kind of goal usually violates are: A—it is often not achievable with the current staff capabilities, and R—the date time frame is often not Realistic, and the Relevance of this goal may be visible only to the managers who set it.
There’s one other problem with this goal, if you’re the person who agreed to be responsible: you can’t achieve it without successful adoption of the new practices in parts of the organization that you’re not responsible for. (Note that this goal doesn’t even talk about the organizational scope for this achievement—another problem.) This is not a goal that you should accept as “your” goal. It may be appropriate for the sponsor of the effort to accept, provided that he or she has explored the derivative goals that would need to be accepted by you and the parts of the organization that will be implementing the new practices.
More reasonable goals for the process improvement group (depending on where you are in your improvement effort) might be
• Facilitate at least two improvement teams that successfully implement new practices for the XYZ Process by implementing practices of the necessary CMMI Process Areas by <desired date>.
• Establish the measurement repository and procedures that will be needed to operate at Level <n> by <desired date>.
• Create and deploy end-user process description standards that are approved by the Steering Group by <desired date>.
• Ensure that role-based training for roles X, Y, and Z in processes A, B, and C are available for delivery by <desired date>.
Establishing (and negotiating) SMART goals for your improvement effort is challenging but necessary for an ongoing improvement effort.
9.1.3 Smart Goals for your First Dli Cycle
You may decide to adopt some simpler goals before investing in a huge amount of effort to align your organizational business goals with a set of organizational improvement goals. These are what we call “solve the problem” goals. They are usually much more constrained in scope and effort but are still valid SMART goals, and they are the kind of goals that often make the most difference in your organization’s willingness to go forward with an ongoing improvement effort. These are goals such as:
• By <desired date>, establish a mutually agreed-upon project-status meeting agenda to be used every month by the project team and the customer.
• By <desired date>, establish and use a procedure for approving changes to previously released products that is agreed to by all of the following roles: <list the stakeholders for this procedure>.
How do you find goals like these and determine whether achieving them is worth the effort invested? Sometimes it’s easy; just look at the minutes of your last few management meetings, and see what problems or issues keep coming up multiple times. Sometimes you need to spend a little time explicitly investigating where your staff are experiencing problems. Our technique for doing this includes the bonus of connecting typical business problems to areas of CMMI. (Someone familiar with another model could do something similar for that model.) It’s called CMMI-based Business Analysis, and step-by-step instructions for performing one are provided in Chapter 15.
9.2 Understanding the Current State of the Organization: Readiness and Fit Analysis for Cmmi
When deciding on your readiness to start a model-based improvement effort, we believe it’s best to go into it with your eyes wide open. One of the implications of this philosophy is that, as part of approaching process improvement, you should look at the “fit” of your organization’s conditions with the assumptions that are built into whichever model you’re planning to use. For the discussion of this technique, we’ll use CMMI as the model we’re comparing to.
A prerequisite to this technique is that you understand the assumptions of the model (or product; this technique is also useful for evaluating the fit of a particular support product to your organization). SuZ has developed analyses for several technologies and products that she has worked with. In general, anyone who is familiar with how a particular model is implemented should be able to look at one of our sample tables and derive a similar table for that model.
The organizational factors that are covered in this technique involve nontechnical factors that have historically affected (positively or negatively) adoption of practices/technologies similar to the one being contemplated. Several of these factors are derived from Paul Adler’s work related to updating a company’s technology base, and they are supplemented by SEI research related to managing technological change in organizations.4 Areas considered in the technique include
4. Adler, Paul. “Adapting Your Technological Base: The Organizational Challenge.” In Sloan Management Review, Fall 1990, pp. 25–37.
• Business Strategy. How well aligned is the model being contemplated with the overall business strategy of the organization?
• Reward System. How well has the organization constructed reward systems that encourage use of the new practices and discourage continuation of old practices?
• Sponsorship. How well does sponsoring management for new practice adoption “walk the talk” by recognizing and reinforcing use of the new practices?
• Work Practices. How easily does the organization historically implement work practice changes related to adoption of the model? (Note that the primary method of assessing this with a model like CMMI is to do some kind of practice-based gap analysis.)
• Values. How well does the organization match its own company values to the values implied by practices it has adopted in the past?
• Skills. Does the organization traditionally ensure that employees have relevant technical experience and/or project management experience related to adopting new practices?
• Structure. How well has the organization historically recognized the (potential) need for new roles and responsibilities when new practices were implemented?
• History. What lessons has the organization internalized (for good or ill!) related to past history of new practice adoption?
Understanding your organization’s historical pattern in these nontechnical risk areas can help you avoid choosing an improvement model as the basis for your improvement effort that is likely to play to your organization’s weaknesses versus its strengths.5
5. Garcia, Suzanne. “Managed Technology Adoption Risk: A Way to Realize Better Return from COTS Investments.” In Proceedings of International Conference on COTS- Based Systems 2004 (New York: SpringerVerlag, 2004), pp. 74–83.
9.2.1 What Does a Readiness and Fit Analysis (RFA) Look Like?
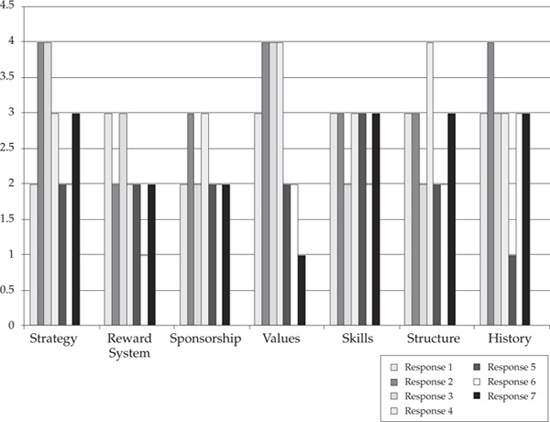
There are two elements of a RFA: a summary profile and a list of risks to be mitigated as part of the improvement planning activities. The summary profile can be represented either as a histogram (bar chart) or Kiviat diagram (also called a radar chart).
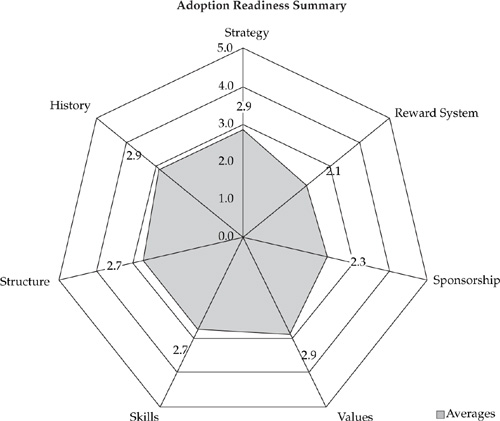
Figure 9-1 shows a bar-chart version of a RFA, and Figure 9-2 shows the same data depicted in a radar chart.
The bar chart helps you understand the variation in responses from the individuals who did the scoring; the radar chart helps you see where there are strengths and weaknesses related to the factors. In this example, the greatest strength is that CMMI fits well with the organization’s business strategy, but the rest of the factors are not differentiated dramatically. The two lowest are Reward System and Sponsorship (2.3 average rating each), so those would be the areas where we would expect to see the most significant risks come up in the risk-identification part of the RFA.
The second, and more important, part of the analysis is the identification of conditions or risks that led the people involved in the scoring to make that particular judgment. Here is a sample list of conditions that were identified during the running of several RFA workshops. Note that they take different language forms, depending on the way each organization talks about risks. These types of statements tend to be highly contextual to the organization that generates them, so they may be difficult for outsiders to understand.
Figure 9-1: RFA bar chart showing individual response variations
Strategy-related:
• Given new business and regenerated growth, resources will be fully utilized in this quest rather than improving performance.
• A higher force than process improvement here is customer management.
• The focus is toward winning business versus improvement.
Sponsorship-related:
• Rotation of top management is frequent, and consistency of sponsorship is not maintained.
• Given that we built a fear culture at the senior management review, there is a possibility that we will drive a fear-based culture throughout the organization.
• Top-management time may not be sufficient to support full rollout.
Figure 9-2: Radar-chart summary of CMMI Readiness and Fit Analysis
Reward System-related:
• Given that past projects have missed the overall cost when a single part of the organization benefits, there is a possibility that we will deploy processes that don’t lead to overall benefit.
• Given that each business area is measured on financial goals, there is a possibility that we have a very stovepiped approach.
Values-related:
• History suggests that we still reward firefighting above all other things; we have more qualified firefighters than any other discipline.
• High-level management is interested in metrics for driving improvements, but history means many people are suspicious of their intent and think punishment may follow.
• Some skill areas will find CMMI too much because they are still learning other skills.
• Structured training programs are not available and clear career development paths are not defined.
Structure-related:
• Values are not adopted at all levels; neither are they refreshed often enough.
• There are too many hats per person.
• Generally, we have the structure in place for management of projects, but there are risks with interfaces and definition of responsibilities and accountabilities.
History-related:
• Experience of past change: There is a possibility that we may not be aligned moving forward.
• Given that we are by nature a constantly changing organization, there is a possibility that new ways may, after CMMI is started, be seen as initiative.
When a set of conditions or risks has been generated that is specific to the organization, it can be used to plan (1) prioritization of model-based improvement activities and (2) specific mitigation strategies to improve the fit of the model to the organization.
9.2.2 A Nominal Assumptions Table for Cmmi †
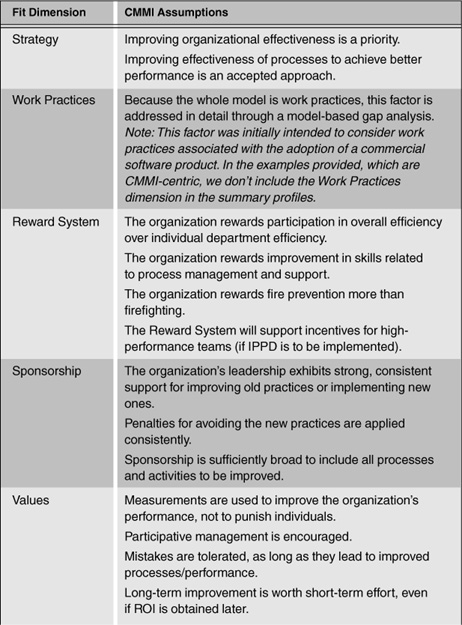
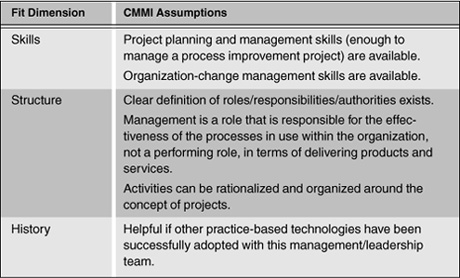
Table 9-1 is the assumptions table we’ve used with organizations to help them understand some of the nontechnical assumptions that are inherent in CMMI.
The characteristics listed in Table 9-1 provide a picture of the “ideal” organization implementing CMMI. You could argue that if all these elements were present, you wouldn’t need CMMI, which could be true. We’ve encountered very few organizations that exhibit all these characteristics and that don’t use a model or set of practices or principles similar to CMMI to guide them and keep them on track.
† Note that if you find other references to this technique, you’ll see the assumptions table referred to as a technology assumptions table. Those of us in the technology transition research field think of CMMI and similar models as process technologies. However, for many people, using this terminology proves problematic, so we’ve simplified the term for use in this example.
Table 9-1: CMMI Assumptions Table
One quick way you can use this table is to look at the assumptions and decide whether the things mentioned there are things you would like to see in your organization. If the traits shown are of no interest to you, you may find that another set of practices would be more useful (but be sure to check its assumptions also). If you’re in the situation of being “mandated” to use CMMI, you won’t be using these assumptions as much to check the desirability of using CMMI as you will to mitigate the risks of adopting CMMI into your organization.
For most potential sponsors of improvement, risk analysis is the primary use of RFA. Whether you have to use CMMI or think you want to use CMMI, knowing where the assumptions built into CMMI practices clash with your organization’s current characteristics helps you understand areas that you’ll have to spend more effort on in your change-management activities. In some cases, you may decide (if you have the choice) that your organization needs to work on some of these areas before formally adopting CMMI.
9.2.3 How do the Risks I’ve Identified Affect my Ideas?
By the time you get through choosing a set of three or so Process Areas and the projects and people you think should be involved in them, you’re at a good point to step back and compare the risks you identified through your Readiness and Fit Analysis with the PAs and projects you’ve chosen. If the projects you’ve selected reflect or exhibit the risks that you identified, you have a couple of choices:
1. Avoid that project, and pick one that doesn’t involve as many risks or risks as severe.
2. Work with that project, but include specific mitigation actions and monitoring to try to minimize the occurrence and/or effect of the identified risks.
If the risks you’ve identified make it clear that one of the PAs you’ve selected could be a problem, your choices are
1. Pick another PA that may not solve as big a problem but reflects fewer risks.
2. Work with that PA, but include specific mitigation actions and monitoring to try to minimize the occurrence and/or effect of the identified risks.
Chapter 15 provides more detailed instructions on performing Readiness and Fit Analysis.
9.3 How do you Tell if you’ve Succeeded?
In section 9.1, we highlighted the importance of establishing useful, achievable goals and identifying clear measures to record progress. In this section, we’ll look at measurement issues more closely, discuss some of the issues we’ve seen, and identify some approaches that can help you avoid or at least mitigate them.
The task is to define, and then measure progress against, realistic and measurable goals for your improvement effort. Most organizations that undertake model-based improvement have a mix of different goals in mind. There are usually some very well-defined goals, like “Reduce defects by some percentage in delivered products” or “Decrease time to market by some percentage.” Then there are always the somewhat squishy goals, like “Improve organizational communication.”
The well-defined goals are usually easy to measure, and ROI for the sponsors can be calculated in a straightforward manner. The squishy goals are harder to measure. How do you know if the organization is communicating better: because project performance has improved or because more people attend staff meetings? And what is it worth to have the organization communicating better? Trying to establish ROI here is on very shaky grounds, so to sell your sponsor, you may need to discover indirect measures that can help show the benefit. Squishy goals are also often difficult to accomplish. They may require a big enough improvement effort that you probably need to consider whether you have the money, and want to spend the money, on achieving them.
To be clear, though, measurable doesn’t always mean quantitative. Especially in the beginning, a goal that solves a specific problem is often the type that gives you immediate relief from some organizational pain, and the measurable improvement is “no more pain.” That’s a binary, qualitative measure, but it still could have powerful business value, depending on how the painful problem is actually affecting your business.
9.3.1 Return on Investment (ROI)
ROI is a thorny issue. The primary reason for this is that it involves business rather than technical measures. ROI is so highly dependent on how you define costs and benefits that it acts more as a sponsorship rationale than as a truly useful measure.
ROI is essentially the net benefits received less the expenditures made, divided by the net benefits. Defining costs is fairly straightforward. Labor hours, facilitation and meeting costs, and possibly lost productivity are all manageable and countable. It is the pesky benefits side of the equation that generally is the most difficult to pin down. One issue is causality. Process improvement rarely happens in a vacuum. There are always external factors that come into play. Did the defect rate improve because of process improvement or because of the new engineer we hired? Are we quicker to market because of leaner processes or because of the new Web-based development support environment? Generally, arguing causality is wasted effort. It becomes a matter of perception rather than fact. What you can do is compromise and claim some percentage of the specific benefit, although allocation can also be contentious.
Much can be gained by establishing your ROI measurement efforts with the idea of presenting the results to management firmly in mind. Don Reifer, a longtime engineering and process consultant, has wrestled with the ROI problem and how to present it to executive sponsors for many years. He offers some tips on packaging ROI numbers that we think are worthwhile, so (with his permission) we provide them here:
• When developing ROI numbers, use a multiyear timeframe. This approach makes the investment strategic and buys you several years to accumulate what management thinks is an acceptable return or payback.
• When pursuing reductions in cost, emphasize cost avoidance instead of cost savings, because management views the latter as reductions in staff, not expenses.
• Quantify cost avoidance simply by showing how costs on the organization’s highest-priority project (the “cash cow”) can be reduced through the use of existing process resources.
• Use cost models (such as COCOMO II for software) to show the cost, productivity, and time-to-market impacts of process improvement programs, both organizationally and for large and important projects. By varying model parameters such as Process Maturity (PMAT) in COCOMO II, you can show parametrically how effort and duration vary as a function of maturity level.
• If you can get competitor performance data from public sources, use it to show how process improvement will help you improve the organization’s competitive position. If not, use industry benchmarks. Reducing perceived or actual gaps with competition is the most compelling case you can develop when justifying expenditures.
• Use public sources of data to validate the numbers. Also, compare cost, productivity, and quality norms against those that are used in the organization. These are the rules of thumb your executives use to validate the numbers that come before them. If your numbers are different, you will have to explain why. Be prepared even when the organization’s numbers are either fantasy or folklore.
• Enlist the support of staff organizations (finance and accounting, legal, marketing, and so on), when they exist, to package the numbers in acceptable ways. They can help you put the right executive spin on the numbers. Although Don recommends that low-maturity organizations use cost and productivity to justify their numbers, he switches to quality measures as the primary basis for benefits for high-maturity groups. It is interesting to note that his research confirms that quality improvement yields the biggest gains when the process is institutionalized.6
6. Reifer, Donald J. Making the Software Business Case: Improvement by the Numbers. (Boston: Addison Wesley, 2002).
9.3.2 Hawthorne Effects
As you establish measures, it is probably wise not to forget that human psychology is a key ingredient in processes that involve critical thinking and creativity. You should probably consider the Hawthorne effect—a well-supported premise from group psychology that any kind of change often (but not always) results in some kind of measurable improvement, because just paying attention to people often creates motivation.7, 8 And when people know they are being studied/measured, they will often try to optimize their performance around the variable they perceive is being measured, completely unrelated to what is actually being measured.
7. Mayo, E. The Human Problems of an Industrial Civilization. Chapter 3. (New York: Macmillan, 1933).
8. Roethlisberger, F. J., and W. J. Dickson. Management and the Worker. (Cambridge, Mass.: Harvard University Press, 1939).
Here’s an example from the software world of measuring something and getting something different from what you wanted. If you measure productivity in terms of Lines of Code per hour (LOC is a typical size measure in the software industry), and people are rewarded for having higher productivity numbers (for example, more LOC per hour), you will start to see some anomalous behaviors. People may start writing code that is inefficient but verbose or adding lots of comment lines with nothing in them, so that when the code is counted, they show lots of LOC. Now if you change the measure to Source Lines of Code (comment lines don’t count), you’ll see a big reduction in the amount of commenting (not necessarily a good thing), but you’ll still see choices being made that favor verbose code versus efficient code. This might be exactly what you want if you think that the verbose code is easier to understand than the more efficient code (often, this is the case). If you really need very efficient code to meet the software’s performance goals, verbose code is not likely to be what you want. But the measure that you’re using incentivizes verbose over efficient code. If you want to get efficient code, you’ll have to change the measure for productivity.
Many organizations have moved away from lines of code as a size measure because of problems like this. A popular alternative, that focuses more on the amount of functionality delivered per time unit, is called function points. There is an international organization that sets standards for and provides support for function points as a size/complexity measure for software. Go to www.ifpug.org for more information on function points and related measures.†
† An irony is that much discussion and research has gone into how to convert function points to lines of code and back again—c’est la guerre, eh?
9.3.3 Measuring Progress Through Diffusion and Infusion Measures
One thing that should be clear from reading the section on goals and business value is that you can’t measure many of the results until you’ve actually done something differently. And for some goals (such as Return on Investment for a particular change), you may have to go through an entire project life cycle before you can see the effects of the change. If your projects are short (<6 months’ duration) or you use an incremental life cycle with short (<6 months) increments, this may be just fine. But if you’re involved in longer-term increments or projects, you probably don’t want to wait 12 or 18 months to find out whether what you’ve done is having the effect you want. So progress measures become important in this case.
Progress measures are usually a surrogate for the measures of business value that you really want from an improvement activity. There are three types of surrogate measures you will want to pay attention to: project measures, diffusion measures, and infusion measures. As in any project, you can measure things like milestones achieved and resources consumed. You can get information on those types of measures from most of the models themselves (certainly, you can within CMMI) or from project management guides (such as the Project Management Institute’s Guide to the Project Management Body of Knowledge9). We won’t go into those here. The ones you won’t find in those kinds of sources are measures for diffusion—how broadly a new practice has reached within the organization—and infusion—how deeply a new practice has penetrated into the intended audience for the practice.10, 11
9. Project Management Institute. Guide to the Project Management Body of Knowledge. (Newton Square, Penn.: Project Management Institute, 2000).
10. Zmud, R., and L. E. Apple. “Measuring Technology Incorporation/Infusion.” In Journal of Product Innovation Management 9:148–155.
11. Leonard-Barton, D. “Implementation as Mutual Adaptation of Technology and Organization.” In Research Policy 17(5):251–2.
Chapter 15 provides guidance on how diffusion and infusion measurement can be used to help you determine the adoption progress of your new practices. Both depth and breadth of adoption progress need to be measured if you hope to know when you’re ready to measure Return on Investment. Infusion measures help you establish some of the transition mechanisms needed to achieve your Level of Use goals. Diffusion measures help you establish some of the rationale behind the transition mechanisms you have chosen to achieve your infusion goals.