 Appendix H: Typical Pump Head Capacity Range Charts
by Raj P. Chhabra, Ron Dar
Chemical Engineering Fluid Mechanics, Third Edition, 3rd Edition
Appendix H: Typical Pump Head Capacity Range Charts
by Raj P. Chhabra, Ron Dar
Chemical Engineering Fluid Mechanics, Third Edition, 3rd Edition
- Cover
- Half Title
- Title Page
- Copyright Page
- Dedication
- Table of Contents
- Preface
- Acknowledgments
- Unit Conversion Factors
- Chapter 1 Basic Concepts
- Chapter 2 Dimensional Analysis and Scale-Up
- Chapter 3 Fluid Properties in Perspective
- Chapter 4 Fluid Statics
- Chapter 5 Conservation Principles
- Chapter 6 Pipe Flow
- Chapter 7 Internal Flow Applications
- Chapter 8 Pumps and Compressors
- Chapter 9 Compressible Flows
- Chapter 10 Flow Measurement
- Chapter 11 Safety Relief and Control Valves
- I. Safety Relief Valves
- II. Control Valves
- A. Valve Characteristics
- B. Overview of Control Valve Sizing
- C. The Equation Constant
- D. Valve Coefficients
- E. Cavitating and Flashing Liquids
- F. Viscous Fluids
- G. Compressible Fluids
- H. General (HDI) Method for All Fluids and All Conditions
- I. Valve-System Interaction
- J. Matching Valve Trim to the System
- Summary
- Problems
- Notation
- References
- Chapter 12 External Flows
- Chapter 13 Fluid-Solid Separations by Free Settling
- Chapter 14 Flow in Porous Media
- Chapter 15 Fluidization and Sedimentation
- Chapter 16 Two-Phase Flow
- Appendix A: Viscosities and Other Properties of Gases and Liquids
- Appendix B: Generalized Viscosity Plot
- Appendix C: Properties of Gases
- Appendix D: Pressure–Enthalpy Diagrams for Various Compounds
- Appendix E: Microscopic Conservation Equations in Rectangular, Cylindrical, and Spherical Coordinates
- Appendix F: Standard Steel Pipe Dimensions and Capacities
- Appendix G: Flow of Water/Air through Schedule 40 Pipe
- Appendix H: Typical Pump Head Capacity Range Charts
- Appendix I: Fanno Line Tables for Adiabatic Flow of Air in a Constant Area Duct
- Index
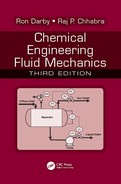
Appendix H: Typical Pump Head Capacity Range Charts
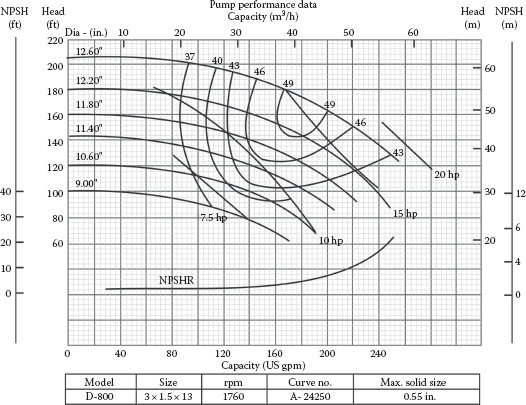
FIGURE H.1 Typical pump characteristic curves.

FIGURE H.2 Typical pump characteristic curves.

FIGURE H.3 Typical pump characteristic curves.

FIGURE H.4 Typical pump characteristic curves.

FIGURE H.5 Typical pump characteristic curves.

FIGURE H.6 Typical pump characteristic curves.

FIGURE H.7 Typical pump characteristic curves.

FIGURE H.8 Typical pump characteristic curves.

FIGURE H.9 Typical pump characteristic curves.

FIGURE H.10 Typical pump characteristic curves.

FIGURE H.11 Typical pump characteristic curves.

FIGURE H.12 Typical pump characteristic curves.

FIGURE H.13 Typical pump characteristic curves.
FIGURE H.14 Typical pump characteristic curves.

FIGURE H.15 Typical pump characteristic curves.

FIGURE H.16 Typical pump characteristic curves.

FIGURE H.17 Typical pump characteristic curves.

FIGURE H.18 Typical pump characteristic curves.

FIGURE H.19 Typical pump characteristic curves.

FIGURE H.20 Typical pump characteristic curves.
-
No Comment