
Chapter 4: Testing Your Core Networking Knowledge
In This Chapter
![]() Examining the OSI network model
Examining the OSI network model
![]() Troubleshooting the OSI layers
Troubleshooting the OSI layers
![]() Checking out the Ethernet packet frame structure
Checking out the Ethernet packet frame structure
![]() Sharing network media with low- and high-level addressing
Sharing network media with low- and high-level addressing
![]() Getting a handle on CSMA/CD and CSMA/CA
Getting a handle on CSMA/CD and CSMA/CA
![]() Analyzing network data with Wireshark
Analyzing network data with Wireshark
In Chapter 1 of this minibook, you review some of the major components that make up a network, such as switches and routers. In this chapter, you get a little deeper into each of these components. You run up and down through the Open System Interconnection (OSI) model, pausing to examine components that exist at many of the layers. You are also introduced in more depth to the major networking protocols that are used on data networks, such as Transmission Control Protocol/Internet Protocol (TCP/IP). I go into detail right down to seeing how the signaling for the physical network works.
![]() Whatever physical media you deal with, from the networking perspective, there are only two states: on and off, or 1 and 0.
Whatever physical media you deal with, from the networking perspective, there are only two states: on and off, or 1 and 0.
Before you begin this chapter, you need to know your goals. By the end of this chapter you
• Have some comfort with the OSI model, such as why it was created and how it is used in networking today
• Have a basic understanding of network frames, which are the containers that hold data on the physical network, and the Internet Protocol (IP) packets that are contained in the frames
• Know the basic structure of a Media Access Control (MAC) address and how it is used to communicate on the network
• Have some knowledge of some of the dominate protocols that have been used for networking
• Can distinguish collision-detection mechanisms from collision-avoidance mechanisms
• Have a rough working knowledge of the packet capture program Wireshark, which captures and analyzes network traffic
Layering the OSI Model
Working with the OSI networking model or other networking models aids in the understanding of how your network works and how components are separated but able to communicate with each other. This section focuses on the OSI model in detail and how to use this information to troubleshoot networking problems. For example, when you are informed that a computer cannot communicate with a server, very often the problem is described as “the network is down.” (I personally love hearing this when discussing the Internet, because if the Internet was truly down, I am sure I would have heard about it on the radio. Rather, the connection to the network may be down.) With your knowledge of the OSI model, you can start your troubleshooting, working through the layers, until you locate the cause of the problem; validating that each layer is working as you move through the layers.
In Chapter 1, I introduce you to the OSI model by the International Organization for Standardization (ISO), but in this chapter you will dig a little deeper, but not so deep that I put you to sleep. Although the ISO has come up with the network model, most of the specifications for how devices actually communicate (such as Ethernet — 10 Mbps, Fast Ethernet — 100 Mbps, Gigabit Ethernet — 1Gbps, or any of the 802.11 wireless specifications) have been created, defined, or managed by another organization, the Institute of Electrical and Electronics Engineers (IEEE). The OSI model is a seven-layer model that includes the following layers:
• Presentation
• Session
• Transport
• Network
• Data link
• Physical
![]() You may find it helpful to remember the order of these layers from top to bottom with this mnemonic device, All People Seem To Need Data Processing. If you prefer the bottom-to-top approach, try Please Do Not Throw Sausage Pizza Away.
You may find it helpful to remember the order of these layers from top to bottom with this mnemonic device, All People Seem To Need Data Processing. If you prefer the bottom-to-top approach, try Please Do Not Throw Sausage Pizza Away.
Regardless of how you approach the OSI model, you need to remember what each layer is responsible for. You also need to remember that the model represents a logical ideal of networking and not a real world requirement. The following sections review this model from the bottom to the top. I prefer this manner of reviewing the layers because if I am troubleshooting a network problem, I typically start with the physical layer (is the computer even plugged in?) and work up through the layers until the problem has been resolved. When troubleshooting from the application layer down, you will likely get a bunch of layers not working until you find the problem.
Layer 1: The physical layer
The physical layer represents the physical media, such as Category 5e cables and the Ethernet frame type (which you will see in the “Framing Data” section, later in this chapter) that is used to move the binary data across the network. Because the data is binary, it is composed of two states that represent zeros and ones: Zero is electrically off, and one is electrically on. With the OSI model, the application layer is not concerned with the physical media of the network; think of it this way, people are not typically concerned with the underlying technology used by their cellphone carriers, such as analog, digital, 1x, Edge, 3G, or 4G, as long as they can make calls. (If you are a geek, you probably want 4G or are already on it.)
So in the cellphone example, you could think of the call dialing and processing features of the cellphone as the application layer, the cellphone’s Electronic Serial Number (ESN) or its Subscriber Identity Module (SIM) as being on the datalink layer (you see that in the next section), and the service type (3G or 4G) as the physical layer. The datalink layer cares about the underlying physical service type (a SIM-based phone does not work with ESN-based networks); while at the application layer, it only cares that information it sends down the network layers crosses the network and is able to communicate with the call processing application components at the cellphone carriers’ offices.
The physical networking layer could use any or all the variants (a/b/g/n) of 802.11 wireless technologies, fiber, twisted pairs of copper wire (Cat4, Cat5, Cat6), cable (also copper wire, but different), satellite, or microwave. Again, typically the user of the device does not care what the technology is as long as it moves the data bits at a rate that is sufficient for their needs; for many users, this does not need to be very fast.
Layer 2: The data link layer
The data link layer is adjacent to the physical layer, so they are associated pretty closely together. Whereas the physical layer deals with the actual physical media (the cables and so forth that the data move over), the data link layer deals with signaling or the method used to send data across that media. Part of sending signals across the network’s media is coming up with a way to identify the sending and receiving devices. To solve this issue, networks use numeric identifiers such as a MAC address associated with a network interface card (NIC). Every network card manufactured in the world has a globally unique MAC address associated with the card. To make identifying the MAC address easier for the end user, it is usually printed on the outside of the product box, written on the card as shown in Figure 4-1 (where 3Com decided to identify it as the EA number), or on the outside of the computer that it is installed in (if you have a laptop, turn it over and there is a good chance that you will see the MAC address).
Figure 4-1: An NIC with its identifying hardware address.
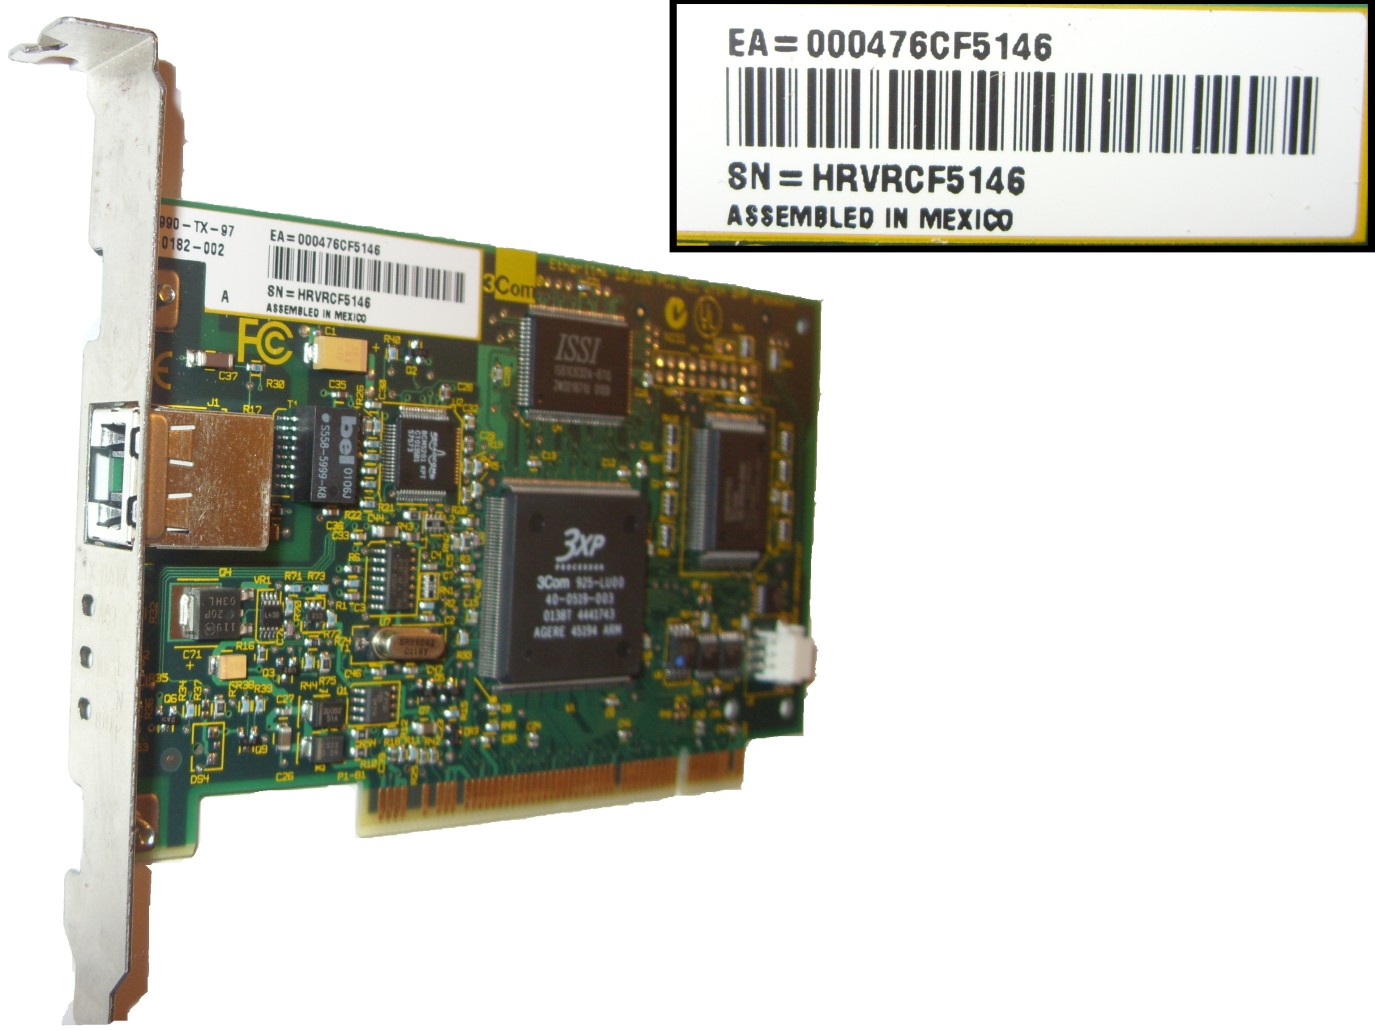
![]() When looking for your MAC address, it will always be a 12-digit hexadecimal number, which was clearly identifiable from the serial number (SN) which includes non-hexadecimal characters.
When looking for your MAC address, it will always be a 12-digit hexadecimal number, which was clearly identifiable from the serial number (SN) which includes non-hexadecimal characters.
The type of addressing or options that would be used at this layer depends to a degree on what physical layer is being used, so data link addresses for serial connections are different than Ethernet connections. Although in all cases, this includes some type of addressing that is compatible with the physical layer so that devices connected to that layer can identify themselves and other devices connected to the media. This is important, because when a computer sends data to a network file server, you would like that data to get to the server. The key thing to remember about the data link layer is that it contains those devices that communicate with the physical layer and a method of identifying physical parts of the network.
Layer 3: The network layer
The network layer routes the data from one location to another, or across several defined networks. A network is a series of devices that are connected to a single physical medium, or broadcast domain (discussed in Book III, Chapter 2). Some people might challenge this notion and say that a network is a collision domain, but I discuss the fine differences between these in Book II. For now, just know that if a network represents interconnected devices moving signals between one another, the network layer moves data between these networks of interconnected devices, dubbed an internetwork. This can be done on a small scale (separating data on a network of a dozen computers) or on a large scale (separating data for an international corporation across the globe).
![]() The global Internet represents doing this on a very large scale, and its name is a contraction of the word internetwork.
The global Internet represents doing this on a very large scale, and its name is a contraction of the word internetwork.
Because data needs to move between networks, there must be an underlying protocol to support network identification and a manner of identifying paths between networks, which can be done manually or automatically using a compatible protocol.
![]() A protocol is a set of standards or rules that all participants must adhere to. When dignitaries from different countries meet, they follow mutually agreed upon protocols for dealing with each other. In the case of the network, the participants are the networking devices (such as computers, routers, and switches), while the protocols are the rules which have been agreed upon to communicate with each other. Most of the hardware level protocols (like Ethernet standards) are managed by IEEE, while the Internet Engineering Task Force (IETF) manages the TCP/IP suite of protocols.
A protocol is a set of standards or rules that all participants must adhere to. When dignitaries from different countries meet, they follow mutually agreed upon protocols for dealing with each other. In the case of the network, the participants are the networking devices (such as computers, routers, and switches), while the protocols are the rules which have been agreed upon to communicate with each other. Most of the hardware level protocols (like Ethernet standards) are managed by IEEE, while the Internet Engineering Task Force (IETF) manages the TCP/IP suite of protocols.
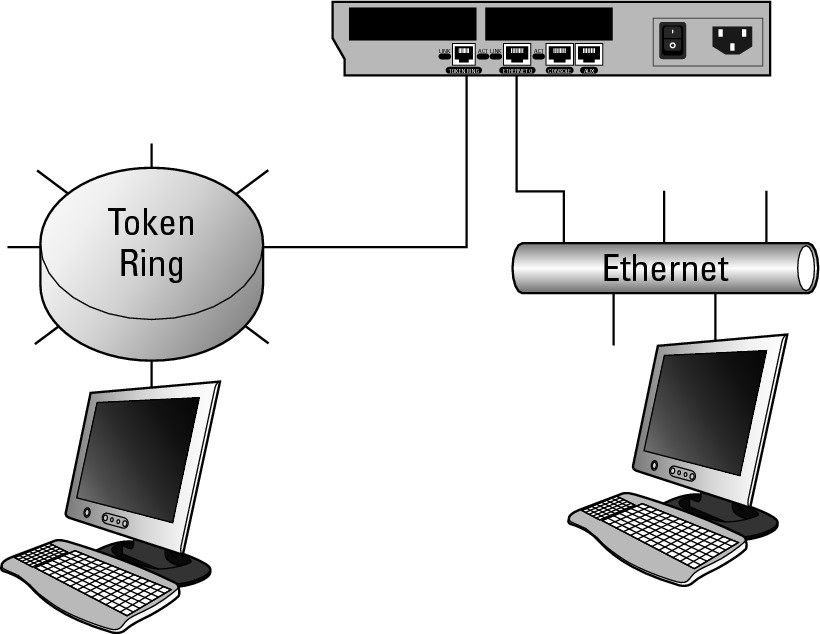
The network layer does not care much about the type of data it is moving, the path it takes, or the different media that it moves over. Typically, you are allowed to change physical media types at this layer. To connect different network types, you need an interconnection device that supports data links for different network types. Such a device includes different media connections on either side and, like the router in Figure 4-2, can connect gigabit Ethernet on one side of the device to something foreign, such as Token Ring, on the other side.
Just as the data link layer has addresses that it uses to identify other devices with which your computer communicates, these are hard to understand addresses and they are only valid for the current network segments (the area between two routers). This area between routers is also referred to as a data link because it is the only place where the local devices can communicate with each other, using MAC addresses (or data link layer addresses). The network layer of the OSI model also uses addresses, but these are network layer addresses and their specific format is based on the network layer protocol being used. Internet Protocol (IP) represents a common network layer protocol.
Figure 4-2: The network layer allows for the inter-connection of different data links.
At the network layer, IP uses IP addresses to determine which two devices are communicating. The relationship between the network layer and the data link layer is that all communication over a data link will always be performed using data link (MAC) addresses, so as the network layer sends data down to the data link layer, it must also tell the data link layer what the destination MAC address is for this data. To accomplish this, IP makes use of the Address Resolution Protocol (ARP) to resolve the required MAC addresses for the IP address targets with which it wants to communicate. (You can find out more about ARP in Book II, Chapter 3.)
Layer 4: The transport layer
The transport layer is closely related to the network layer, but adds functionality to it. You can think of this layer as a traffic cop or a supervisor for the mindless mob of packets that is the network layer. As discussed in Chapter 1 of this minibook, the transport layer takes responsibility for verifying data delivery. The network layer may have a high success rate in getting data to the destination, but the transport layer is specifically told to ensure delivery of data. Either way, you are going to use transport layer delivery mechanisms, but you (or the application you are using) will need to make a decision as to whether you will be using verified data delivery or unverified data delivery. In both cases, you are still using a transport layer component or protocol.
The actual mechanisms that are used to guarantee data delivery are dependent on the networking protocol that is in use, whereas the concept of delivery reliability is more universal. When working with the TCP/IP protocol suite, verified delivery is performed using the Transmission Control Protocol (TCP), while unverified delivery is performed using User Datagram Protocol (UDP).
For example, compare a text message to a phone conversation. Even though a large number of text messages get through, there is no guarantee that any given message to a person has been received (something my wife occasionally needs to be reminded of), whereas an answered phone call and the ensuing interchange with the other person gives you the immediate feedback that the words are received by the recipient. (I will not say that the message got through, because that conveys the idea that the message was actually understood.) Similarly, voicemail is equally as useless as a text message in terms of feedback.
Now you may wonder why you would want to use unverified delivery. Well, in the case of person-to-person interaction, my wife often prefers text messages to voice calls, because she can get her message to someone without getting into a lengthy conversation, which involves exchanging pleasantries. She will know if the message got through when she receives a reply, or if that reply does not occur within a reasonable time frame, she can resend her message. The same is true of network communications, where the cost of verified delivery is additional overhead in establishing a delivery channel, verifying the data is received after you have sent the message, and closing down the delivery channel. If the data you plan to send is small or not very important, then this overhead can be tedious and slow the communication process down; but if you eliminate the overhead, you also eliminate the verification. This is not a problem that is of concern to the transport layer, the request to send that data came from the session layer.
If the session layer has marked the data as no verification required, then the session layer is responsible for performing its own check or verification of delivery. Based on the data, the session layer may choose not to worry about delivery or the session layer may have its own rules of delivery verification, such as it expects a response from the destination computer within five seconds, after which the session layer will resend the data.
Layer 5: The session layer
The session layer defines how the data is formatted between the devices on either side of the link. This is effectively the manner in which they maintain an open channel between the two devices. However, at lower levels of the OSI model, there is no permanent connection but rather a series of short bursts of data being sent back and forth. The session layer maintains a conversation over many of these bursts of data; in fact, it can take several bursts of data going back and forth just to establish the structure that will be followed for that session.
A real-world example of the session layer might be a pair of spies exchanging messages. They would have to establish an order of operations (a standard process that would be followed every time communications are established) that would be used to pass encoded messages back and forth. This process for passing the messages could be considered a session layer operation and may include steps such as using an agreed upon cipher to encode the message, placing a message in a predetermined location, and placing a marker someplace else to indicate that there is a message waiting. In the computing world, Windows file sharing has a session layer component when establishing sessions, as shown in Figure 4-3. The goal of the client computer in the Figure 4-3 is to get a list of shares on the server, but it must follow a session setup process in order to get the data that the client computer is after. The server in this process is in a constant state of listening for connection requests; as the client starts the process off, the session setup process runs like this:
1. The client sends a session request to the server.
2. The server acknowledges the request and includes in the acknowledgement a list of all session protocol that it is willing to support.
In the case of the Windows server, the list includes older, less secure options such as LANMAN, as well as the newer and more secure NT LANMAN version 2 (NT LM 2).
3. The client reviews the list of supported protocols and chooses the most secure session protocol that it also supports.
At this point, it sends the server the chosen session protocol that they will be using and requests to conduct an authentication. In this case, the authentication will verify a username and password from the server’s user account database.
Figure 4-3: Windows file-sharing session set up.
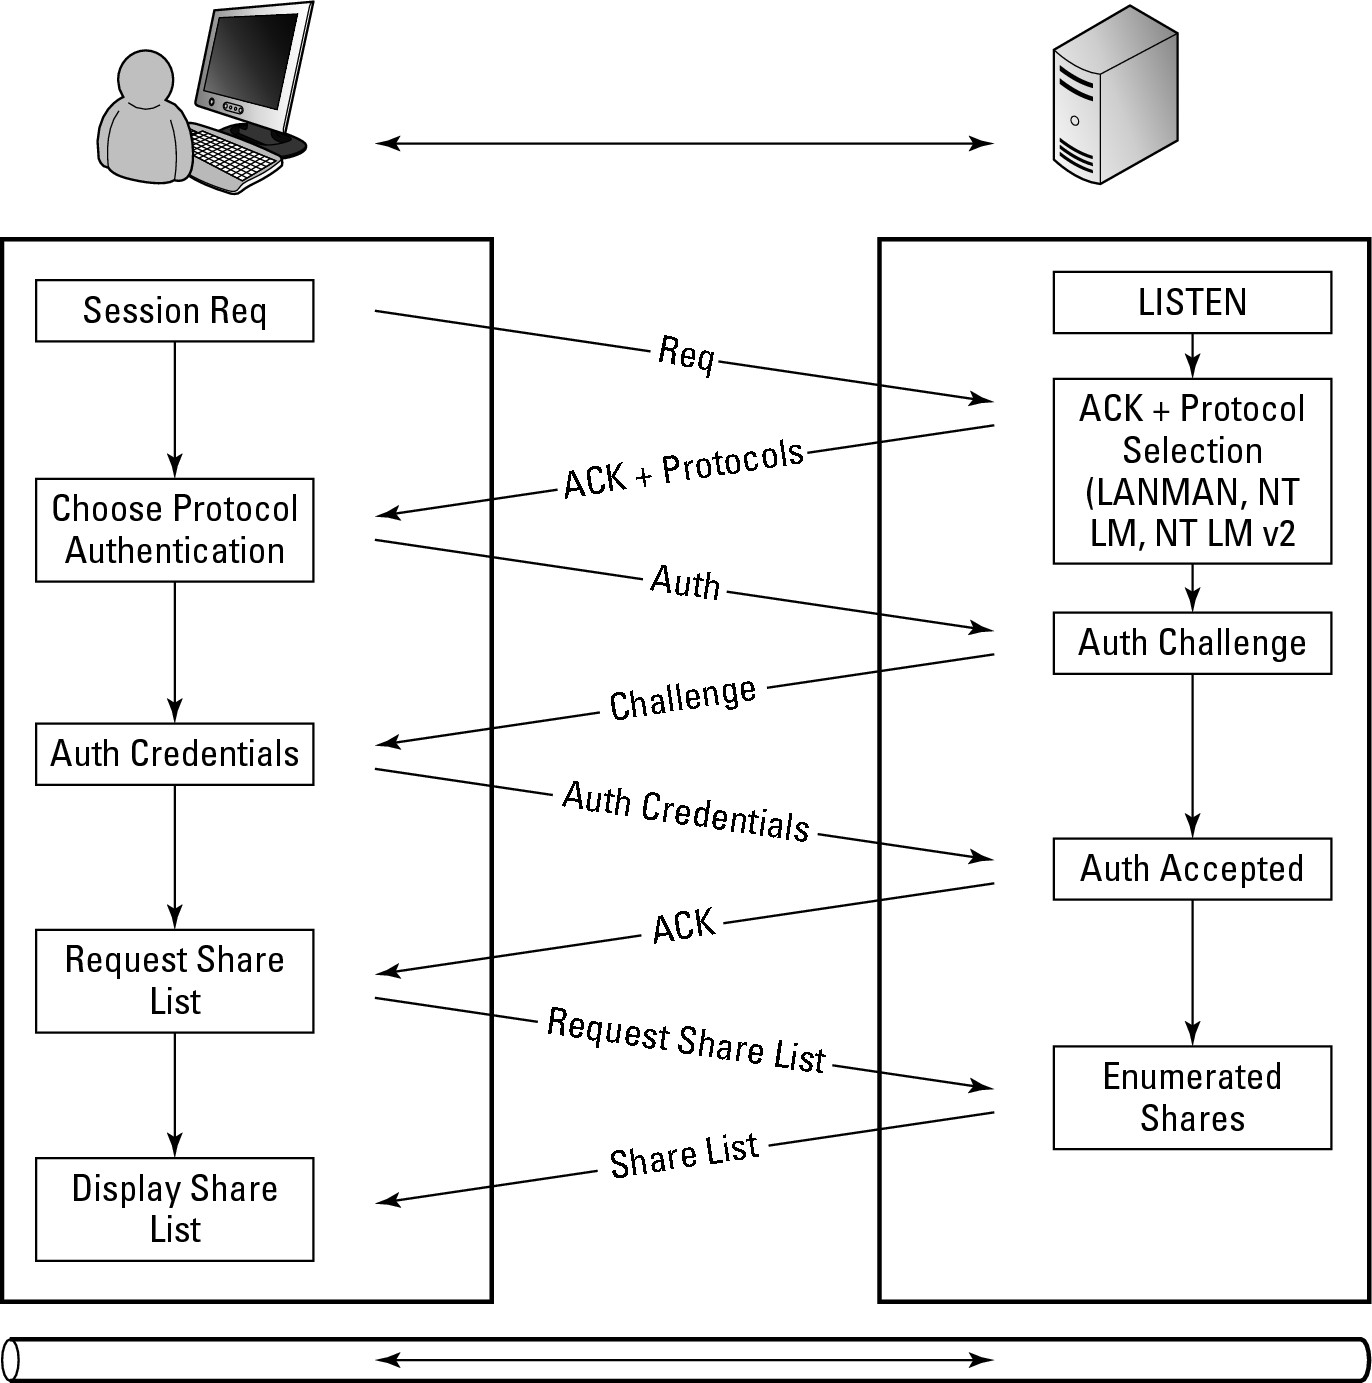
4. The server creates a random string of characters that is included in the password challenge. This challenge is sent to the client.
5. The client takes the string from the password challenge and uses its own password as an encryption key to encrypt the random string.
6. The now encrypted string is then sent back to the server in an authentication credentials package that also includes the user’s username.
7. The server retrieves the user’s password from its user account database, and uses the password as the encryption key to encrypt the random character string that it sent to the client in the challenge step (Step 4).
8. The server compares the result it calculated to the result listed in the authentication credential package.
9. If the results match, as they do in Figure 4-3, then an acknowledgement (ACK) is sent to the client and the session is now active; but if they do not match, then the server sends a negative acknowledgement (NACK).
If the client receives a NACK, then it would go back to Step 3 and issue a new authentication request.
10. At this point the session is set up, and the client can perform the request for the list of shares that are on the server, which would likely lead into a request of a list of files, and then the contents of a specific file.
All of these future operations would be conducted though this single session that has just been created.
Step 10 in the preceding list shows the change from the session layer and the presentation layer. At the session layer, the communication channel to the Windows server components was established, but as the actual request was submitted for the list of shares available on the server, the request used the session layer communication channel, but was actually delivered through to the presentation layer and ultimately the application layer Windows Server service.
Layer 6: The presentation layer
Although the session layer opened an ongoing communication session, the presentation layer is responsible for how that data looks or is formatted. Consider the preceding spy example in which spies exchange encoded messages. The manner of passing the messages back and forth is defined by the session layer, but how the messages are encoded (or the cipher the spies used to obscure the message) is the responsibility of the presentation layer. Naturally, this has to be negotiated between the participants because it would be useless for one spy to encode a message that the other spy did not know how to decode. So with the presentation layer, all participants need to agree with the methods of encoding that are used at this layer. The same is true in the computer world — all participants, such as the servers and clients, need to agree with how the data will be formatted in order to exchange it. This is why standards for items like the HTML and XML languages allow servers to present data to clients and the clients to display this data to the users.
![]() Differences among browsers make the actual display of the data slightly different on each browser, partially due to how they honor or interpret the data formatting presented by the web page. This formatting variance is why so many people have multiple web browsers installed on their computers. I personally alternate between Microsoft Internet Explorer, Mozilla Firefox, and Google Chrome with a fair amount of regularity; in fact, it is typical for me to have all three open at the same time. (Do not get me started on the mobile browsers for my iPod Touch or BlackBerry.)
Differences among browsers make the actual display of the data slightly different on each browser, partially due to how they honor or interpret the data formatting presented by the web page. This formatting variance is why so many people have multiple web browsers installed on their computers. I personally alternate between Microsoft Internet Explorer, Mozilla Firefox, and Google Chrome with a fair amount of regularity; in fact, it is typical for me to have all three open at the same time. (Do not get me started on the mobile browsers for my iPod Touch or BlackBerry.)
Encryption is one of the key translations that takes place at the presentation layer. On outbound traffic from the server, the presentation layer encrypts data that is sent, and on the other end of the connection, it decrypts the data that is sent to the application layer. Figure 4-4 illustrates the flow of the data between a network client and the server. If the client computer is running an e-mail program and the server is the user’s e-mail server, then on either end of the connection (both the client and the server sides), they are likely using the Simple Mail Transfer Protocol (SMTP) application layer protocol, or rather the encrypted version, SMTPS. The data flow would be as follows:
Figure 4-4: Encryption routines are part of the presentation layer.
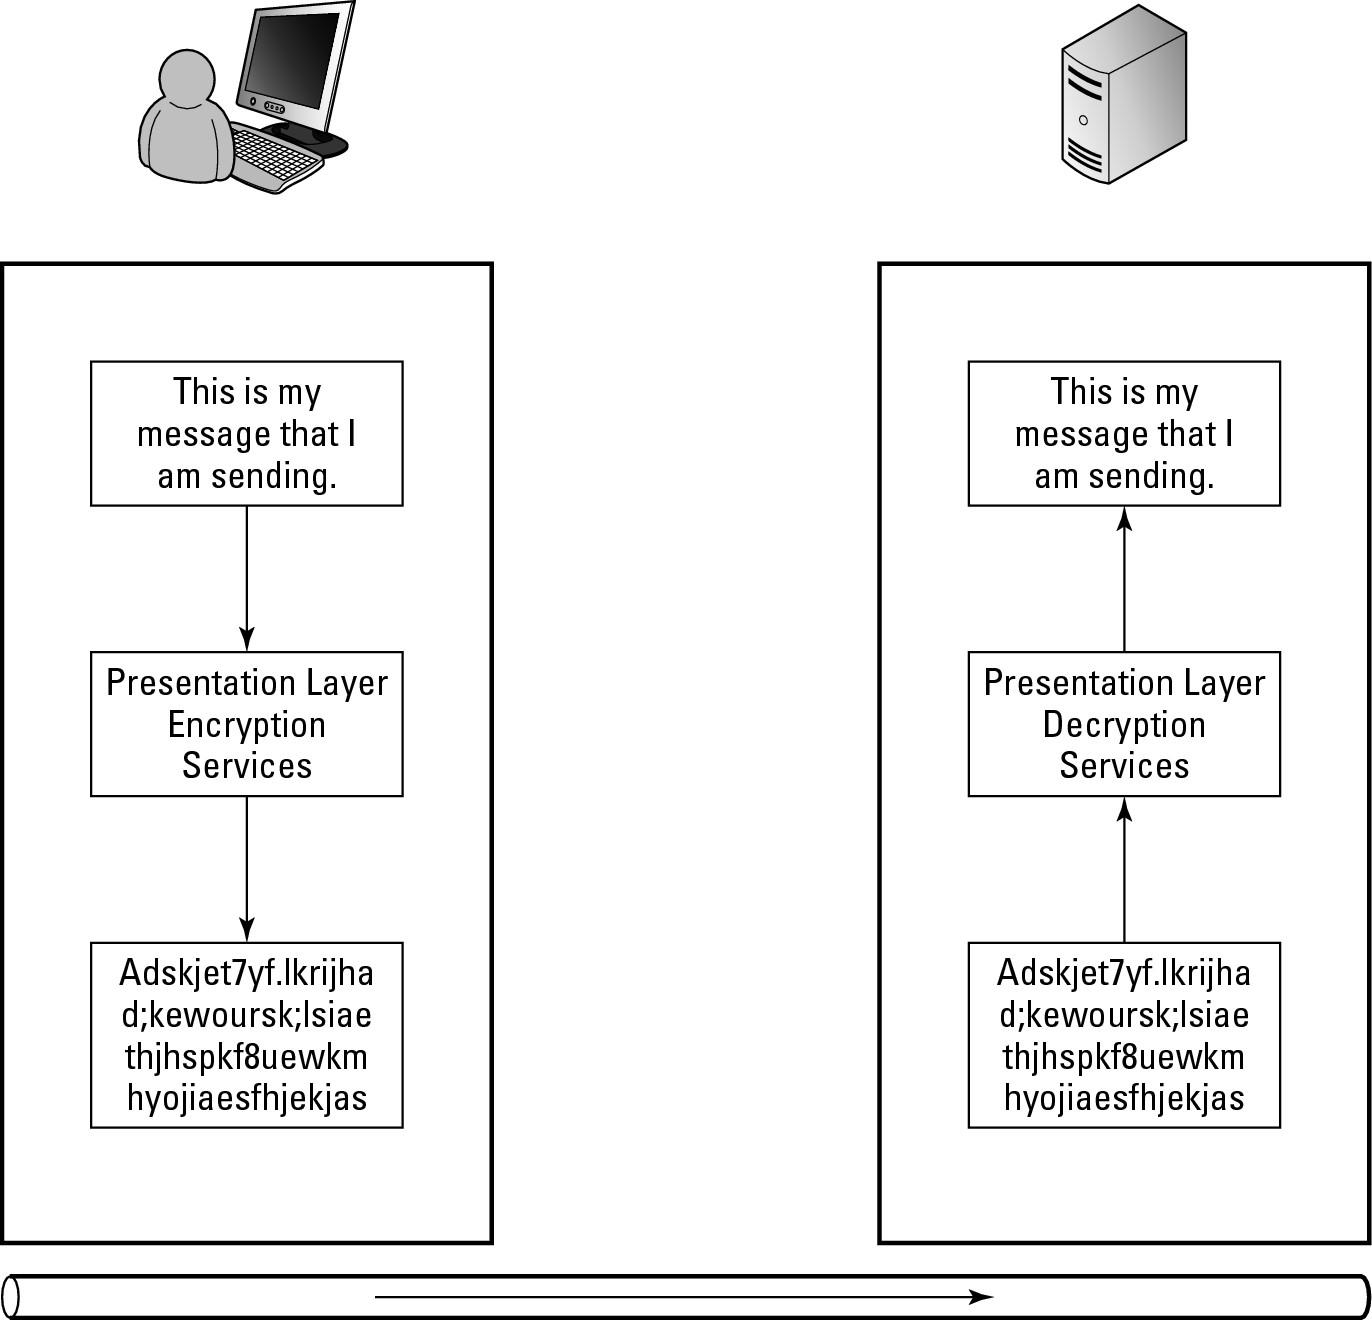
1. Using SMTPS, the client side of the application passes the text to the presentation layer services and requests encryption.
2. A Transport Layer Security (TLS) component at the presentation layer receives the unencrypted message and proceeds to encrypt the message using standard TLS processes.
3. The encrypted message flows down through the remaining OSI layers, over the physical network to the server.
4. At the server, the message is sent up through all of the layers until it arrives at the presentation layer.
Now, the servers TLS processes will take over and decrypt the message so that it is clearly readable.
5. The clear text message is then delivered to the SMTP application layer protocol for processing.
In this case, the next step would be to deliver the message to the recipient’s mailbox.
Layer 7: The application layer
The application layer is the highest level in the OSI model and is the level that is closest to you — or furthest away from you if you are at the other end of the connection. The application layer effectively moves data between your computer and the server, and it is comprised of the server application that reads and writes files, such as the Apache Web Server or Microsoft’s Internet Information Services (IIS), as well as the application you use at the client computer to write or read that data (such as an e-mail program).
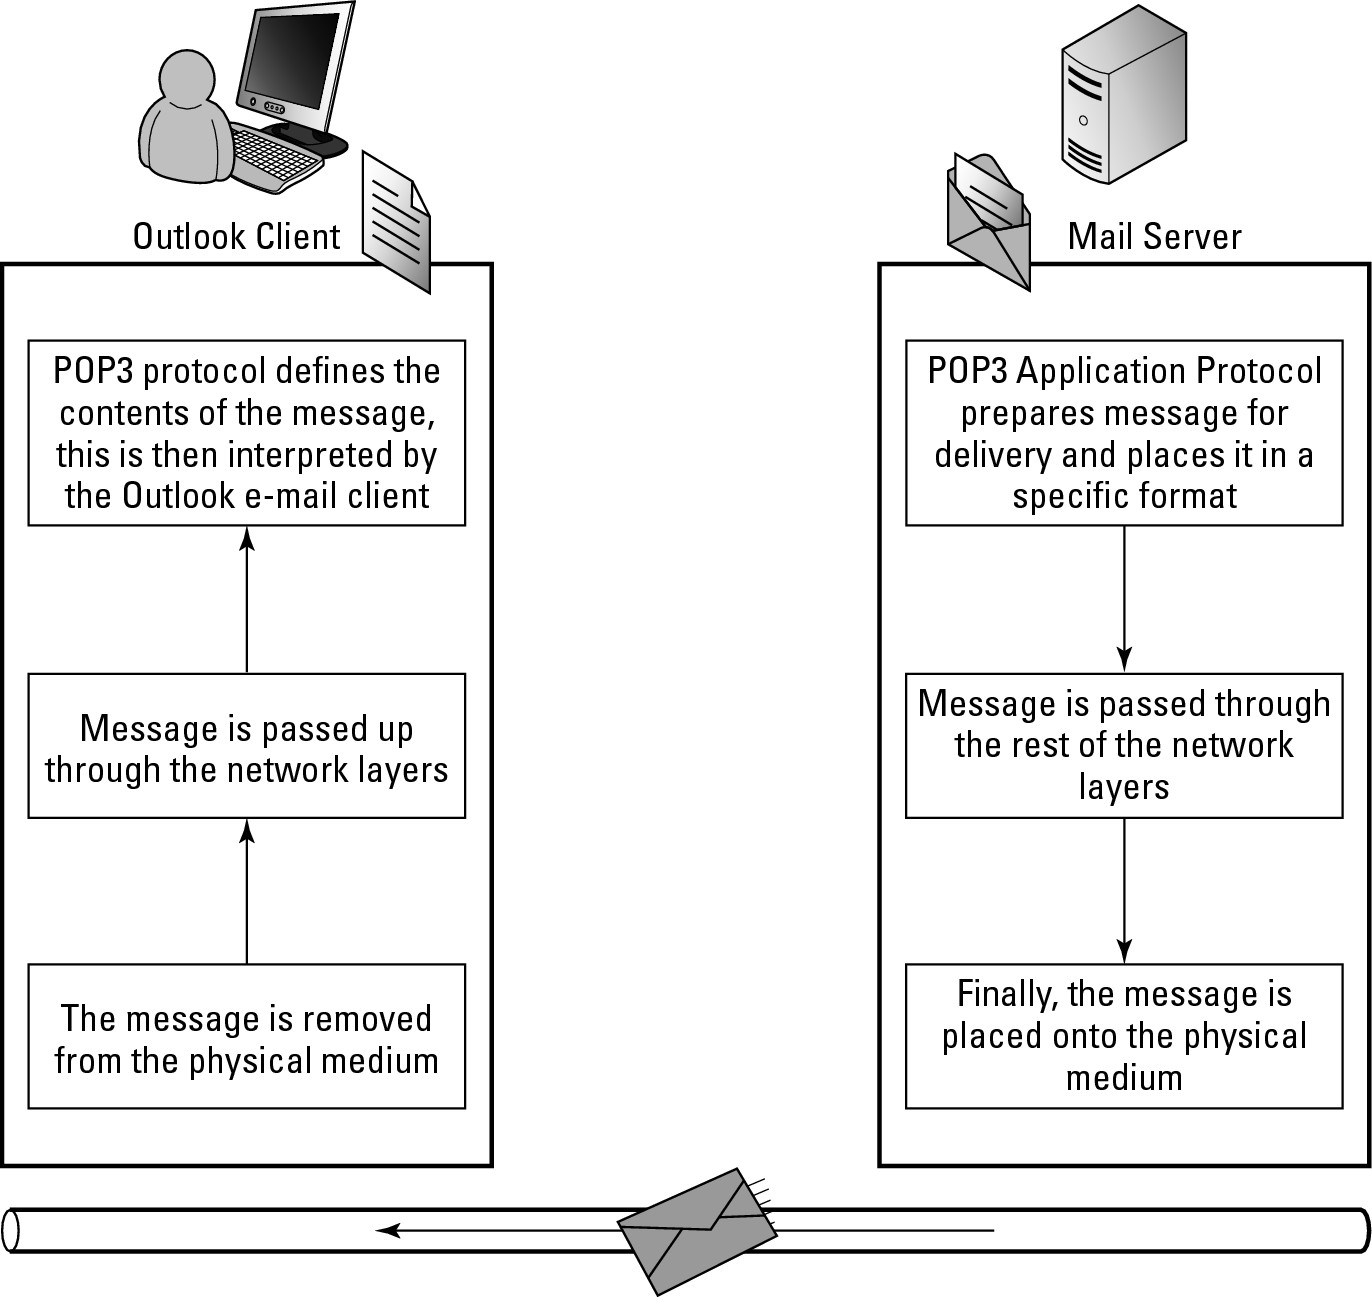
Following the flow of data in Figure 4-5, the communication process between the application layer on a client computer and server is illustrated.
1. The process starts at the application layer with someone retrieving and opening an e-mail in an e-mail program, such as Microsoft Outlook.
Outlook is the client program which operates the OSI model’s application layer. Outlook communicates with application layer processes or programs being used on a server. In this example, when you start Outlook, it starts the process to request all e-mail from that server for the user.
![]() Any program may perform functions for other layers, such as the presentation layer by formatting the data in ASCII, Unicode, or Multipurpose Internet Mail Extensions (MIME), which is where things get muddy in comparing reality to ideals.
Any program may perform functions for other layers, such as the presentation layer by formatting the data in ASCII, Unicode, or Multipurpose Internet Mail Extensions (MIME), which is where things get muddy in comparing reality to ideals.
2. The server’s Post Office Protocol version 3 (POP3) service responds to the request for the user’s e-mail.
The POP3 service runs at the application layer, and will retrieve the e-mail from the hard drive and prepares the e-mail message to be sent to the user’s computer.
3. The data passes through the presentation, session, transport, network, data link, and physical layers, across the physical media, and backs up through all those layers on the client side of the connection.
4. The data arrives at the application layer on the destination computer, and is then displayed using a program such as Outlook.
Figure 4-5: An e-mail client and SMTP/POP3 server are application layer components.
For most of the components on the Internet you deal with, you likely already refer to the application-level components:
• Hypertext Transfer Protocol (HTTP): Protocol for transferring data from web servers to web browser applications like Microsoft Internet Explorer.
• Simple Mail Transfer Protocol (SMTP): Protocol for sending mail from one computer to another. This could be from an e-mail client, like Microsoft Outlook, to an e-mail server, or from one e-mail server to another.
• Post Office Protocol version 3 (POP3): Protocol for e-mail client application, like Microsoft Outlook, to retrieve e-mail from an e-mail server.
• Network Time Protocol (NTP): Standard protocol for synchronizing time between computers and devices over the Internet.
• Secure Shell (SSH): Remote terminal access protocol that encrypts all data sent over the network.
• File Transfer Protocol (FTP): Transfers files to and from servers over the Internet.
Troubleshooting by Layers
When troubleshooting, unless you have seen the particular item or very similar symptoms, you may not have a particular spot to start looking for a solution. This is where the layered approach to troubleshooting comes in. You could start at one end of the layered model and work your way through to the other end, or you can use the symptom to determine where the best place to start is. What type of issue are you having? What are some primary items to check? The fact is that when you lack any other description for the user (other than “It is broken!”), you can usually start at the first layer and work your way up.
Troubleshooting the physical layer
Do not overlook the physical layer when you troubleshoot. Yes, troubleshooting the physical layer is not as sexy as say, troubleshooting on a Cisco Adaptive Security Appliance (ASA), but it is just as useful. For a user having connectivity issues, look around her system. If the problems are wireless, look for sources of interference that may be nearby. If the user is wired, look at the network cable.
![]() Networking devices are often put in substandard locations because they do not usually beep if they get hot. I have seen switches well above their rated operating temperature, jammed into the tops of closets during a hot summer. In another type of hardware abuse, a user had his data cable looped around his desk with the cable acting as a speed bump for his chair. I was surprised that the cable was even in one piece, much less still passing data.
Networking devices are often put in substandard locations because they do not usually beep if they get hot. I have seen switches well above their rated operating temperature, jammed into the tops of closets during a hot summer. In another type of hardware abuse, a user had his data cable looped around his desk with the cable acting as a speed bump for his chair. I was surprised that the cable was even in one piece, much less still passing data.
![]() Rather than spending hours looking for the problem where it does not exist, check the physical items close to the network devices and between locations. I once had a coil of thin coaxial cable in a ceiling that was cut out and stolen, which left my network users without connectivity. This physical problem would not have been found without tracing the physical connection from end to end.
Rather than spending hours looking for the problem where it does not exist, check the physical items close to the network devices and between locations. I once had a coil of thin coaxial cable in a ceiling that was cut out and stolen, which left my network users without connectivity. This physical problem would not have been found without tracing the physical connection from end to end.
Troubleshooting the data link layer
In the OSI model, the data link layer is just above the physical layer. At this layer, check the following items:
• Link status: Most operating systems provide some sort of tools to check on the link status. Microsoft Windows always seems to tell you when you have connected or disconnected a network card. Make sure the network card is enabled in the operating system, if it is, then move on to the next steps.
• Check the status lights: Most network cards have one or two lights. These lights will identify link status and speed, as well as activity over the link. What information is displayed is based on the manufacturer settings, so you may need to check your documentation if they are not labeled. If you look at the switch your computer is connected to, you will also see status lights. These lights will show you link status, speed, duplex settings, and activity. (Switch lights and settings are covered in Book III, Chapter 2.) If you only have lights on one side of the connection, then you likely have a physical issue, like a break in some of the wires inside of the cable. If you have connection lights that agree at either end of the connection, such as both reporting gigabit connection speed, then you are partway to verifying data link connectivity. If there are no status lights, then check your physical connections again.
• Attempt using Address Resolution Protocol (ARP): Test to see if other computers on the network are visible at all. ARP is a command line tool that will display the MAC addresses of all devices with which you have recently communicated. This means that you can attempt to communicate with another device, and then check your ARP cache. (This is all explained in Book II, Chapter 3.) If you can see other computers, then your connection at the data link layer is likely working correctly.
Troubleshooting network and transport layers
Moving up in the OSI model, you arrive at the network and transport layers, and the issues you could deal with really open up. A myriad of problems can occur at these layers:
• Check your protocol address: If you use an incorrect protocol address for your network, you cannot communicate with any devices on your network. As a networking consultant, I regularly configure my laptop for a static IP address on my client networks when they may not have a Dynamic Host Configuration Protocol (DHCP) server running on that portion of their network, or when I need to configure a new network device. This often has me returning to my network with an improper IP address for my network, so I end up troubleshooting and saying, “D’oh, of course!”
• Attempt to communicate with your router: If you use a routable protocol, such as IP, then you should attempt to communicate with your router, or a device on the other side of your router (such as a server on the Internet). Ping (which you see in Book II, Chapter 3) is a great tool for testing this connectivity. It will give you instant feedback if you can communicate with the other device.
• Attempt to communicate with other devices on your network segment or data link: Your router from the previous item is a device on your data link that should always be up and running. If you could not communicate with the router, try another device, such as another computer, because it could be that your router is not working properly.
Most of the issues that occur at these layers are typically resolved with the configuration of the network protocol on your device or another device on the network.
![]() If you use IP as your network protocol, something as simple as entering the incorrect subnet mask on a device can cause you to not be able to communicate with a large number of other network devices, either on your data link or on the other side of a router.
If you use IP as your network protocol, something as simple as entering the incorrect subnet mask on a device can cause you to not be able to communicate with a large number of other network devices, either on your data link or on the other side of a router.
Other issues that occur at these layers revolve around name resolution. For example, you may be able to get to the destination server by IP, but if the name you are resolving is wrong, you cannot connect. Alternatively, you could be resolving the correct name but are getting the wrong address in your resolution.
Troubleshooting the application layer
You can have an issue at the application layer, but most issues you encounter happen at the other layers. However, some issues in the application layer or in other layers (depending on how you look at them) include items such as the following:
• Software bugs, such as an application that crashes when sending data too quickly. When things like this happen, all you can do is diagnose the issue, contact the software manufacturer, reduce the occurrence of the issues by adjusting other configuration elements, or change to an equivalent application if one is available.
• Incorrect settings, such as host names or addresses, that may have changed and have not been documented. Find out what the correct settings should be, even if it means double-checking client and server configurations. I regularly have clients who refer to ancient documents when I ask them for current network information.
• Services are bound to an incorrect port, such as one running Remote Desktop Protocol (RDP) services or HTTP services on non-standard ports. You may be able to get to the remote host, for example, but if you try to talk to the wrong port, you cannot connect. It is not uncommon for internal use servers to have multiple websites installed on them, with only one of them being allowed to run on the standard HTTP port of 80. Also, some IT administrators choose to run the RDP service on a non-standard port to keep unauthorized users from attempting to connect to the RDP service.
• The client or server components that you use do not follow the published standards for the protocol. I have had issues working with some client and server components, such as an FTP client and FTP server. After hours of troubleshooting connectivity issues, it turns out that the custom written FTP client did not honor all of the session control commands that were being issued by the FTP server. If it had, the issues would not have existed. This problem was only identified by reading published standards and capturing network traffic with the Wireshark network capture tool. (For more about Wireshark, see the “Sharking the Network Data” section, later in this chapter.)
![]() Some companies that implement devices have taken liberties with implementing protocols and the features they support. This makes achieving compatibility with other devices from other vendors difficult and can be considered an application problem that is often resolved only after you change the client or server software that you use.
Some companies that implement devices have taken liberties with implementing protocols and the features they support. This makes achieving compatibility with other devices from other vendors difficult and can be considered an application problem that is often resolved only after you change the client or server software that you use.
Framing Data
If you followed along so far, you know how all the layers work together. Here I focus on the lowest layers again: the physical and data link layers. Data travels over the physical media of the Ethernet network in small containers, or frames. There are different methods of framing Ethernet data, but the two that you are likely to see are Ethernet II and IEEE 802.3. The structure of these frames is similar, and the following explains each:
• Ethernet II: Is a revision of the original Ethernet frame format. It is the standard framing type and is used to support required headers used by IP. I focus on this frame in this chapter because you are more likely to see it than any other frame type.
• IEEE 802.3: Although I do not focus on this frame, you should know it was an expanded frame type that Novell chose to use to support its proprietary Internetwork Packet Exchange/Sequenced Packet Exchange (IPX/SPX) protocol. In fact, when Novell started to convert over to IP as its default protocol, it also changed the default Ethernet frame type back to Ethernet II. So unless you are on a 1990s Novell network, you are not likely going to encounter the 802.3 Ethernet frame type.
As shown in Figure 4-6, the standard Ethernet II frame has the following parts:
Figure 4-6:
The Ethernet II frame structure.
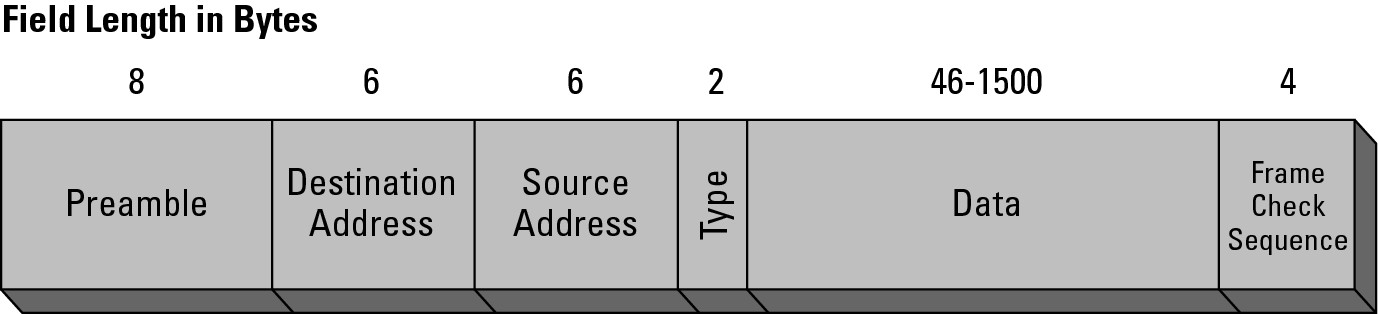
• Preamble: The preamble is a unique sequence of alternating zeros and ones followed by two ones that is eight bytes in length and sets the start of the Ethernet frame. This series of pulses is picked up by the network card in your computer and, by design, this sequence will never occur in the middle of the frame. After the preamble sequence is seen on the network, the network card does not expect to see this again until at least 64 bytes of data has followed the preamble. (There is one of those binary based numbers again — 1, 2, 4, 8, 16, 32, 64).
• Ethernet header: Although I refer to this as the Ethernet header, it could be the header for any type of physical network. The Ethernet header is made up of the following pieces:
• Destination address: Six bytes that contain the MAC address of the NIC that is the target for the network frame.
• Source address: Six bytes that contain the MAC address of the NIC that sends the data on physical media.
• Type: Two bytes that denote the frame type. The type field identifies the higher layer protocol, which typically is IP.
• Data: Between 46–1500 bytes of data. If the data is fewer than 46 bytes, padding is added to bring the frame to the minimum 64 byte frame size. Remember the preamble description; there must be at least 64 bytes of data between preamble sequences.
• Frame check sequence (FCS): Four bytes of FCS data is stored at the end of the frame. Prior to sending the frame, the source computer generates a result from the data found in the frame and stores the result in the last four bytes of the frame. To generate this FCS value, the entire frame is broken into blocks. All those blocks are then added together, and FCS is a sum of all these blocks of data. The receiving computer calculates its own result from the data in the frame and compares the number it calculates to the FCS data. If the results do not match, the frame is considered to be damaged or inaccurate so the frame is discarded. Some people will also refer to this as cyclic redundancy check (CRC) data or a CRC sum. The purpose of the CRC and FCS is the same, which is to verify that the data that was received was not altered or damaged during transmission.
![]() All network frames have the same basic structure as the Ethernet II frame, regardless of the type of data that they contain.
All network frames have the same basic structure as the Ethernet II frame, regardless of the type of data that they contain.
Even though the frame exists at the physical level, it is often referred to at the data link layer, because the only difference between the data link data and the physical layer structure is the preamble and FCS data, which is data that is not passed from the physical layer to the data link layer. If you refer to Book I, Chapter 1, you see that each layer applies a header to the data that will eventually be sent across the network. So if you consider that the information that the data link layer sends down to the physical layer is everything from the start of the Ethernet header to the end of the data, then the header (and trailer or footer) that the physical layer applies to data link data is the preamble and the FCS data. This means that most of the information could technically be considered data link information.
The reason I have given you both the data link and physical layer information together is that almost everyone will describe this data structure as the Ethernet frame, and will place it at the physical layer. For the purpose of moving you through the OSI model, you can consider both the physical and data link layers to have been covered.
Figuring Out Packets
In the network layer, you look only at the section of the frame that was referred to as data in the Ethernet frame (refer to Figure 4-6). As the Ethernet frame moves up from the data link layer to the network layer, the data link header is removed. Removing the data link information removes destination and source address fields (which store the MAC addresses of the network devices), and the type field. Because the preamble and FCS information was removed when the Ethernet frame was sent from the physical layer to the data link layer, this now leaves just the data. The data is not just a blob though. At the network layer, this information is referred to as a packet, and it has its own address data and fields; but when you look at it from the Ethernet frame level, you do not care what that data is.
![]() Data containers are dubbed frames in the data link layer (Layer 2) and packets in the network layer (Layer 3).
Data containers are dubbed frames in the data link layer (Layer 2) and packets in the network layer (Layer 3).
Looking at packets
After you strip off the Ethernet or data link layer structures, you look at what the data link layer considered to be data, which is a packet. The packet’s structure will be based on the network layer protocol. Because IP is the dominant protocol in the world, the most common type of packet data you will see is IP data. Because the network layer data structure is named a packet, and because my example uses IP as the network layer protocol, it is reasonable to call the packet an IP packet. Just like the Ethernet frame had an Ethernet header and a data section, the IP packet has an IP header and a data section. Figure 4-7 shows the contents of an IP packet contained within the Ethernet frame. Notice that the entire IP packet is found in the data field.
Figure 4-7: What the Ethernet frame considers to be data is actually the IP packet and its data.
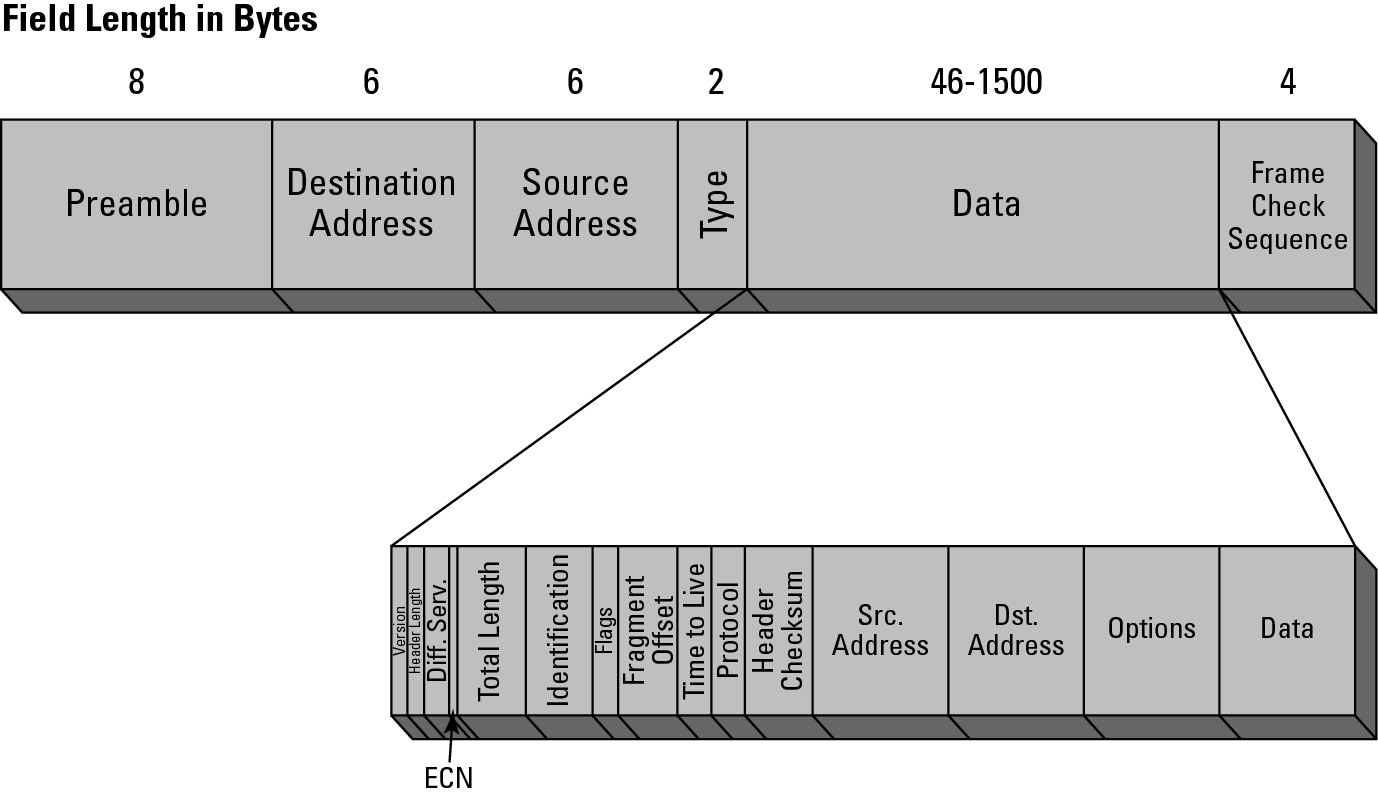
Viewing packet structure
The IP packet is defined by its header, and that header contains many fields. I discuss these fields in more detail in Book II, Chapter 2. However, the key elements that are in the header are
• Version: This is used to identify the IP version being used. There are really only two choices, either version 4 (the first production version of IP that was implemented), or version 6 (which is currently in the process of being implemented over the Internet). Because the headers between IP version 4 (IPv4) and IP version 6 (IPv6) are quite different, and in an effort not to overwhelm and confuse you, I only show the IPv4 header here because it is likely the one you will encounter most over the next decade.
• Time to Live (TTL): The length of time this packet can remain on the network. Each router that handles this packet decrements (reduces) this counter by at least one. You can read more about the purpose of the TTL in Book IV, Chapter 4.
• Protocol: The transport layer protocol where the data portion of the IP packet is to be delivered. This will be either Transmission Control Protocol (TCP) or User Datagram Protocol (UDP).
• Header checksum: In the earlier section “Framing Data,” you read about the frame check sequence (FCS) and cyclic redundancy check (CRC) that are calculations based on the data found in the Ethernet frame and are used to validate the contents of the entire frame. The header checksum is a similar item, but in this case, the data that the calculation is based on is only the header data, and the result of that calculation is stored in the header checksum field. If the header is intact, IP considers the packet good. The higher-level protocols, such as TCP at the transport layer or FTP at the application layer, verify the contents of the data they receive, which they will do with their own checksum mechanism.
• Source address: The IP address of the device that sends the packet onto the network. This is also where any network-level error messages are sent, including Internet Control Message Protocol (ICMP) delivery failures or control messages (discussed in Book II, Chapter 3).
• Destination address: The address the packet is sent to.
• Data: As with the Ethernet frame, the data portion is sent to the transport layer, to either the TCP or UDP. IP does not care what is found here; it is merely the delivery means.
Getting the Lowdown on Low-Level
and High-Level Addressing
You encounter addresses at various layers of the OSI model, but the most common are the data link and networking layers. If you examine the addressing for just these two layers, you have a hardware address (MAC) and a protocol address (IP address).
Taking control of MAC addresses
The MAC address is taken by default from the hardware address of the network card. The MAC address is a 12-digit hexadecimal number or 48 bits in length. This address is assigned by the hardware manufacturer and is globally unique, so you should not have duplicate addresses on your network (although cards with duplicate addresses have been manufactured by production errors in the past). Typically, the problem of duplicate MAC addresses arises because people choose not to use the vendor-assigned hardware address, but instead use a self-assigned address (also called a locally administered address). This is a technique used by hackers to circumvent MAC-based security restrictions. This is more common when using main frame systems that communicate via MAC addresses rather than protocol addresses (such as IP addresses). In the later case, if a computer or its network card is replaced due to a hardware failure, you would have to reconfigure several systems to work with the new MAC address, so it is far easier to assign the new network card the same MAC address as the failed card. Unless you are in the small minority of people with a system such as this, or are a big time hacker, you can safely ignore the ability to manage your own MAC address.
![]() IEEE operates an online database where you can look up MAC addresses at
IEEE operates an online database where you can look up MAC addresses at http://standards.ieee.org/develop/regauth/oui/public.html. The first half of the twelve digit hexadecimal MAC address is used to register hardware vendors, and the second half of the address is assigned by the hardware vendor. Table 4-1 shows a list of the first 20 companies that have addresses registered.
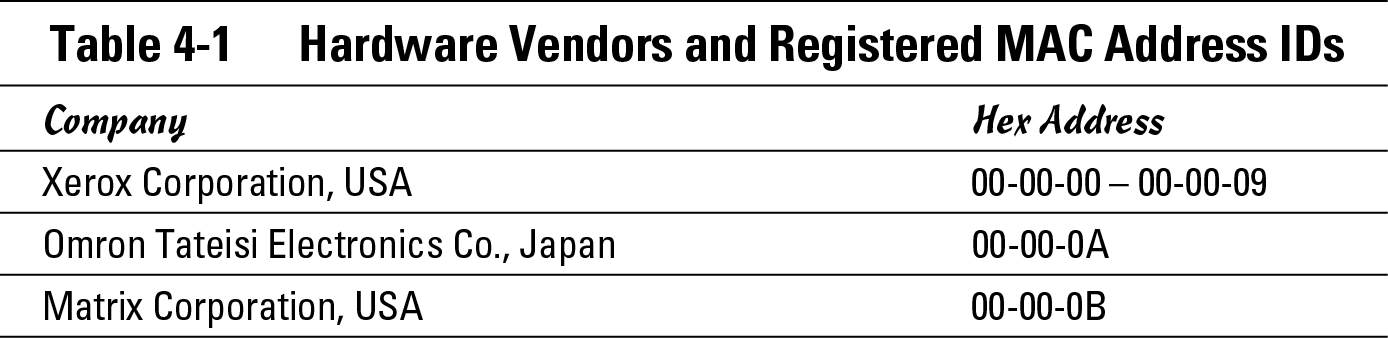
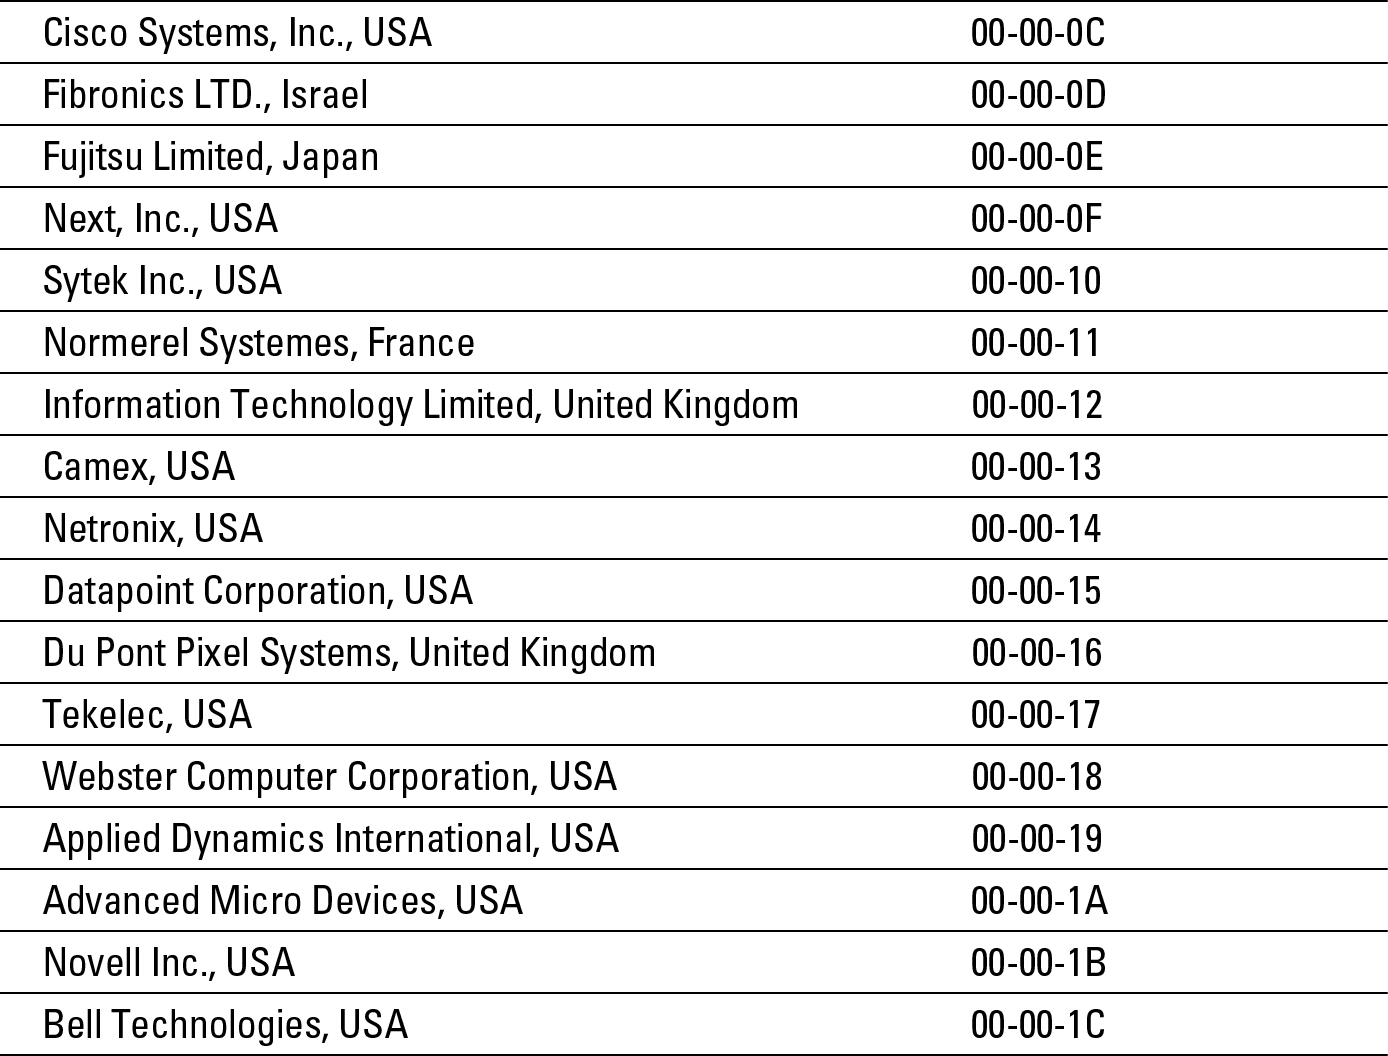
The companies that were first to register IDs on this list were some of the first companies in the networking field. Reviewing even the first few entries on the table, you notice some of those names as incumbent or early starters in the networking and computing world, including Xerox (which actually has the first ten registered numbers), Cisco, Fujitsu, and so on. By using the company registration as half of the MAC address length, there can be almost 17 million registered network card manufacturers, and each registered company can manufacture almost 17 million network cards.
![]() If you are unlucky enough to get duplicated MAC addresses on your network, either by hardware vendor error or by using locally assigned MAC addresses, you are in for some network troubleshooting joy. A duplicated MAC address means you have multiple devices responding to data requests as if they are the only device with that address on the network, or you have a switch that keeps changing the port assignment for that address because the switch keeps seeing the device’s MAC address moving from port to port. This causes any number of issues with network connectivity, as you can probably guess. I have only seen this happen once, and when I finally identified the issue as a duplicate MAC address I just had to say, “Wow, I would have never expected that to happen.” Hopefully, knowing that duplicate MAC addresses might happen, you may not dismiss it as an impossibility, which will allow you to identify the problem more quickly.
If you are unlucky enough to get duplicated MAC addresses on your network, either by hardware vendor error or by using locally assigned MAC addresses, you are in for some network troubleshooting joy. A duplicated MAC address means you have multiple devices responding to data requests as if they are the only device with that address on the network, or you have a switch that keeps changing the port assignment for that address because the switch keeps seeing the device’s MAC address moving from port to port. This causes any number of issues with network connectivity, as you can probably guess. I have only seen this happen once, and when I finally identified the issue as a duplicate MAC address I just had to say, “Wow, I would have never expected that to happen.” Hopefully, knowing that duplicate MAC addresses might happen, you may not dismiss it as an impossibility, which will allow you to identify the problem more quickly.
Structuring the IP address
Unlike the 48-bit MAC address, the IPv4 address is only 32 bits in length. Therefore, far fewer possible IPv4 addresses are in the world than possible MAC addresses. The IPv4 address is broken into four groups of eight bits, or an octet. IP addresses are normally written in dotted decimal notation (decimal numbers with dots in between them). A typical IPv4 address looks like 192.0.2.245.
I cover the structure of IPv4 addresses in full detail in Book II, Chapter 1. Book II, Chapter 4 tells you what you need to know about IPv6.
![]() One of the key things you need to know about IP is that it is routable — the entire network can be broken into smaller segments with data being routed back and forth through routers. Because of this, the size of a network has very few limits, such as the worldwide IP adoption as the standard Internet network protocol.
One of the key things you need to know about IP is that it is routable — the entire network can be broken into smaller segments with data being routed back and forth through routers. Because of this, the size of a network has very few limits, such as the worldwide IP adoption as the standard Internet network protocol.
Reviewing Internetwork Packet Exchange
Unlike IP, which was developed as open protocol with no direct ownership of its technologies, Internetwork Package Exchange (IPX) was developed and is owned by Novell. IPX is also a routable protocol that became popular with Novell’s NetWare server infrastructure.
Implementing IPX was much easier than implementing IP. Whereas IP needs to have addresses assigned manually or by a special server, IPX uses a far simpler technique. When a system starts, IPX creates a local link (or network) address that is primarily made up from the MAC address on its network card. IPX then appends a network ID to the beginning of the address to identify the network segment it belongs to. It identifies its network ID by listening to the traffic on the network, and using whatever network ID everyone else uses or by having the network ID manually set in your computer’s network configuration. IPX assumes that typically you manually set the network ID on your servers and because they are always running, and the clients use the same network ID as the servers.
![]() To route IPX, you need an IPX router, such as the Novell NetWare server, or a hardware router that supports IPX, such as Cisco 3900 series router.
To route IPX, you need an IPX router, such as the Novell NetWare server, or a hardware router that supports IPX, such as Cisco 3900 series router.
Getting the basics with NetBIOS
Extended User Interface
The use of Network Basic Input/Output System (NetBIOS) occurs at the session layer — not the network layer. This has caused a lot of confusion for many people because NetBIOS is sometimes used — incorrectly — as a synonym for NetBIOS Extended User Interface (NetBEUI), which is a distinct network protocol that is built heavily around NetBIOS.
Microsoft uses NetBIOS heavily as a session layer protocol. As such, Microsoft also adopted NetBEUI as its default protocol for its operating systems.
Compared to IPX and IP, one of the major shortcomings of NetBEUI is that it is not a routable protocol. You cannot create a large multisite network using NetBEUI because you cannot route traffic between locations. You could set up a multisite bridged network, but even that causes a lot of unneeded traffic to cross the links between your offices or locations. This is not desirable. The address that is used to identify stations on a NetBEUI-based network is the MAC address of each station on the network. Your network devices will not have a network portion of their address like IPX and IP included with their addresses.
Watching the Traffic Go By
If you read Book I, Chapter 2, you read about traffic being sent out over the network. Now I discuss exactly how this task is performed. Here are the two main methods used to release traffic onto the network:
• CSMA/CD: Carrier Sense, Multiple Access with Collision Detection
• CSMA/CA: Carrier Sense, Multiple Access with Collision Avoidance
In this section, I tell you what you really need to know about both methods. The impact of either of these methods is reduced greatly when working on switched networks without shared access devices, such as hubs or wireless access points (WAPs).
CSMA/CD
CSMA/CD is the main frame-control process on wired Ethernet networks. Here is a breakdown of the name:
• Carrier sense is built into the network card. The network device can detect the carrier wave that is on the network. That goes along with the green light you get when the network is properly attached to the network.
• Multiple access allows for multiple devices to share the networking medium through some process, communication standards, or protocol. Because only one node on the wire can really transmit data at a time, you need a sharing method that everyone or every host on the network agrees to.
• Collision detection means that in addition to the multiple access sharing, you specifically use two factors to help determine whether a collision occurs:
• Ethernet round trip time: The time it takes for a frame to reach every possible node in your collision domain.
• Interframe gap: The minimum safe distance between frames on the network that allows time for the receive buffer (a small amount of memory on a network card used to store incoming data that needs to be processed) on the receiving stations to process all frames.
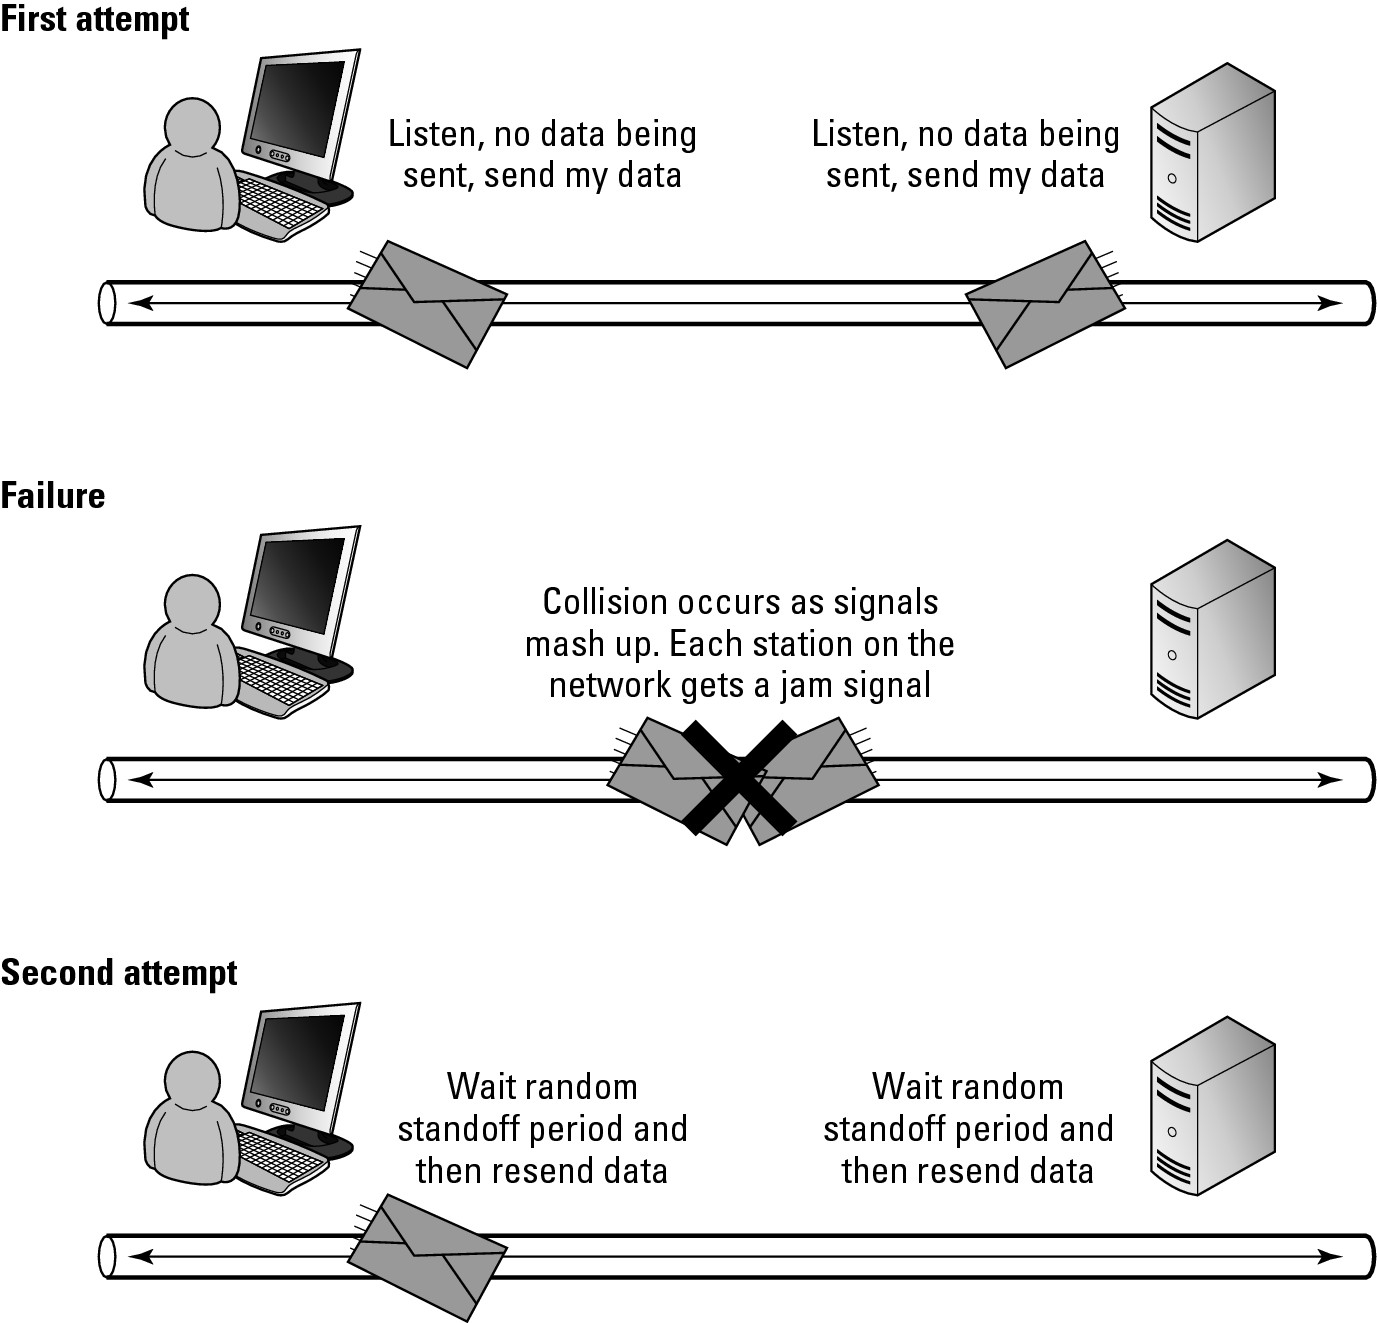
If a receiving station sees frames coming too quickly (that is, without a sufficient gap between them), it can send a jam signal to notify others of a collision. If a station sends a frame and sees more traffic before the round trip time has expired, it can send a jam signal as well. When a jam signal or collision is sent on the network, all systems wait for a random period of time before attempting to send their data again. This random wait reduces the chance of another collision on a network.
To reduce the chance of collision from occurring at all, prior to sending data frames on the network, the system will listen on the network to see if there is anyone currently sending a frame. If there is current activity on the network, the system will wait for a break and then send its frames out on the network. This process is illustrated in Figure 4-8.
CSMA/CA
CSMA/CA is a similar system to CSMA/CD but instead of dealing with collisions when they happen, the goal is to have them not occur at all. I know when I deal with my car, I prefer to avoid collisions rather than deal with them after they occur. The negative impact of network collisions is that you have to wait and retransmit data (unlike real-world collisions). The network cost of collisions is a mandatory waiting period, which takes longer to transmit your data. Collision avoidance is the process used on the Macintosh AppleTalk network and is still used on 802.11 wireless networks.
So how does collision avoidance differ from collision detection? Well, it is that whole avoidance bit in the name. To avoid collisions:
Figure 4-8: The CSMA/CD process.
1. Each station that wants to send data listens to the network to see whether the network is in use.
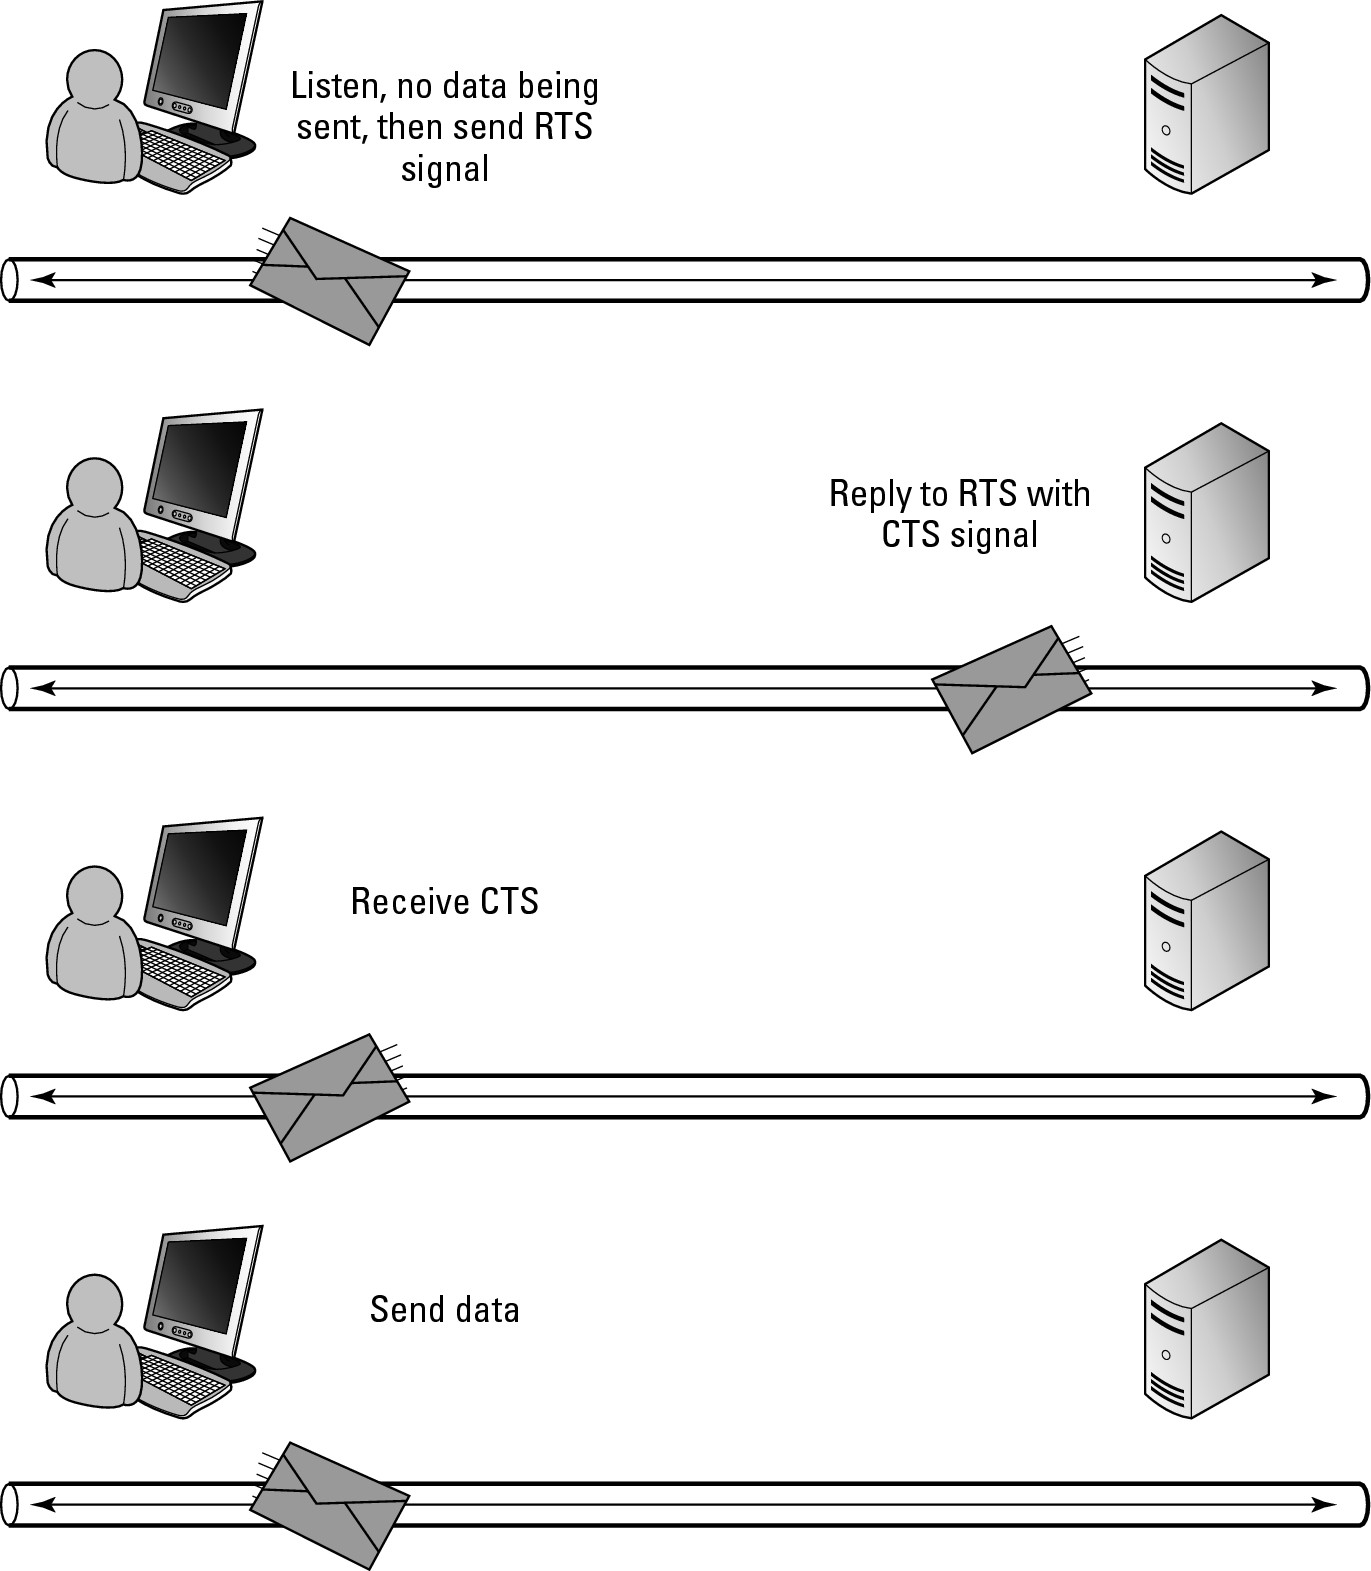
2. If the network is not in use, the station sends a Ready to Send (RTS) signal, hoping for a Clear to Send (CTS) signal back from the other
stations.
3. After the other stations give the CTS signal, they are required to not send any data for a short length of time (milliseconds).
This leaves the network free for the sending station to use, which ensures that you have a near zero chance of having a collision when you send your data. (You can see this process in Figure 4-9.) It is actually more likely that a collision would occur when the RTS request is sent out on the network.
Figure 4-9: The CSMA/CA process.
Choosing CSMA/CD or CSMA/CA
The drawback of the CSMA/CA system is that you may still have periods of waiting. If you do not get a CTS signal, you have to wait a short random period of time and send the RTS again and (possibly) again. Because the RTS and CTS is actually data you send on the network, you still run the risk of collisions, although this risk is greatly reduced due to the length of the data. Ethernet was built using CSMA/CD. The developers of Ethernet reasoned that if you send small bits of data (in the form of RTS and CTS frames) anyway, you may as well just send the full data, which speeds up the whole process if the data gets through on the first attempt. Most speed tests that have been conducted comparing the two systems support the Ethernet case. When operating on a network, collision detections elimination of the wait states and the collision resolution process allows for more overall data throughput on the network than the collision avoidance system allows. If a network is heavily congested, you have slower data transfers when using either method.
Moving to a switch-based network reduces collisions and wait states because each switch port becomes its own collision domain, typically with only one host on that network segment. This greatly reduces speed issues caused by excessive collisions, making CSMA/CD an even better choice.
Sharking the Network Data
Formerly Ethereal, Wireshark is network protocol analyzer, which is a tool that can view the details of network traffic. Before the prevalence of network switching, a tool like this could view all traffic that is flowing on your network. In switched environments, you see only the traffic destined for your computer or broadcast traffic on the network unless you have enabled a monitoring port on the network switch, allowing you to see all traffic on that switch.
Many products are in this category — some that you can purchase, and some that are free. As free products go, Wireshark is a fairly full-featured product and can be downloaded from www.wireshark.org. Wireshark is free under the GNU General Public License (GPL) and is available for Windows, Mac OS X, and Linux. Linux users typically find this application in their distribution by default.
Other products that you may also consider include:
• Microsoft Network Monitor from www.microsoft.com
• TCPDump from www.tcpdump.org
• Capsa Network Analyzer from www.colasoft.com
• ClearSight Analyzer from www.flukenetworks.com
![]() Network protocol analyzers are also called network sniffers. While this book is aimed at Cisco networking, any of these tools will capture any data off of your network, regardless of the manufacturer of your routers or switches. Of course, they work great with Cisco network equipment as well.
Network protocol analyzers are also called network sniffers. While this book is aimed at Cisco networking, any of these tools will capture any data off of your network, regardless of the manufacturer of your routers or switches. Of course, they work great with Cisco network equipment as well.
Wireshark allows you to capture and analyze network traffic on your network, which can be critical to network troubleshooting efforts. One example involves Dynamic Host Configuration Protocol (DHCP) servers on your network. Typically, you will only have one DHCP server, but sometimes a network user will install a rogue (unauthorized and unknown) DHCP server on your network. This rogue DHCP server may then start to issue Negative Acknowledgments (NACKs) — a refusal — to all DHCP requests on your network. You could spend hours troubleshooting this issue, but within a few seconds of starting a network capture (to collect and view traffic on your network), you have easily identified the problem and the IP address of the offending system (the rogue DHCP server).
Although you could use the captured data for other purposes, such as viewing telnet sessions or other clear text traffic, Wireshark is great at viewing which systems are talking, who is sending the most traffic, and how to diagnose network issues from a very low level.
When you install Wireshark, you are prompted during the installation to install WinPcap, which is the actual capture driver that does the heavy lifting for Wireshark. Wireshark takes care of data display and analysis, while WinPcap is the capture driver that captures the live network traffic from the network. You can choose all the defaults for the installation; the only real question you may have is whether you want WinPcap to start with the operating system. If you choose to have WinPcap start with the operating system, then it will always be consuming some of your computer’s resources, even when Wireshark does not need WinPcap.
![]() Normally, WinPcap starts as needed when running Wireshark. If you are running Windows 7 though, the default Windows 7 security features will prevent the WinPcap driver from starting when running Wireshark. In that case, you want WinPcap to start with the operating system.
Normally, WinPcap starts as needed when running Wireshark. If you are running Windows 7 though, the default Windows 7 security features will prevent the WinPcap driver from starting when running Wireshark. In that case, you want WinPcap to start with the operating system.
To set up a basic capture of data, follow these steps:
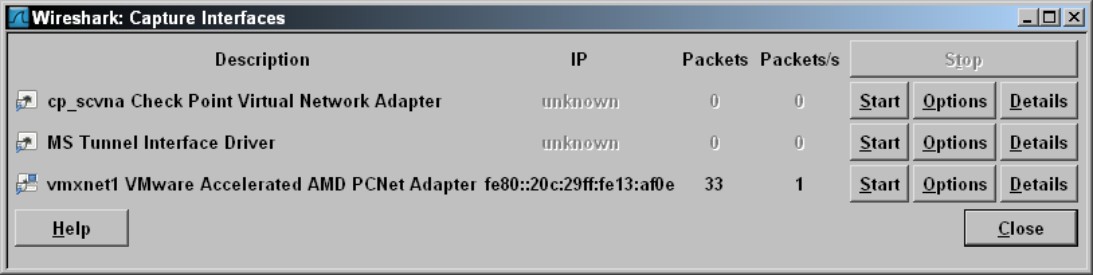
1. Select the network card that you want to use to perform the capturing by choosing Capture⇒Interfaces.
The Capture Interfaces window shown in Figure 4-10 appears, showing you not only the listed interfaces but also the data received and sent on the interfaces on your computer. You could also select a capture interface by choosing Capture⇒Options, but I prefer using the Capture Interfaces window because seeing the data being sent and received on your computer’s interfaces lets you identify the active network card. This is a benefit to you when you have more than one network card in a computer.
2. Click the Start button next to your active network interface to kick off a capture session.
Figure 4-10: Preparing to capture data with Wireshark by viewing interfaces.
Formatting a MAC address
While IP addresses are typically displayed using the familiar dotted decimal notation (192.0.2.75), the same cannot be said about MAC addresses. You typically see four common formats for MAC addresses:
![]() 001D7EF823D6
001D7EF823D6
![]() 001D7E-F823D6
001D7E-F823D6
![]() 00:1D:7E:F8:23:D6
00:1D:7E:F8:23:D6
![]() 00-1D-7E-F8-23-D6
00-1D-7E-F8-23-D6
There is not a functional difference between these formats; it is simply a choice by various application programmers to require MAC addresses to be typed a certain way, or to display a certain way.
On the screen that appears, data scrolls past. You see the following three basic panes, as shown in Figure 4-11:
Figure 4-11: Capturing data with Wireshark.
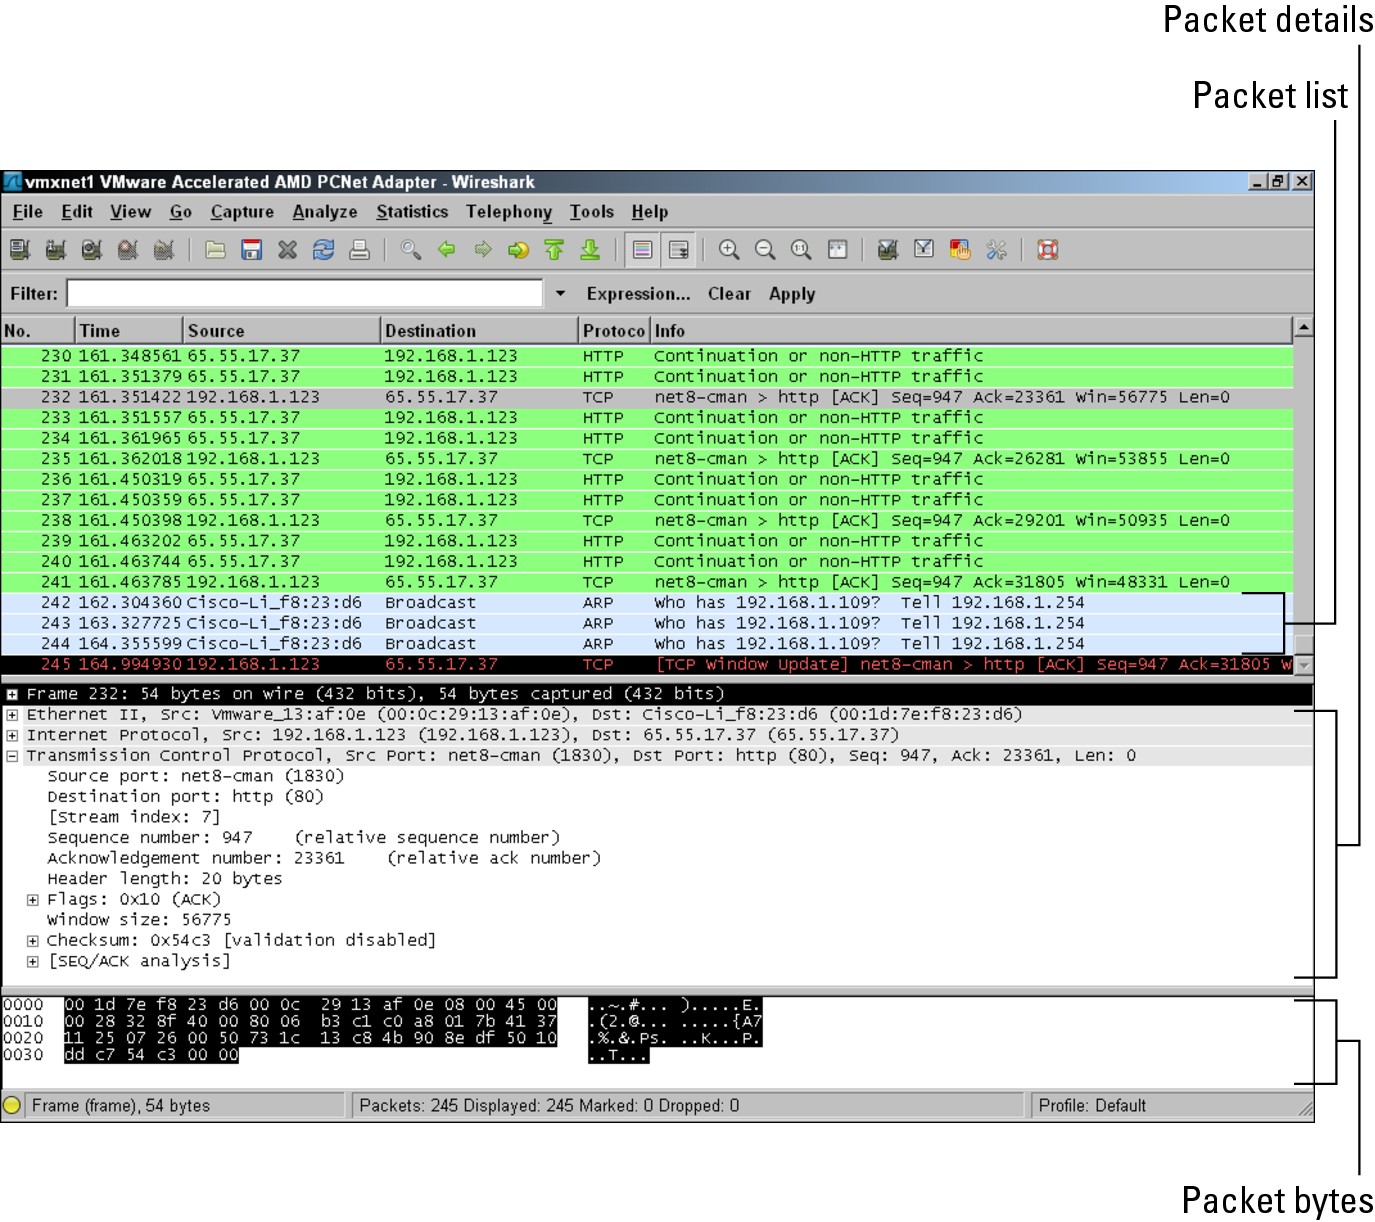
• Packet List: The pane toward the top of the screen. This pane shows all the network frames that have been seen by your network card. If your network card is connected to a hub, then this will be all the traffic on the network; but if the card is attached to a switch, it will only broadcast frames and the network frames addressed to the card’s MAC address. The information that you see here includes the frame number, as well as the following:
• Time: The number of milliseconds that has elapsed since the start of the network capture.
• Source Address: The address of the device that sent the network frame on to the network. This may be an IP address such as 192.168.1.123, or a MAC address such as 00:1D:7E:F8:23:D6. The display of either of these addresses depends on if a higher layer address (such as the network layer address) is present in the network frame; if it is not, then the MAC address is shown. Notice that the MAC address is displayed as Cisco-Li_f8:23:d6. This is because the default option of Enable Mac Name Resolution is enabled; this option shows a portion of the network card manufacturer in the manufacturer ID portion of the MAC address. This can be helpful, because you know that the address in the captured frame belongs to a Cisco device.
• Destination Addresses: The address where the network frame is being sent. The values and options are the same as the source address.
• Protocol: The highest layer protocol that is present in the frame. In Figure 4-10, you can see ARP, TCP, and HTTP.
• Info: This column displays summary information about the frame. This is a WireShark interpretation of what data is in the frame. The intention is to make it easier for you to understand what type of data is in the network frame.
• Packet Details: The pane related to the currently selected packet in the middle frame, with an expanding hierarchy. This allows you to drill into the sections of this data — like moving through the OSI layers. If you expand the Ethernet II section, you can compare the data to the Ethernet frame structure (described in the earlier section, “Framing Data”). If you expand the Internet Protocol section, you can compare the data to the packet structure (see the earlier section, “Viewing packet structure”).
• Packet Bytes: This pane shows ASCII and hex data that is in the frame. Remember, all data sent in the network frame is binary, and that you can convert this binary data into hexadecimal, as described in Book I, Chapter 3. Finally, every eight bits or one byte can be represented by an ASCII character. This pane shows you all of the binary data in Ethernet frame in both its hexadecimal and ASCII equivalent. This can sometimes be helpful when looking for ASCII strings in the data. This data is seen in a neater format in the Packet Details pane.
![]() By selecting different sections of the frame in the Packet Details pane the matching section of the Packet Bytes pane becomes highlighted. This can be helpful if you are attempting to locate a hexadecimal or ASCII equivalent for what you see in the Packet Details pane. If you are following along with Wireshark, try selecting different parts of the frame in the Packet Details pane.
By selecting different sections of the frame in the Packet Details pane the matching section of the Packet Bytes pane becomes highlighted. This can be helpful if you are attempting to locate a hexadecimal or ASCII equivalent for what you see in the Packet Details pane. If you are following along with Wireshark, try selecting different parts of the frame in the Packet Details pane.
Wireshark is a powerful data capture tool with a great deal of power and a huge amount of potential. While I attempt to cover some of the basic operation and options, this program could have an entire book devoted to it. There are many guides available for Wireshark, but if you are interested in unlocking more power that I show you, start by choosing Help⇒Contents.
Capture options
If you want to explore the options available in Wireshark, you can get into the Capture Options dialog box by choosing Capture⇒Options. In the Capture Options dialog box (see Figure 4-12), you have several, well, options. Some main options include
Figure 4-12: Options available for capturing data.
• Capture Packets in Promiscuous Mode: Allows you to see data destined for other devices on the network, assuming that traffic touches your network card.
• Update List of Packets in Real Time: Allows you to see data when it comes in to Wireshark.
• Automatic Scrolling in Live Capture: Scrolls the capture window’s packet list, allowing you to see the most recent capture data. This can roll through data very quickly on a busy network.
• Enable MAC Name Resolution: Displays information on network card vendors when available.
• Enable Network Name Resolution: Resolves host names when possible.
• Enable Transport Name Resolution: Shows you the name of the protocol that is in use, which is not always the protocol in use because many client side ports are chosen randomly.
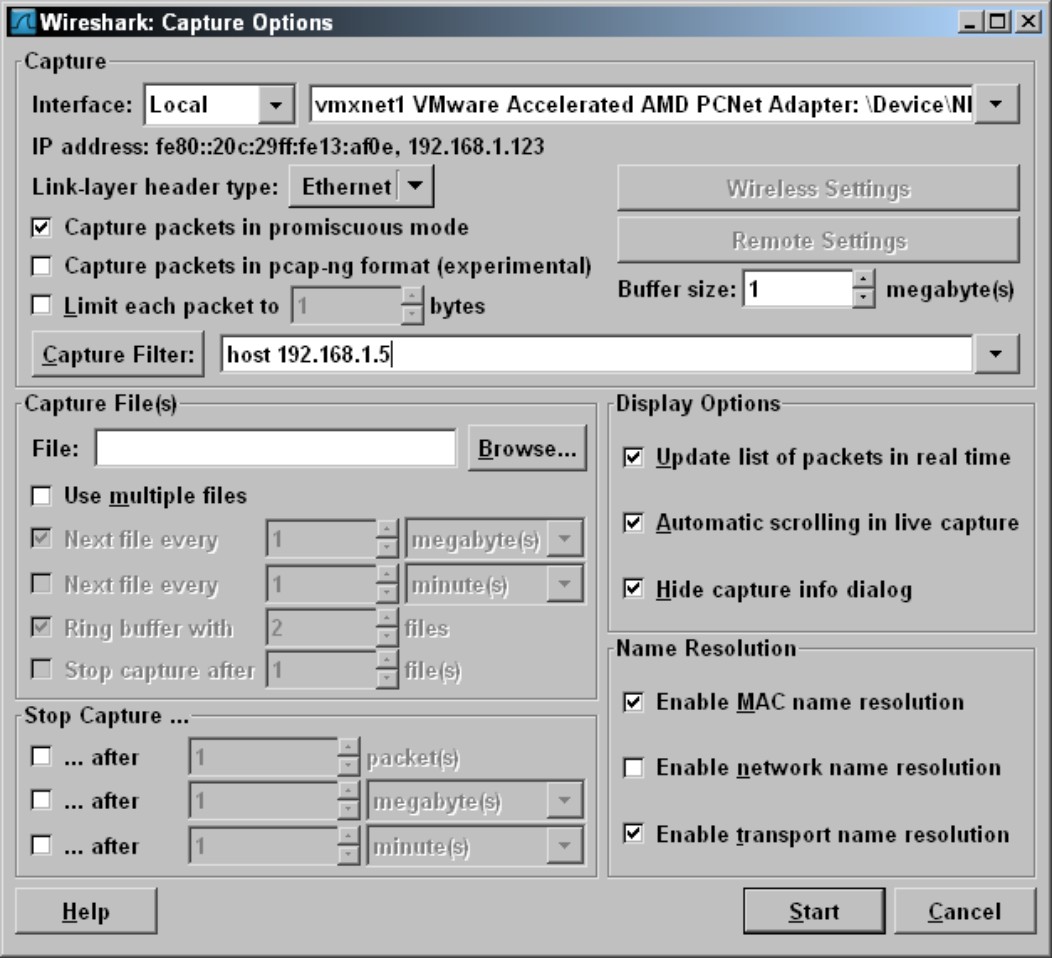
Filtering captured data
Wireshark will capture everything it sees (except what it discards when not capturing in promiscuous mode), which in either case can be a huge amount of data. You have a couple of options for filtering data. You can filter the data packets while you are capturing them, which reduces the amount of data you capture; or you can filter the displayed data, which cuts down what you see on the screen. You can set the capture filter on the Capture Options dialog box (see Figure 4-13). Options include
• Capture Filter: Using standard tcpdump options, such as tcp port 80 and host 192.168.1.5, to filter captured data, you can greatly reduce the amount of data that you capture. This is a great option if you want to capture data over a day or a week because the resulting capture file is much more manageable.
• Capture File(s): If you want to be able to review your capture data at a later date, you can choose to capture the data into one or more files. The Capture Files(s) section of the Capture Options dialog box allows you to specify your file options.
• File: In the File field, simply specify the file path and name where you want to save your capture data. You can also use the Browse button to browse to it directly and specify a filename to use. Capture files should be saved with the extension of .cap.
• Use Multiple Files: To keep file sizes down, you can specify to use multiple files by selecting this check box. After you have done that, you can then choose to create new files based on the size of the file or a period of time.
Figure 4-13: Capturing data to a file.
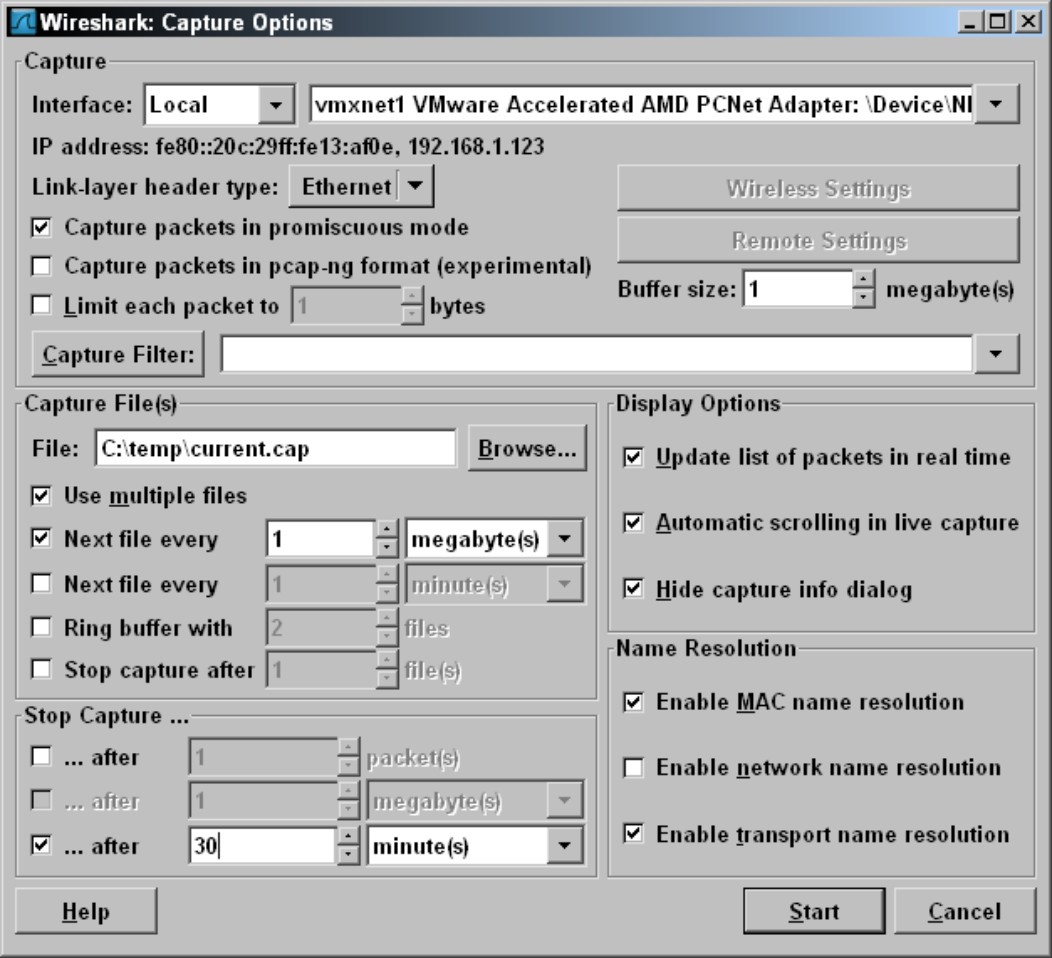
• Ring Buffer: Although there are options to automatically stop Wireshark capturing data, you may want Wireshark to capture data constantly and to stop it after you have an incident on your network. For example, if you have a recurring incident that you are troubleshooting, and the problem will likely occur over the next 24 hours, then you can make use of the ring buffer. You would still set your multiple files option and specify to use a new file after an amount of data is captured or when a period of time has passed. After you have set the multiple files option, you can then set the number of files to use as the ring buffer. Wireshark will then save the files until it has filled the specified number of files. When all files are full, it will loop back to the first file and start overwriting the saved capture files. The benefit of this is that when your random network incident happens, you can stop the capture process, and you will have the most current network capture leading up to the incident. This is helpful when troubleshooting this type of intermittent problem. This option allows you to review the data that occurred in the most recent period of time and have a predictable size for the files.
• Stop Capture: Have the capture automatically stop after:
• A certain number of packets have been captured.
• A certain amount of data has been received, or when the capture file has reached a specified size.
• A period of time has passed.
If you have captured all your data and then decide that you need to reduce that amount of data you see in the Packet List pane, you can use the Filter box just above the Packet List pane (refer to Figure 4-11). This field uses similar options to the Capture Filter field in Capture Options dialog box, but to make your life interesting (and confusing), they are not identical in their format. (Do not blame me, I did not write the program!) To filter data, you could use options such as
• arp: Used to only show ARP network frames.
• http: Used to only show IP packets that have the http application layer protocol.
• ip.addr==192.168.1.5: Used to only show IP packets that have 192.168.1.5 as a source or destination IP address.
• http and ip.addr==192.168.1.5: Used to only show IP packets that contain http application layer protocol information and have 192.168.1.5 as a source or destination IP address.
![]() In addition to the graphical Wireshark capture program to view and manipulate your captured data, the program
In addition to the graphical Wireshark capture program to view and manipulate your captured data, the program tshark.exe is included with the installation of Wireshark on your computer. This is a command-line tool that can capture, view, and manage your network data. Quite a few options can be used with this program, and a huge online community can explain what some of the more advanced features do. Running tshark.exe –h from the Wireshark installation directory gives you a summary of the options that are available.