
One of the most common types of charts is a scatter plot. This helps us visualize the relationship between two numeric variables.
We'll need to list Incanter as a dependency in our Leiningen project.clj file:
(defproject reports "0.1.0-SNAPSHOT"
  :dependencies [[org.clojure/clojure "1.6.0"]
                 [incanter "1.5.5"]])
We'll also require several of Incanter's namespaces into our script or REPL:
(require '[incanter.core :as i]
         '[incanter.charts :as c]
         'incanter.datasets)
Finally, we'll use the iris dataset, which we saw in several recipes in Chapter 9, Clustering, Classifying, and Working with Weka:
(def iris (incanter.datasets/get-dataset :iris))
For this recipe, we'll create a chart plotting the dimensions of the iris' petals:
- We'll create the chart, but hang on to the object created so that we can do things with the chart, such as displaying it, later:
(def iris-petal-scatter (c/scatter-plot (i/sel iris :cols :Petal.Width) (i/sel iris :cols :Petal.Length) :title "Irises: Petal Width by Petal Length" :x-label "Width (cm)" :y-label "Length (cm)")) - To actually display this chart, we pass it to the
incanter.core/viewfunction:(i/view iris-petal-scatter)
The output of the preceding line resembles the following screenshot:
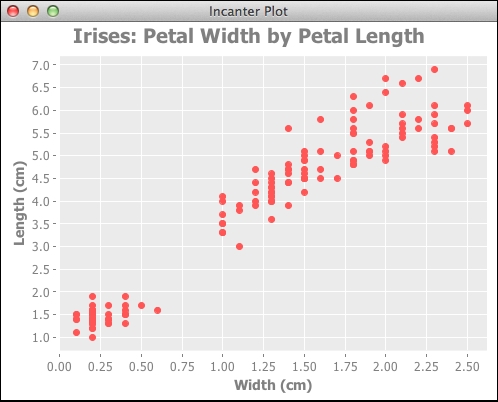
The incanter.charts/scatter-plot function takes two sequences, one of the points' x coordinates and one of their y coordinates.
By default, Incanter labels the x- and y-axes from the expressions we use in the call to scatter-plot. In this case, that would be (i/sel race-data :cols :Petal.Width) for the x-axis and (i/sel race-data :cols :Petal.Length) for the y-axis. That's not very readable, so we specify the axes' labels with the :x-label and :y-label parameters.
However, the scatter-plot function only creates the chart object. To view it, we have to pass it to the incanter.core/view function.
If we right-click on a displayed graph, several other options show up as well. From the context menu, we can zoom in and out, print the chart, and change the labels. The charts are also interactive. Clicking and dragging on the graph zooms the view into focus on the area we selected.
- The Incanter API documentation that lists the supported charts and the options for each is at http://liebke.github.com/incanter/charts-api.html.
- The Incanter Wiki also has a gallery of sample charts on GitHub, at https://github.com/liebke/incanter/wiki/sample-plots-in-incanter.