 Creating function plots with Incanter
by Eric Rochester
Clojure Data Analysis Cookbook - Second Edition
Creating function plots with Incanter
by Eric Rochester
Clojure Data Analysis Cookbook - Second Edition
- Clojure Data Analysis Cookbook Second Edition
- Table of Contents
- Clojure Data Analysis Cookbook Second Edition
- Credits
- About the Author
- About the Reviewers
- www.PacktPub.com
- Preface
- 1. Importing Data for Analysis
- Introduction
- Creating a new project
- Reading CSV data into Incanter datasets
- Reading JSON data into Incanter datasets
- Reading data from Excel with Incanter
- Reading data from JDBC databases
- Reading XML data into Incanter datasets
- Scraping data from tables in web pages
- Scraping textual data from web pages
- Reading RDF data
- Querying RDF data with SPARQL
- Aggregating data from different formats
- 2. Cleaning and Validating Data
- Introduction
- Cleaning data with regular expressions
- Maintaining consistency with synonym maps
- Identifying and removing duplicate data
- Regularizing numbers
- Calculating relative values
- Parsing dates and times
- Lazily processing very large data sets
- Sampling from very large data sets
- Fixing spelling errors
- Parsing custom data formats
- Validating data with Valip
- 3. Managing Complexity with Concurrent Programming
- Introduction
- Managing program complexity with STM
- Managing program complexity with agents
- Getting better performance with commute
- Combining agents and STM
- Maintaining consistency with ensure
- Introducing safe side effects into the STM
- Maintaining data consistency with validators
- Monitoring processing with watchers
- Debugging concurrent programs with watchers
- Recovering from errors in agents
- Managing large inputs with sized queues
- 4. Improving Performance with Parallel Programming
- Introduction
- Parallelizing processing with pmap
- Parallelizing processing with Incanter
- Partitioning Monte Carlo simulations for better pmap performance
- Finding the optimal partition size with simulated annealing
- Combining function calls with reducers
- Parallelizing with reducers
- Generating online summary statistics for data streams with reducers
- Using type hints
- Benchmarking with Criterium
- 5. Distributed Data Processing with Cascalog
- Introduction
- Initializing Cascalog and Hadoop for distributed processing
- Querying data with Cascalog
- Distributing data with Apache HDFS
- Parsing CSV files with Cascalog
- Executing complex queries with Cascalog
- Aggregating data with Cascalog
- Defining new Cascalog operators
- Composing Cascalog queries
- Transforming data with Cascalog
- 6. Working with Incanter Datasets
- Introduction
- Loading Incanter's sample datasets
- Loading Clojure data structures into datasets
- Viewing datasets interactively with view
- Converting datasets to matrices
- Using infix formulas in Incanter
- Selecting columns with $
- Selecting rows with $
- Filtering datasets with $where
- Grouping data with $group-by
- Saving datasets to CSV and JSON
- Projecting from multiple datasets with $join
- 7. Statistical Data Analysis with Incanter
- Introduction
- Generating summary statistics with $rollup
- Working with changes in values
- Scaling variables to simplify variable relationships
- Working with time series data with Incanter Zoo
- Smoothing variables to decrease variation
- Validating sample statistics with bootstrapping
- Modeling linear relationships
- Modeling non-linear relationships
- Modeling multinomial Bayesian distributions
- Finding data errors with Benford's law
- 8. Working with Mathematica and R
- Introduction
- Setting up Mathematica to talk to Clojuratica for Mac OS X and Linux
- Setting up Mathematica to talk to Clojuratica for Windows
- Calling Mathematica functions from Clojuratica
- Sending matrixes to Mathematica from Clojuratica
- Evaluating Mathematica scripts from Clojuratica
- Creating functions from Mathematica
- Setting up R to talk to Clojure
- Calling R functions from Clojure
- Passing vectors into R
- Evaluating R files from Clojure
- Plotting in R from Clojure
- 9. Clustering, Classifying, and Working with Weka
- Introduction
- Loading CSV and ARFF files into Weka
- Filtering, renaming, and deleting columns in Weka datasets
- Discovering groups of data using K-Means clustering
- Finding hierarchical clusters in Weka
- Clustering with SOMs in Incanter
- Classifying data with decision trees
- Classifying data with the Naive Bayesian classifier
- Classifying data with support vector machines
- Finding associations in data with the Apriori algorithm
- 10. Working with Unstructured and Textual Data
- Introduction
- Tokenizing text
- Finding sentences
- Focusing on content words with stoplists
- Getting document frequencies
- Scaling document frequencies by document size
- Scaling document frequencies with TF-IDF
- Finding people, places, and things with Named Entity Recognition
- Mapping documents to a sparse vector space representation
- Performing topic modeling with MALLET
- Performing naïve Bayesian classification with MALLET
- 11. Graphing in Incanter
- Introduction
- Creating scatter plots with Incanter
- Graphing non-numeric data in bar charts
- Creating histograms with Incanter
- Creating function plots with Incanter
- Adding equations to Incanter charts
- Adding lines to scatter charts
- Customizing charts with JFreeChart
- Customizing chart colors and styles
- Saving Incanter graphs to PNG
- Using PCA to graph multi-dimensional data
- Creating dynamic charts with Incanter
- 12. Creating Charts for the Web
- Introduction
- Serving data with Ring and Compojure
- Creating HTML with Hiccup
- Setting up to use ClojureScript
- Creating scatter plots with NVD3
- Creating bar charts with NVD3
- Creating histograms with NVD3
- Creating time series charts with D3
- Visualizing graphs with force-directed layouts
- Creating interactive visualizations with D3
- Index
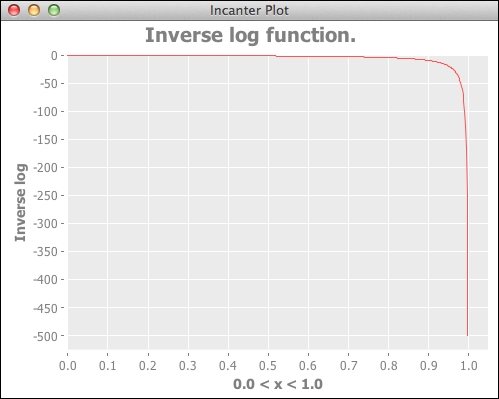
Sometimes we don't want to graph data, but plot the values of a function over a given domain instead. In this recipe, we'll see how to graph an inverse log function, although any other function would work just as well.
We'll use the same dependencies in our project.clj file as we did in Creating scatter plots with Incanter.
We'll use this set of imports in our script or REPL:
(require '[incanter.core :as i]
'[incanter.charts :as c])We just create and display a function-plot object:
(def f-plot
  (c/function-plot
    #(/ 1.0 (Math/log %)) 0.0 0.99
    :title "Inverse log function."
    :y-label "Inverse log"))
 i/view f-plot)
The graph is, as we would expect, like this:
-
No Comment
..................Content has been hidden....................
You can't read the all page of ebook, please click here login for view all page.