
Incanter's chart API is easy to use and provides a powerful wrapper around JFreeChart (http://www.jfree.org/jfreechart/). However, it doesn't expose JFreeChart's full variety of chart types or all the options that JFreeChart provides. In order to access those, we have to dive from Incanter's API into the JFreeChart objects. Fortunately, that's quite easy to do. Let's see how.
We'll use the same dependencies in our project.clj file as we did in Creating scatter plots with Incanter.
We'll use this set of imports in our script or REPL:
(require '[incanter.core :as i]
         '[incanter.charts :as c]
         'incanter.datasets)
(import org.jfree.chart.renderer.category.LayeredBarRenderer
        org.jfree.util.SortOrder)
We'll use the Iris dataset again. Here's how to load it in Incanter:
(def iris (incanter.datasets/get-dataset :iris))
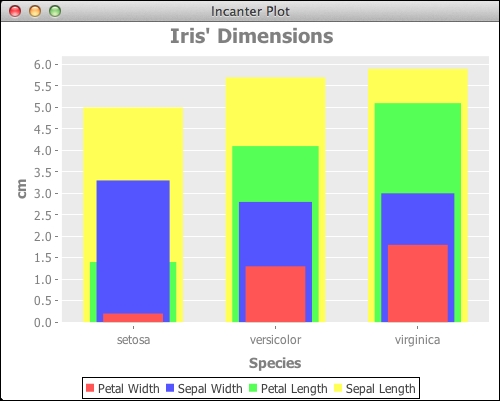
For this recipe, we'll create a bar chart with multiple columns, one for each measurement column in the Iris dataset:
- We'll first create the bar chart and add a category for each measurement:
(def iris-dimensions (i/with-data iris (doto (c/bar-chart :Species :Petal.Width :title "iris' dimensions" :x-label "species" :y-label "cm" :series-label "petal width" :legend true) (c/add-categories :Species :Sepal.Width :series-label "sepal width") (c/add-categories :Species :Petal.Length :series-label "petal length") (c/add-categories :Species :Sepal.Length :series-label "sepal length")))) - The
iris-dimensionsobject is theJFreeChartobject for this chart. We can call its methods to change how the chart is created. In this case, we'll change the renderer to layer the bars on top of each other, and we'll change the rendering order so that we can see each bar in the stack:(doto (.getPlot iris-dimensions) (.setRenderer (doto (LayeredBarRenderer.) (.setDrawBarOutline false))) (.setRowRenderingOrder SortOrder/DESCENDING)) - Now, like the other charts, we display this chart using
incanter.core/view:(i/view iris-dimensions)
The results of the preceding line are something we can't get from Incanter's chart API alone. The resulting chart is as follows:
The object returned by the Incanter chart functions is the JFreeChart object. This is the builder class for all the charts. From this object, we can access the plot objects, which provide interfaces for different types of charts, and from the plot objects, we can access options such as axes, annotations, colors, and renderers, which handle the actual drawing of the chart.
That's what we do in this recipe. The relevant code snippet is as follows:
(doto (.getPlot iris-dimensions)
  (.setRenderer (doto (LayeredBarRenderer.)
                 (.setDrawBarOutline false)))
(.setRowRenderingOrder SortOrder/DESCENDING))In this code, we get the plot, set the renderer to an instance of LayeredBarRenderer, and then change the order of row rendering. If we don't do that, then the shorter rows get rendered behind the taller ones, which isn't useful.
- The class hierarchy for this is quite complex and fully featured. To get a good feel for its breadth and for what the library is capable of, browse the Java docs for it at http://www.jfree.org/jfreechart/api/javadoc/org/jfree/chart/JFreeChart.html.
- If you plan on using JFreeChart a lot, the developer guide at http://www.jfree.org/jfreechart/devguide.html may be a good investment.