
If you've been following along from the previous recipes in this chapter, you'll now have a complete web application stack ready, and you can use it to create charts and graphs for the Web.
For this recipe, we'll create a scatter plot of the US census racial data that we saw in Chapter 6, Workin with Incanter DataSets, in the Grouping data with $group-by recipe. In fact, this will be the same recipe as we saw in Chapter 10, Working with Unstructured and Textual Data, only this time we'll create a web page.
To do this, we'll use the D3 JavaScript library (http://d3js.org/). D3 stands for Data-Driven Documents, and this library makes it easy to load data and create HTML and SVG structures from data. You can use it to transform data into tables or charts. It is pretty low-level though. With D3, we will create many of the actual elements. We'll do this in a later recipe, but for now, we'll use the NVD3 library (http://nvd3.org/), which is a collection of prebuilt charts. We can set a few parameters, pass them our data, and immediately get a great looking chart back out.
We'll again build on the previous recipes in this chapter, so make sure you have the environment and web application described in the Setting up to use ClojureScript recipe running.
We can use the same namespace declaration that we did in the Creating HTML with Hiccup recipe.
I've transformed the CSV data into JSON, so we can serve it statically. You can download this from http://www.ericrochester.com/clj-data-analysis/data/census-race.json and put it into the resources/data/ directory in your project.
There are a number of steps that need to be performed to add a resource to a web application, as shown here:
- Before we get started, we need to download the NVD3 style sheet from https://raw.github.com/novus/nvd3/master/src/nv.d3.css and save it into
resources/css. - We'll also need the NVD3 JavaScript library itself from https://raw.github.com/novus/nvd3/master/nv.d3.min.js. Save it to
resources/js. - Now, let's add a Hiccup template function to the
src/web_viz/web.cljfile. We can pass it a title and some content, and it will fill in the rest of the page:(defn d3-page [title js body & {:keys [extra-js] :or {extra-js []}}] (html5 [:head [:title title] (include-css "/css/nv.d3.css")) (include-css "/css/style.css")] [:body (concat [body] [(include-js "http://d3js.org/d3.v3.min.js") (include-js "/js/nv.d3.min.js")] (map include-js extra-js) [(include-js "/js/script.js") (javascript-tag js)])])) - Let's also add some ClojureScript infrastructure. This function will abstract out the boilerplate to create NVD3 and D3 charts. We'll put this and the next few definitions into
src-cljs/webviz/core.cljs, as shown here:;;; A group of values. Each group has a key/label and ;;; a JS array of point values. (deftype Group [key values]) ;;; A point. Each point has a location (x, y) and a ;;; size. (deftype Point [x y size])
- We'll also define some functions to help build the chart:
(defn add-label [chart axis label] "This sets an axis' label if not nil." (when-not (nil? label) (.axisLabel (aget chart axis) label))) (defn add-axes-labels [chart x-label y-label] "Add axes' labels to the chart." (doto chart (add-label "xAxis" x-label) (add-label "yAxis" y-label))) (defn populate-node [selector chart groups transition continuation] "This builds the chart from the selector." (-> (.select js/d3 selector) (.datum groups) (.transition) (.duration (if transition 500 0)) (.call chart) (.call continuation))) - We'll also create some data structures to represent points and groups of points. This is how NVD3 wants the input data represented:
(defn create-chart
  [data-url selector make-chart json->groups &
   {:keys [transition continuation x-label y-label]
    :or {transition false, continuation (fn [_])
         x-label nil, y-label nil}}]
  "Create a chart with the data's URL, a selector, and
  functions to create the chart and transform the data."
  (.json
    js/d3 data-url
    (fn [error data]
      (when data
        (.addGraph
          js/nv
          (fn []
            (let [chart (make-chart)]
              (add-axes-labels chart x-label y-label)
              (populate-node selector chart
                             (json->groups data)
                             transition continuation)
              (.windowResize js/nv.utils
                             #(.update chart)))))))))
With these bits of infrastructure, we can create the plot, as follows:
- We'll define a handler for the page itself, in the
src/web_viz/web.cljfile, using thed3-pagefunction. This will embed the JavaScript to create the chart and create an SVG element to contain it:(defn scatter-charts [] (d3-page "Scatter Chart" "webviz.scatter.scatter_plot();" [:div#scatter.chart [:svg]])) - Next, we'll define the routes for it. You can add the highlighted routes to the current set, as follows:
(defroutes
  site-routes
  (GET "/scatter" [] (scatter-charts))
  (GET "/scatter/data.json" []
    (redirect "/data/census-race.json"))
  (route/resources "/")
  (route/not-found "Page not found"))
- Let's add a little style to the chart. Create
resources/css/style.cssand add this:div.chart { height: 450px; width: 650px; } body { font-family: Helvetica, Arial, sans-serif; font-size: smaller; } - Now, let's create a new file named
src-cljs/webviz/scatter.cljs. The namespace declaration for this is given as follows:(ns webviz.scatter (:require [webviz.core :as webviz]))
- We'll need to summarize the data in order to get the totals for the white and African-American populations by state. The following functions will take care of this:
(defn sum-by [key-fn coll] "This maps the values in a collection and sums the results." (reduce + 0 (map key-fn coll))) (defn sum-values [key-fn coll] "This takes a function and a map associating a label with a sequence of values. It replaces those values with their sums after passing them through the function." (reduce (fn [m [k vs]] (assoc m k (sum-by key-fn vs))) {} coll)) (defn sum-data-fields [json] "This generates by-state sums for different groups." (let [by-state (group-by #(.-state_name %) json) white-by-state (sum-values #(.-white %) by-state) afam-by-state (sum-values #(.-black %) by-state) total-by-state (sum-values #(.-total %) by-state)] (map #(hash-map :state % :white (white-by-state %) :black (afam-by-state %) :total (total-by-state %)) (keys by-state)))) - NVD3 expects the data to be in points and groups. We'll use the types we defined in
webviz.core. These functions will convert the summarized data into the objects that NVD3 expects, as shown here:(defn ->nv [item] (let [{:keys [white black]} item] (webviz/Point. (/ white 1000) (/ black 1000) 1))) (defn ->nv-data [key-name data] (->> data sum-data-fields (map ->nv) (apply array) (webviz/Group. key-name) (array))) - This function will actually create the chart and set the options and formatting for it:
(defn make-chart [] (let [c (-> (.scatterChart js/nv.models) (.showDistX true) (.showDistY true) (.useVoronoi false) (.color (.. js/d3 -scale category10 range)))] (.tickFormat (.-xAxis c) (.format js/d3 "d")) (.tickFormat (.-yAxis c) (.format js/d3 "d")) c)) - Actually, pulling all of this together is pretty simple:
(defn ^:export scatter-plot []
  (webviz/create-chart
    "/scatter/data.json"
    "#scatter svg"
    make-chart
    (partial ->nv-data "Racial Data")
    :x-label "Population, whites, by thousands"
    :y-label (str "Population, African-Americans, "
                  "by thousands")
    :transition true))
Now when we visit http://localhost:3000/scatter, we will get a good-looking chart, as shown in the following screenshot:
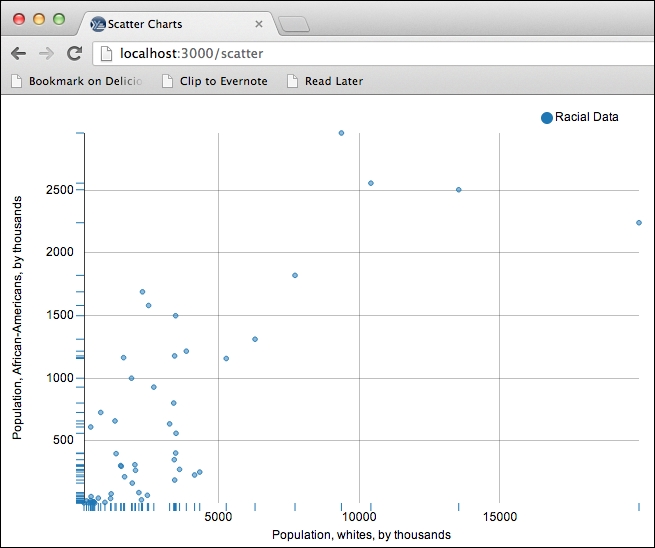
NVD3 expects the data to be in a specific format. We create an adapter function for the data and a function to create and configure the specific plot we want. With these functions, we call webviz/create-chart to actually populate the HTML elements and display the chart.
The create-chart function takes a URL to load the data, the path to select the element to create the chart in, a function to create the chart, and a function to convert the data into points and groups. The create-chart function uses these parameters to request the data, create the chart, and associate the data with it. Those steps are common to any chart built with NVD3, so abstracting them out will save us in the long run.
- The page for D3 is at http://d3js.org/. The gallery here is a good place to start looking, to take inspiration from, and to learn what the library is capable of.
- The page for NVD3 is http://nvd3.org/.
- An alternative to D3 and NVD3 is Kevin Lynagh's C2 (http://keminglabs.com/c2/). This allows a more declarative approach to creating HTML and SVG structures and to using Hiccup-style data structures in the browser.