
One of the great things about working on the Web is how easy it is to make things interactive. Also, since D3 exposes the underlying HTML elements— in fact, it often forces you to work in them—making a D3 graph interactive is pretty straightforward; we just use standard HTML events.
For this recipe, we'll take the force-directed layout visualization of the US census data that we did in the last recipe, Visualizing graphs with force-directed layout, and make it interactive. We'll add a data panel to the right-hand side of the graph, and whenever the user hovers over a node, the page will display the census data from that node in the data panel.
We'll start with the visualization from the last recipe, Visualizing graphs with force-directed layout, and add to it.
Even though we're adding to an existing graph, we'll do it on a new URL, so we'll also need to add a handler, route, and ClojureScript for it. To do this, perform the following steps:
- Here's the handler, which also includes the HTML for the data panel:
(defn interactive-force-plot [] (d3-page "Interactive Force-Directive Layout" (str "webviz" ".int_force" ".interactive_force_layout();") [:div [:div#force.chart [:svg]] [:div#datapane]])) - We'll use the following route:
(defroutes
  site-routes
  (GET "/int-force" [] (interactive-force-plot))
  (GET "/int-force/data.json" []
       (redirect "/data/clusters.json"))
  (route/resources "/")
  (route/not-found "Page not found"))
- We'll need extra styles for the data panel. Open up
resources/css/style.cssand add these lines:#datapane { float: right; width: 250px; } #datapane dt { font-weight: bold; } - Now, for this graph, let's open
src-cljs/webviz/int_force.cljsand add this namespace declaration:(ns webviz.int-force (:require [clojure.browser.dom :as dom] [webviz.force :as force] [goog.events :as gevents])) - In the data panel, for each census item, we'll add a DT/DD element combination. We'll encapsulate this into a function since we'll define a number of these:
(defn dl-item [title data key] (let [val2000 (aget data (str key "-2000"))] (str "<dt>" title "</dt>" "<dd>" (.round js/Math (aget data key)) " <em>(2000: " (.round js/Math val2000) ")</em>" "</dd>"))) - The most complicated function builds the HTML to populate the data panel, as shown here:
(defn update-data [node] (let [data (aget node "data") content (str "<h2>" (aget node "name") "</h2>" "<dl>" (dl-item "Total" data "race-total") (dl-item "White" data "race-white") (dl-item "African-American" data "race-black") (dl-item "Native American" data "race-indian") (dl-item "Asian" data "race-asian") (dl-item "Hawaiian" data "race-hawaiian") (dl-item "Other" data "race-other") (dl-item "Multi-racial" data "race-two-more") "</dl>")] (dom/remove-children :datapane) (dom/append (dom/get-element :datapane) (dom/html->dom content)))) - Our
mouseoverevent, which will get called whenever the user hovers over a node, pulls theCIRCLEelement out of the event, gets the index of the node from the element, and pulls the data item out of the graph:(defn on-mouseover [ev] (let [target (.-target ev)] (if (= (.-nodeName target) "circle") (let [n (+ (.getAttribute target "data-n"))] (update-data (aget (.-nodes @force/census-graph) n)))))) - Now, we create the chart using the
force-layoutfunction from the last recipe and then we add an event handler to the chart's parent:(defn ^:export interactive-force-layout [] (force/force-layout) (gevents/listen (dom/get-element "force") (.-MOUSEOVER gevents/EventType) on-mouseover))
When we visit http://localhost:3000/int-force and hover over one of the circles, we will get the following screenshot:
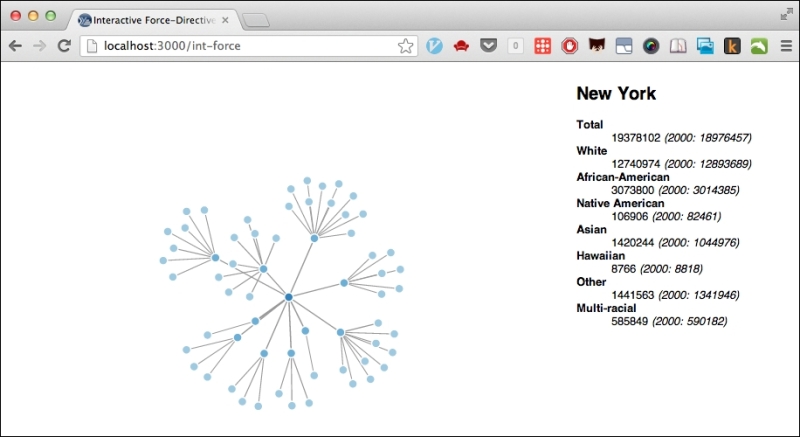
This recipe works in the same way as an interaction works on any web page. We listen to events that the user generates on certain HTML tags. In this case, we pay attention to whenever the mouse moves over a node on the graph. We bind our event handler to this event in step 7.
When the event is triggered, the event handler is called. In our example, the event handler function, on-mouseover, is defined in step 6.
The event handler retrieves the data for the node that the user moved their mouse cursor over, and it calls update-data and dl-item to build the HTML structure in order to display data about this node.
We've mentioned before that the Google Closure library comes with ClojureScript. In this recipe, we use its events module (http://docs.closure-library.googlecode.com/git/namespace_goog_events.html) to bind on-mouseover to the appropriate event.
We also use the ClojureScript clojure.browser.dom namespace to delete and create HTML elements on the fly. This namespace is a thin, Clojure-friendly wrapper around the Closure library for manipulating the DOM, goog.dom (http://docs.closure-library.googlecode.com/git/namespace_goog_dom.html).
Finally, we also interface a few times with JavaScript itself. We do this by prefixing the name of the JavaScript object or module with js, js/Math, for example.
- Google's Closure library is bundled with ClojureScript and provides a lot of functionality to manipulate the DOM and other common tasks for writing in-browser web apps. You can learn more about this library at https://developers.google.com/closure/library/.
- The standard ClojureScript namespace,
clojure.browser.dom, provides a Clojure-like wrapper over some of the Closure library's DOM manipulation functionality. You can see what's in this library by browsing it at https://github.com/clojure/clojurescript/blob/master/src/cljs/clojure/browser/dom.cljs. - A good resource to work with HTML, CSS, and JavaScript is the Mozilla Developer Network. You can find it at https://developer.mozilla.org/.