In the upcoming chapters, many recipes will feature Incanter. One of its good features is that it uses the Parallel Colt Java library (http://sourceforge.net/projects/parallelcolt/) to actually handle its processing. So when you use a lot of matrix, statistical, or other functions, they're automatically executed on multiple threads.
For this, we'll revisit the Virginia housing-unit census data from the Managing program complexity with STM recipe in Chapter 3, Managing Complexity with Concurrent Programming. This time, we'll fit it to a linear regression.
We need to add Incanter to our list of dependencies in our Leiningen project.clj file:
(defproject parallel-data "0.1.0"
  :dependencies [[org.clojure/clojure "1.6.0"]
                 [incanter "1.5.5"]])
We also need to pull these libraries into our REPL or script:
(use '(incanter core datasets io optimize charts stats))
We'll use the data file from the Managing program complexity with STM recipe in Chapter 3, Managing Complexity with Concurrent Programming. We can bind that filename to the name data-file, just as we did in that recipe:
(def data-file "data/all_160_in_51.P35.csv")
For this recipe, we'll extract the data to be analyzed and perform a linear regression. We'll then graph the data.
- First, we'll read in the data and pull the population and housing-unit columns into their own matrices:
(def data (to-matrix (sel (read-dataset data-file :header true) :cols [:POP100 :HU100]))) - From this matrix, we can bind the population and the housing-unit data to their own names:
(def population (sel data :cols 0))
(def housing-units (sel data :cols 1))
- Now that we have these, we can use Incanter to fit the data:
(def lm (linear-model housing-units population))
- We'll talk more about graphing and plotting in a later chapter, but Incanter makes it so easy that it's difficult not to look at it:
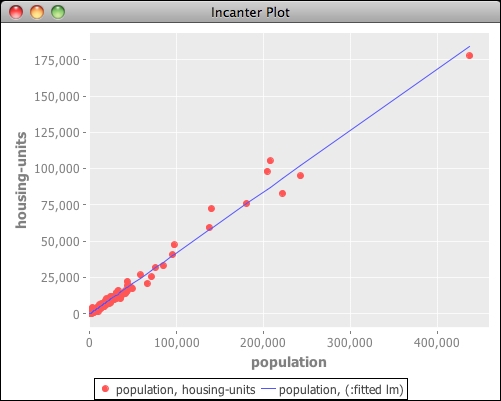
(def plot (scatter-plot population housing-units
            :legend true))
(add-lines plot population (:fitted lm))
(view plot)
Here, you can see that the graph of housing units to families is a straight line: