
Benford's law is a curious observation about the distribution of the first digits of numbers in many naturally occurring datasets. In sequences that conform to Benford's law, the first digit will be 1 about a third of the time, and higher digits will occur progressively less often. However, manually constructed data rarely looks like this. Because of that, lack of a Benford's Law distribution is evidence that a dataset is not manually constructed.
For example, this has been shown to hold true in financial data, and investigators leverage this for fraud detection. The US Internal Revenue Service reportedly uses it for identifying potential tax fraud, and financial auditors also use it.
We'll need these dependencies:
(defproject statim "0.1.0"
  :dependencies [[org.clojure/clojure "1.6.0"]
                 [incanter "1.5.5"]])
We'll also use these requirements:
(require
  '[incanter.core :as i]
  'incanter.io
  '[incanter.stats :as s])
For data, we'll use the Virginia census race data file that we can download from http://www.ericrochester.com/clj-data-analysis/data/all_160_in_51.P35.csv.
Bendford's law has been observed in many other places, including population numbers. In this recipe, we'll look at using it on the Virginia census data:
- First, of course, we'll load the data:
(def data-file "data/all_160_in_51.P35.csv")
(def data (incanter.io/read-dataset data-file :header true))
- Now we perform the analysis using the function
incanter.stats/benford-test. It returns a map containing some interesting tests and values for determining whether the collection conforms to Benford's test. We can also use it to view a bar chart of the distribution:(def bt (s/benford-test (i/sel data :cols :POP100)))
- In the map that's returned, :
X-sqis the value for the Χ² test,:dfis the degrees of freedom for the test, and:p-valueis the p value for the test statistic:user=> (:X-sq bt) 15.74894048668777 user=> (:df bt) 8 user=> (:p-value bt) 0.046117795289705776
- A histogram can help us visualize the distribution of the digits:
(def chart
  (let [digits (map inc (:row-levels bt))
        frequency (:table bt)]
    (doto (c/bar-chart digits frequency)
       (i/view))))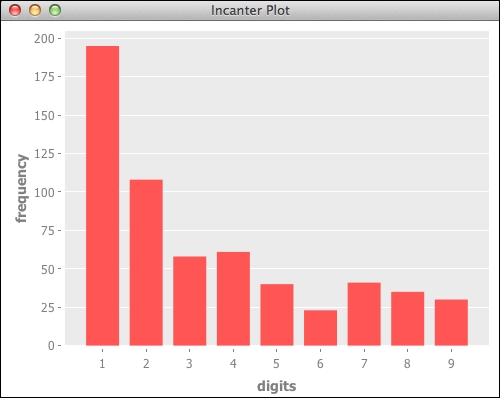
So the graphed distribution appears to naturally follow Benford's law.
Benford's law states that the initial digits in a naturally occurring dataset should display a logarithmic probability.
The function benford-test calculates the frequencies of the initial digits from the input and performs a Χ² test, based upon the frequencies expected by Benford's law.
For more about Benford's law, see the Wikipedia article at http://en.wikipedia.org/wiki/Benford%27s_law or the article on Wolfram MathWorld at http://mathworld.wolfram.com/BenfordsLaw.html
Finally, Testing Benford's Law (http://testingbenfordslaw.com/) is a fun site that applies Benford's law to various large, publicly available datasets.