In the previous chapter, we introduced you to Azure and the types of platforms, tools, and resources that Azure provides to facilitate the creation of data warehouse solutions.
In this chapter, we will focus on the new unified experience in the Azure Synapse Analytics workspace and Synapse Studio. We will cover the following topics:
- Azure Synapse Analytics and why we need it
- Deep dive into Azure Synapse Analytics
- Introduction to the Azure Synapse Analytics workspace and a step-by-step quick start guide
- Introduction to Synapse Studio
- Two ways of launching Synapse Studio
- Provisioning an SQL pool, ingesting data, and analyzing the data in the SQL pool
- Creating an Apache Spark pool, ingesting data, and exploring data using Spark
- Copying data to/from SQL pools and Spark pools
- Linked data sources
- Analyzing data using serverless SQL pools
- Integrating with pipelines
What is Azure Synapse Analytics?
Azure Synapse Analytics is a limitless analytics service that brings together enterprise data warehousing and big data analytics with a unified experience to ingest, prepare, manage, and serve data for immediate business intelligence and machine learning needs. In a nutshell, Azure Synapse Analytics is the next evolution of Azure SQL Data Warehouse. Microsoft has taken the industry-leading data warehouse to a new level of performance and capability.
Azure Synapse Analytics gives you the freedom to choose whether to use dedicated or serverless resources to explore and analyze your data at scale based on your business requirements. Businesses can put their data to work much more quickly, productively, and securely, pulling together insights from many data sources, data warehouses, and big data analytics systems.
With Azure Synapse Analytics, data professionals of all types can collaborate, manage, and analyze their most important data efficiently—all within the same service. From Apache Spark integration to the powerful and trusted SQL engine, to code-free data integration and management, Azure Synapse Analytics is built for every data professional.
Furthermore, enabling BI and machine learning through Azure Synapse Analytics is a snap. Azure Synapse Analytics deeply integrates with Power BI and Azure Machine Learning to greatly expand the discovery of insights from all your data and enable practitioners to easily apply machine learning models to intelligent apps without any data movement. This significantly reduces development time for BI and machine learning projects. With Azure Synapse Analytics, you can seamlessly apply intelligence over all your most important data—from Dynamics 365 and Office 365 to Software as a Service (SaaS) services that support the Open Data Initiative (https://www.microsoft.com/en-us/open-data-initiative)—and then easily share data (https://azure.microsoft.com/services/data-share/) with just a few clicks.
In the next section, we will explain why we need Azure Synapse Analytics and the business challenges that it resolves.
Why do we need Azure Synapse Analytics?
One of the many challenges that businesses face today is the need to manage two types of analytics systems:
- Data warehouse, which provides critical insights about the business
- Data lakes, which provide meaningful insights about customers, products, employees, and processes through various analytics methodologies
Both of these analytics systems are critical to businesses and operate independently of one another. This can lead to uninformed decisions. At the same time, businesses need to unlock insights from all their data to stay competitive and to innovate processes to obtain better results.
For customers wanting to build their own end-to-end data pipeline, they must go through the following steps:
- Ingest data from various data sources.
- Load all these data sources into a data lake for further processing.
- Perform data cleaning over a range of different data structures and types.
- Prepare, transform, and model the data.
- Serve the cleansed data to thousands of users through BI tools and applications.
Until now, each of these steps has required a different tool, and with so many different tools, services, and applications on offer, choosing the right one can be daunting.
There are numerous services that ingest, load, prepare, and serve data. There are also multiple services to use for data cleaning, based on the developer's language of choice. Some developers prefer to use Spark, and some want to use SQL, while others want code-free environments to transform the data.
Even once the right collection of tools has been chosen, there is a steep learning curve to get to grips with them, as well as the logistical difficulties of maintaining a data pipeline over different platforms and languages. With such a range of issues, implementing and maintaining a cloud analytics platform can be a difficult task.
Customer challenges
You might think that the biggest challenge for an efficient data warehouse is learning how to build the pipeline to bring the data in or optimizing the warehouse to get better performance. However, in a customer study conducted by Microsoft, it was concluded that the biggest customer challenge was managing different capabilities, monitoring hundreds of pipelines spanning across various compute engines, securing different resources (compute, storage, artifacts), and deploying code without breaking changes. Between organizational silos, data silos, and tooling silos, it becomes nearly impossible to implement and maintain a cloud analytics platform.
For example, imagine your company needed to come up with a single security model to protect all of its services to meet the latest internal compliance guidelines. A task like this might at first sound straightforward but, in fact, it is quite involved. You need to quickly identify what that "single security model" is, and then figure out what the deployment model is across your services. You need to work out how to implement high availability and disaster recovery for each of these services. And finally, you need to look after all the related lifecycle management responsibilities, including monitoring these services to ensure that are performing well. Bringing all these services together is no small endeavor, and in the past has required complex planning.
Azure Synapse Analytics to the rescue
Azure Synapse Analytics solves the aforementioned problems. As shown in Figure 2.1, Azure Synapse Analytics allows customers to build end-to-end analytics solutions and perform data ingestion, data exploration, data warehousing, big data analytics, and machine learning tasks from a single, unified environment:
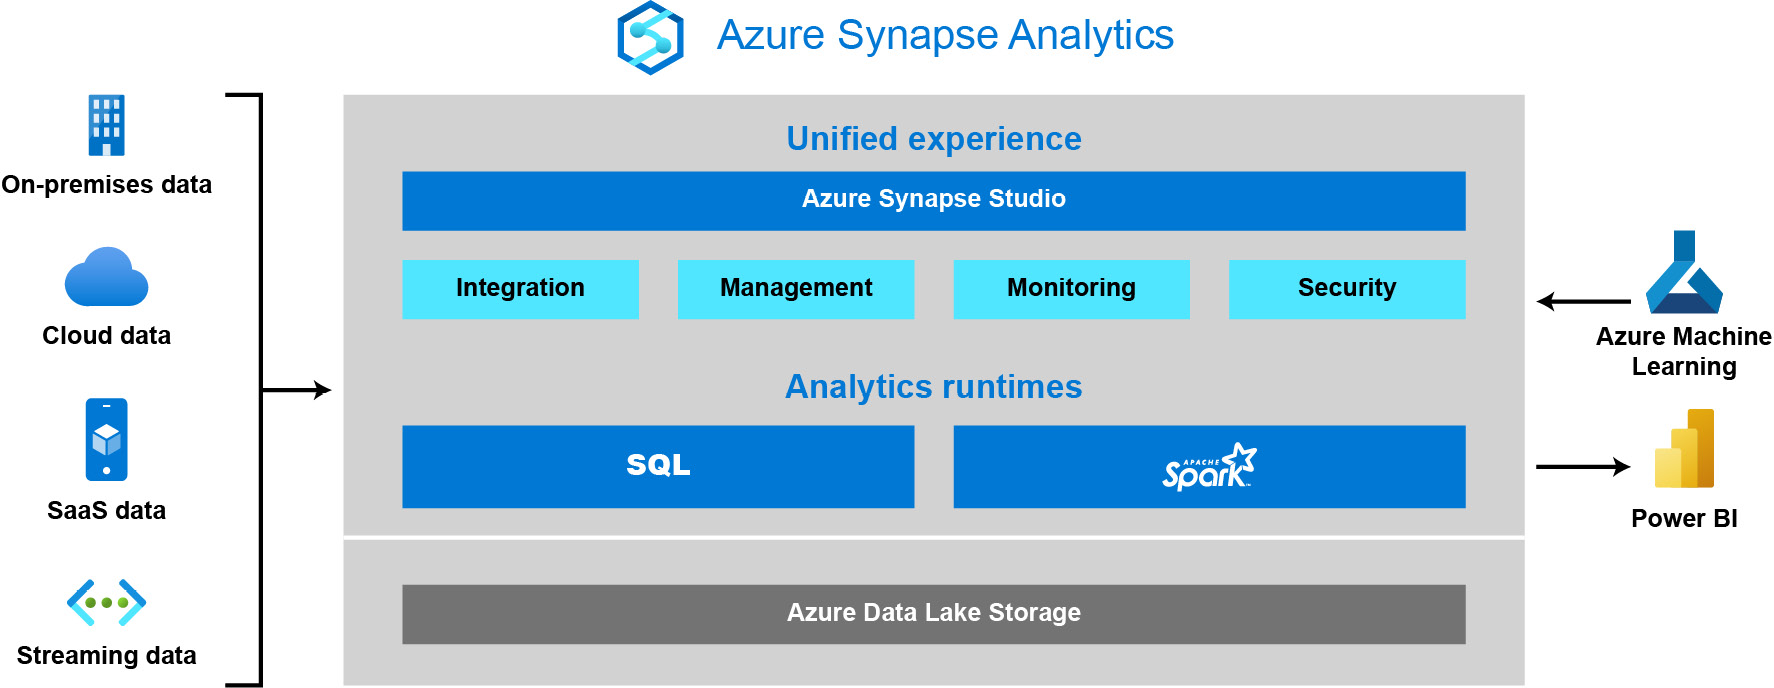
Figure 2.1: Azure Synapse Analytics
Some of the core features offered by Azure Synapse Analytics are listed in Table 2.1:
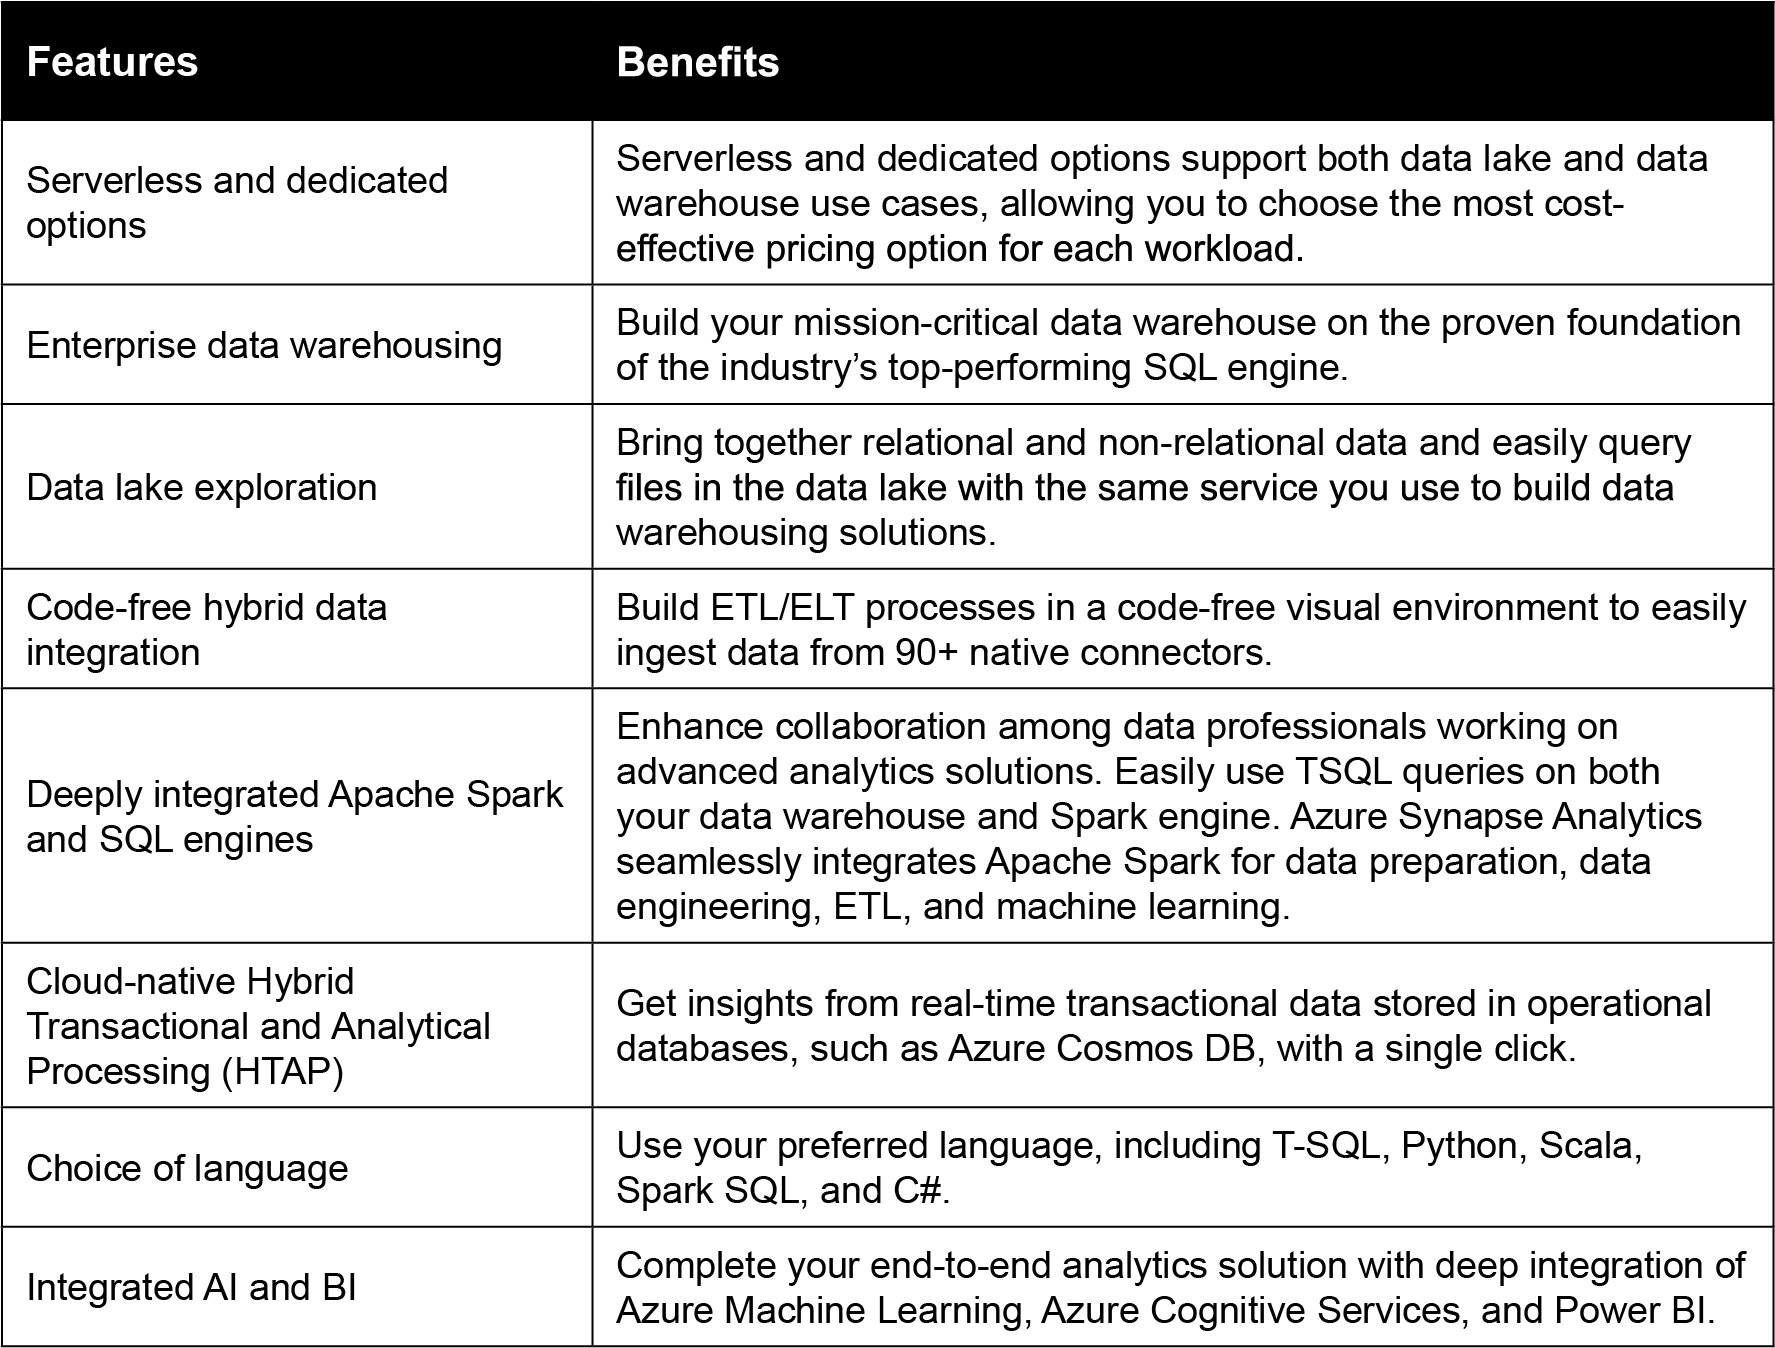
Table 2.1: Features and benefits of Azure Synapse Analytics
Azure Synapse Analytics can derive and deliver insights from all the data lying in your data warehouse and big data analytics systems at lightning-fast speeds. It enables data professionals to use familiar SQL language to query both relational and non-relational databases at petabyte scale. Advanced features such as intelligent workload management, workload isolation, and limitless concurrency help optimize the performance of all queries for mission-critical workloads.
Azure Synapse Analytics takes the best of Azure SQL Data Warehouse and modernizes it by providing more functionalities for the SQL developers, adding querying with serverless SQL pool, adding machine learning support, embedding Apache Spark natively, providing collaborative notebooks, and offering data integration within a single service. It supports different languages (such as C#, SQL, Scala, and Python), all through different engines.
By using Azure Synapse Analytics, customers can carry out business intelligence projects and machine learning with ease. Azure Synapse Analytics is deeply integrated with Power BI and Azure Machine Learning to greatly expand the discovery of insights from all your data and apply machine learning models to all your intelligent apps. The user can significantly reduce project development time for BI and machine learning projects with a limitless analytics service that enables you to seamlessly apply intelligence over all your most important data—from Dynamics 365 and Office 365 to SaaS implementations that support Open Data Initiative (https://www.microsoft.com/en-us/open-data-initiative)—and easily share data (https://azure.microsoft.com/services/data-share/) with just a few clicks.
This is all provided in a single experience that features query editors and notebooks for sharing and collaborating data, as well as assets and code for both SQL and Spark developers.
Essentially, Azure Synapse Analytics does it all.
Deep dive into Azure Synapse Analytics
Now that you understand why Azure Synapse Analytics was invented, we will take a deeper look at the services offered by Azure Synapse Analytics.
Azure Synapse Analytics is a fully managed, integrated data analytics service that blends data warehousing, data integration, and big data processing with accelerating time to insight into a single service.
The advantage of having a single integrated data service is that, for enterprises, it accelerates the delivery of BI, AI, machine learning, Internet of Things, and intelligent applications.
Figure 2.2 illustrates how a modern data pipeline can be built using Azure Synapse Analytics. In this example, the ingestion process starts from a blob storage source through to Azure Data Lake Storage Gen2 in the Azure Synapse Analytics workspace. Using a Spark pool, you can read from multiple data sources via Azure Data Lake Storage Gen2 and Azure SQL Database and perform any transformations and data cleansing needed. Finally, the curated results are written in the SQL pool, which can then be used to serve BI tools and applications:
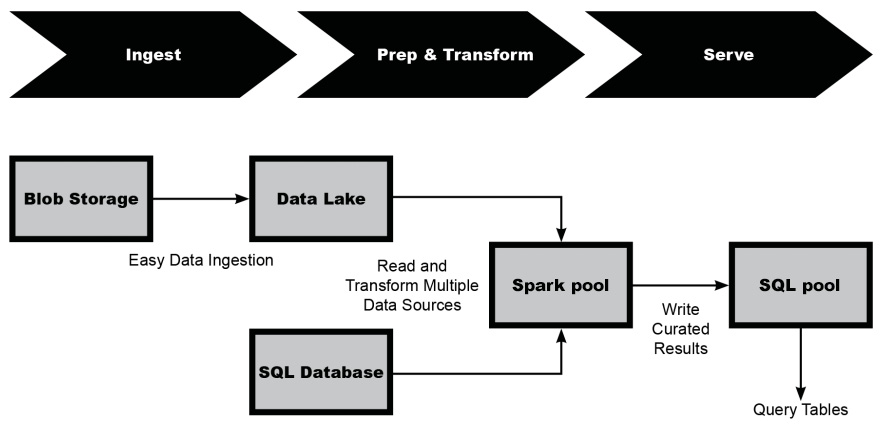
Figure 2.2: Modern data pipeline using Azure Synapse Analytics
To fully appreciate the benefits of Azure Synapse Analytics, we will take you on a tour of the Azure Synapse Analytics workspace and introduce you to the core services that are inside Synapse Studio.
Introducing the Azure Synapse Analytics workspace
At the heart of Azure Synapse Analytics is its workspace. A workspace is the top-level resource and comprises your analytics solution in the data warehouse. The Azure Synapse Analytics workspace can be used in a collaborative environment and supports both relational and big data processing. In essence, the Azure Synapse Analytics workspace is the fuel that jumpstarts your entire Azure Synapse Analytics experience.
In the next section, we have provided you with a quick start guide on how to provision your first Azure Synapse Analytics workspace. Feel free to follow along.
Free Azure account
If you'd like to try out any of the techniques shown in this book, simply create your free Azure account at https://azure.microsoft.com/free/synapse-analytics/ and get started.
Quickstart guide
- In a web browser, sign in to the Azure portal via https://portal.azure.com/.
- In the search box, type in synapse. Then, from the search results, select Azure Synapse Analytics under Services:

Figure 2.3: Navigating to Azure Synapse Analytics through the Azure portal
Click Add to create a new Azure Synapse Analytics workspace as shown in Figure 2.4:

Figure 2.4: Creating a new Azure Synapse Analytics workspace
- In the Basics tab, create a new resource group and provide a unique name for the workspace as shown in Figure 2.5. In our example, we will name our resource group my-synapse-rg and our workspace mysynws001. We have also picked East US as our region:
Note
If you see a message stating The Synapse resource provider needs to be registered to this subscription, under Subscription on the Create Synapse workspace page, simply click the link to register as instructed:

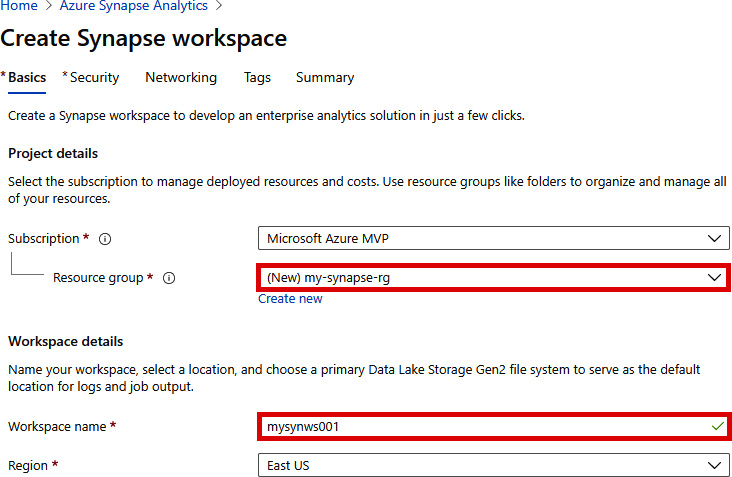
Figure 2.5: Creating a Synapse workspace
- Next, you need an Azure Data Lake Storage Gen2 (mydatalakestorageg2) account to create an Azure Synapse Analytics workspace. In this quickstart guide, we will create a new mydatalakestorageg2 account as shown in Figure 2.6:
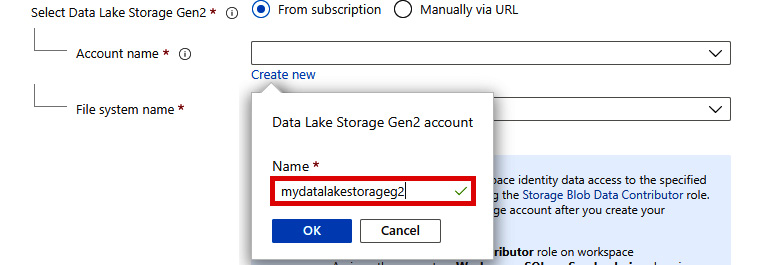
Figure 2.6: Creating a new Azure Data Lake Storage Gen2 account
- For File system name, click Create new and give it a name as shown in Figure 2.7. In our example, we will name it users:

Figure 2.7: Providing a file system name
- The completed form should resemble Figure 2.8. Be sure to check the Assign myself the Storage Blob Contributor role on the Data Lake Storage Gen2 account checkbox. Click Next: Security > to continue:
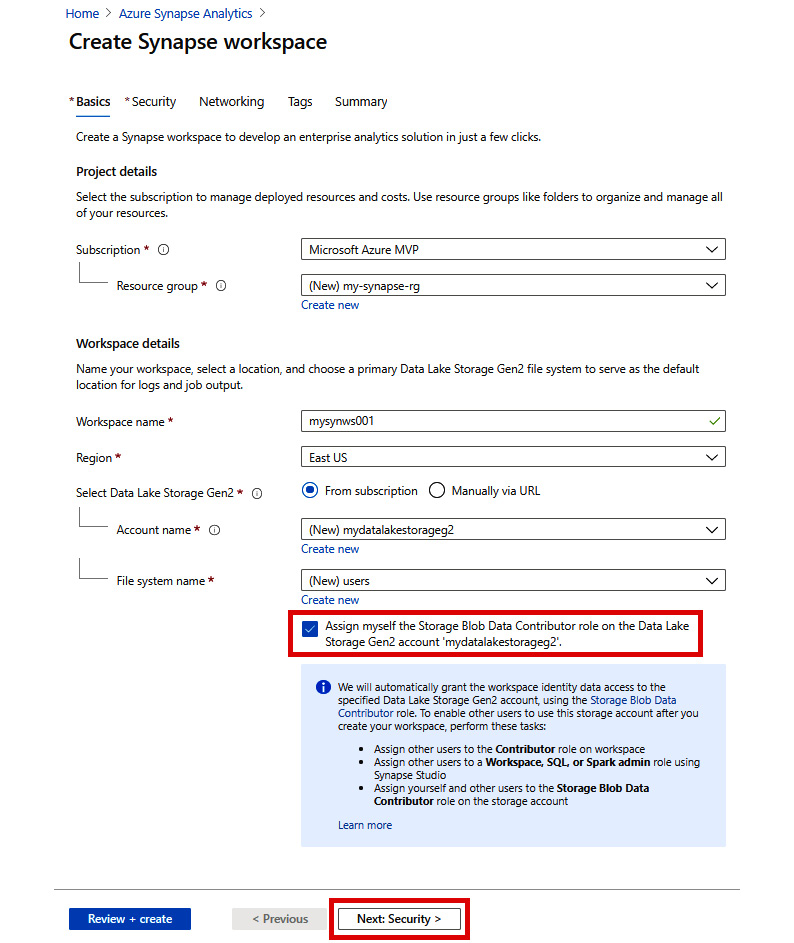
Figure 2.8: Create Synapse workspace - Basics tab
- In the Security tab, you may optionally provide credentials that can be used for administrator access to the workspace's SQL pools. If you don't provide a password, one will be automatically generated. You can change the password later. For now, let's accept the default and click Next: Networking >:
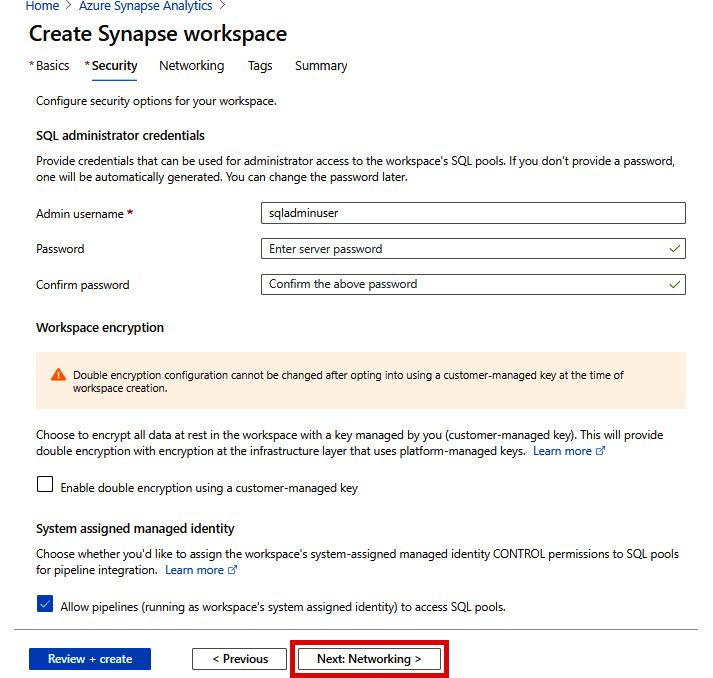
Figure 2.9: Create Synapse workspace - Security tab
- In the Networking tab, accept the default and click Review + create:

Figure 2.10: Create Synapse workspace - Networking tab
- In the Summary tab, do a final review of your configurations then click Create:
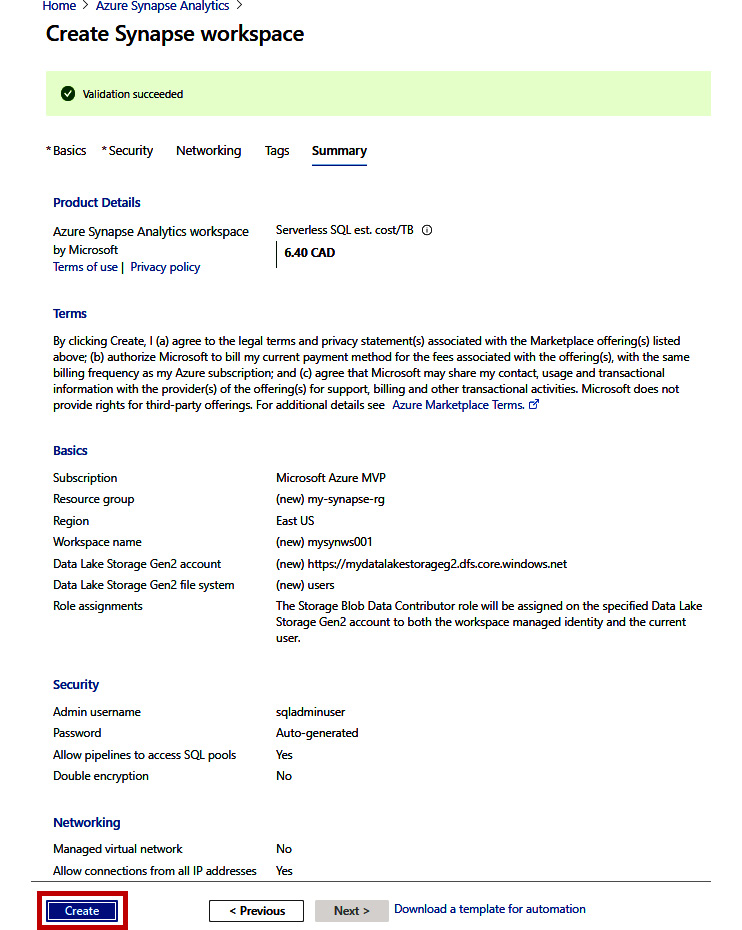
Figure 2.11: The Summary tab
In just a matter of minutes, your new Azure Synapse Analytics workspace will be ready.
In this section, we have shown you how you can get started with Azure Synapse Analytics by creating your Azure Synapse Analytics workspace. Next, we will continue our tour by visiting Synapse Studio.
Introducing Synapse Studio
Synapse Studio features a user-friendly, web-based interface that provides an integrated workspace and development experience. This allows data engineers to build end-to-end analytics solutions (ingest, explore, prepare, orchestrate, visualize) by performing everything they need within a single environment. Furthermore, data engineers can write and debug code in SQL or Spark. Synapse Studio also integrates with enterprise CI/CD processes. Synapse Studio is an ideal environment for data engineers and data scientists to share and collaborate on their analytics solutions.
To continue our tour, we will use the Azure Synapse Analytics workspace that we created in the previous section to launch Synapse Studio.
Launching Synapse Studio
With the Azure Synapse Analytics workspace you created in the previous section, we are now ready to make full use of it in Synapse Studio. Launching Synapse Studio can be done in two ways:
Method 1: Launching Synapse Studio via the Azure portal
- In the Azure portal, go to the resource group that contains your Azure Synapse Analytics workspace. In our example, our resource group is my-synapse-rg and our Azure Synapse Analytics workspace is mysynws001.
- Click the Azure Synapse Analytics workspace as shown:

Figure 2.12: The my-synapse-rg resource group
- From your Azure Synapse Analytics workspace, click Open to launch Synapse Studio:

Figure 2.13: Launching the Synapse Studio
At this point, Synapse Studio will be launched (see Figure 2.13).
Method 2: Launching Synapse Studio via its URL
You can also launch Synapse Studio via https://web.azuresynapse.net/, then sign into your Azure Synapse Analytics workspace as shown in Figure 2.14:

Figure 2.14: Selecting your Azure Synapse Analytics workspace to continue
The Synapse Studio home page is shown in Figure 2.15:
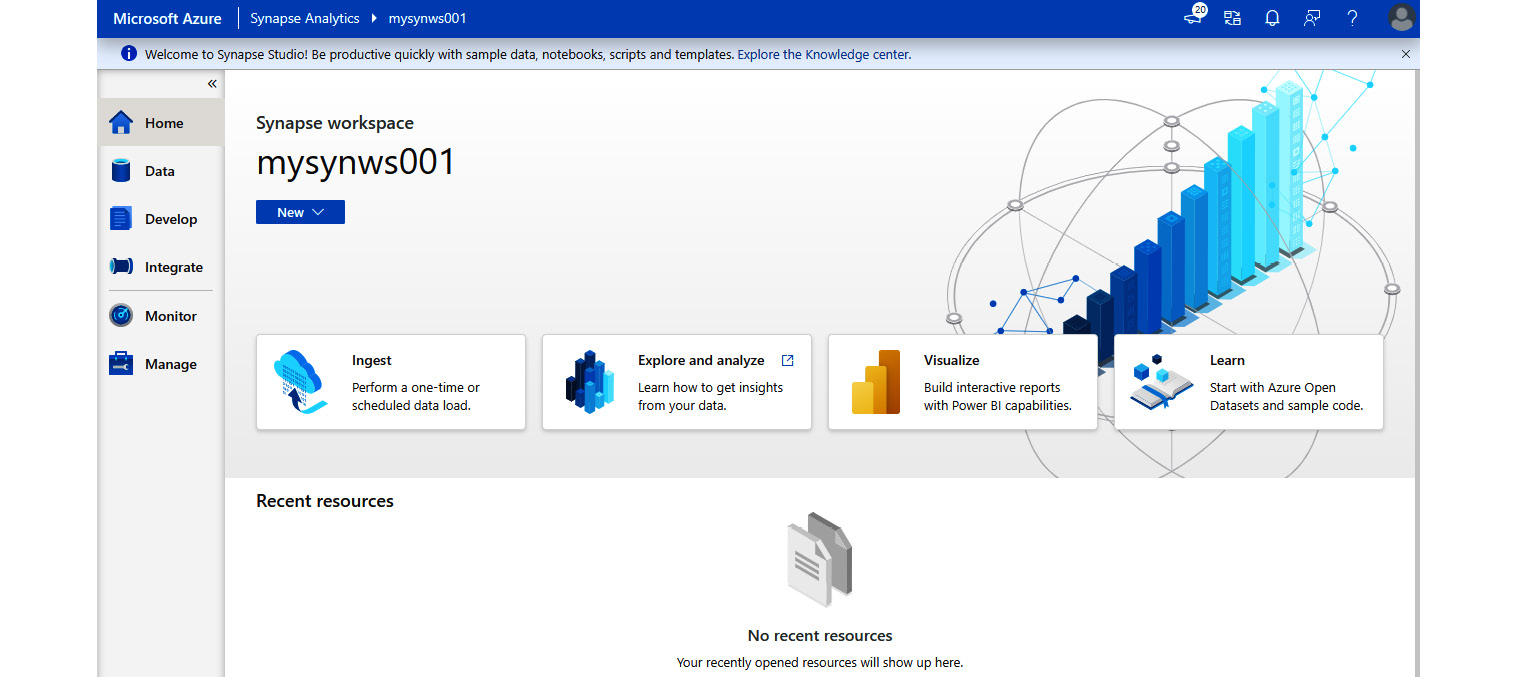
Figure 2.15: Synapse Studio home page
In the next sections, we will show you how easy it is to provision a dedicated SQL pool, ingest data, and start exploring the data in the SQL pool.
Provisioning a dedicated SQL pool
In this section, we will show you how you can provision a dedicated SQL pool in our newly created Azure Synapse Analytics workspace through Synapse Studio:
- In Synapse Studio, select the Manage hub on the left-hand pane, then SQL pools, and then click + New:
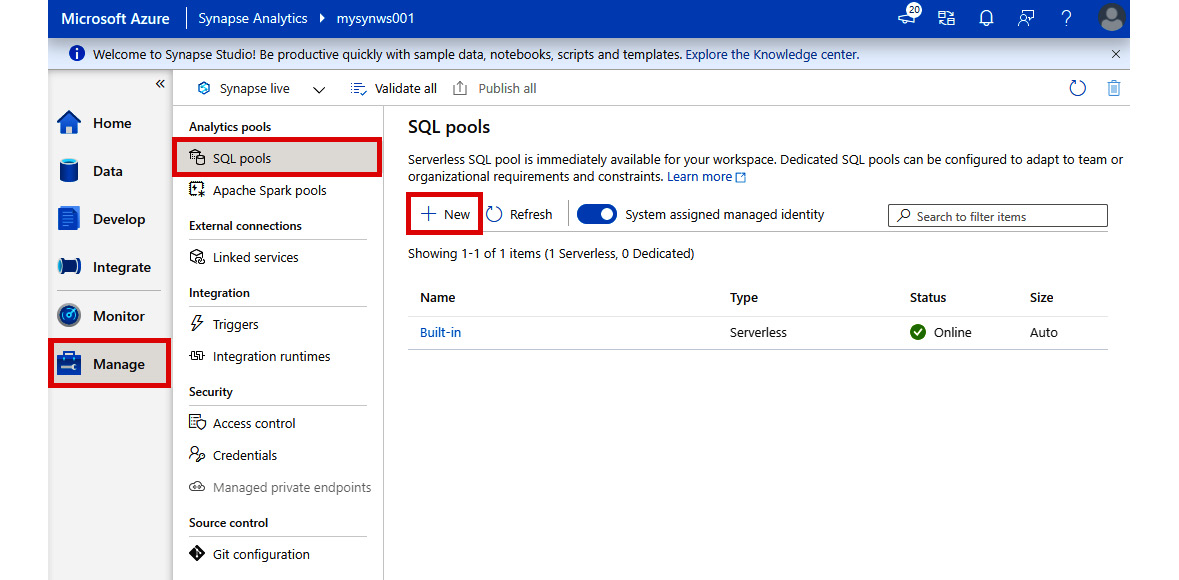
Figure 2.16: Creating a new SQL pool
- Enter the SQL pool details as shown. Then, click Review + create:
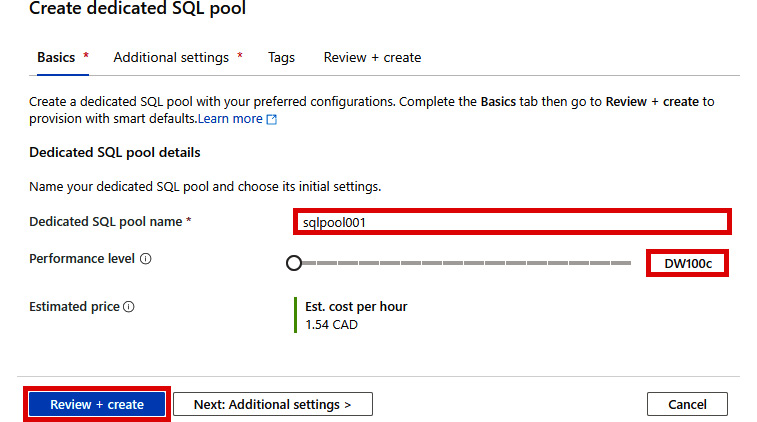
Figure 2.17: Create dedicated SQL pool - Basics tab
- In the Review + create tab, click Create.
In just a matter of minutes, your new dedicated SQL pool will be ready for use. In our example, our dedicated SQL pool is associated with an SQL pool database that is also named sqlpool001.
Tip
An SQL pool, as long as it remains active, will consume billable resources. To minimize costs, you can pause the pool when you are not using it.
Next, we will ingest the NYC Taxi data into our dedicated SQL pool and explore its capabilities.
- In Synapse Studio, select the Develop hub on the left-hand pane, then + and SQL script:

Figure 2.18: Developing a new SQL script
- Connect to sqlpool001 as shown:

Figure 2.19: Connecting to sqlpool001
- In the SQL script pane, enter the full SQL script (as shown in Figure 2.20), then click Run:
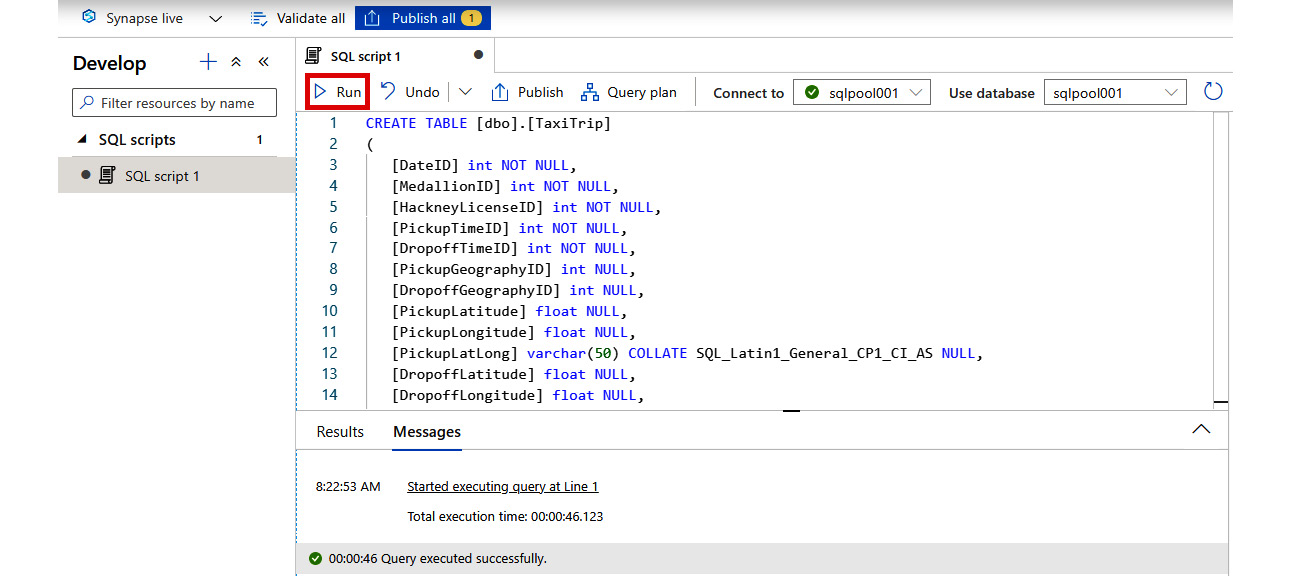
Figure 2.20: Executing the SQL script
The following SQL script creates a table named dbo.TaxiTrip in our dedicated SQL pool and ingests more than 2.8 million rows of the NYC Taxi data into the dbo.TaxiTrip table:
CREATE TABLE [dbo].[TaxiTrip]
(
[DateID] int NOT NULL,
[MedallionID] int NOT NULL,
[HackneyLicenseID] int NOT NULL,
[PickupTimeID] int NOT NULL,
[DropoffTimeID] int NOT NULL,
[PickupGeographyID] int NULL,
[DropoffGeographyID] int NULL,
[PickupLatitude] float NULL,
[PickupLongitude] float NULL,
[PickupLatLong] varchar(50) COLLATE SQL_Latin1_General_CP1_CI_AS NULL,
[DropoffLatitude] float NULL,
[DropoffLongitude] float NULL,
[DropoffLatLong] varchar(50) COLLATE SQL_Latin1_General_CP1_CI_AS NULL,
[PassengerCount] int NULL,
[TripDurationSeconds] int NULL,
[TripDistanceMiles] float NULL,
[PaymentType] varchar(50) COLLATE SQL_Latin1_General_CP1_CI_AS NULL,
[FareAmount] money NULL,
[SurchargeAmount] money NULL,
[TaxAmount] money NULL,
[TipAmount] money NULL,
[TollsAmount] money NULL,
[TotalAmount] money NULL
)
WITH
(
DISTRIBUTION = ROUND_ROBIN,
CLUSTERED COLUMNSTORE INDEX
);
COPY INTO [dbo].[TaxiTrip]
FROM 'https://nytaxiblob.blob.core.windows.net/2013/Trip2013/QID6392_20171107_05910_0.txt.gz'
WITH
(
FILE_TYPE = 'CSV',
FIELDTERMINATOR = '|',
FIELDQUOTE = '',
ROWTERMINATOR='0X0A',
COMPRESSION = 'GZIP'
)
OPTION (LABEL = 'COPY: Load taxi dataset');
In this SQL script, we use the flexible COPY statement to bulk load data from an Azure Blob Storage source location into our dedicated SQL pool.
Now that we have our data ingested into our dedicated SQL pool, let's explore the data.
Exploring data in the dedicated SQL pool
Follow the steps below for exploring the data in the dedicated SQL pool:
- In Synapse Studio, select the Data hub on the left-hand pane.
- Select sqlpool001 (SQL), then expand Tables.
- Right-click on the dbo.TaxiTrip table.
- Select New SQL script | Select TOP 100 rows:
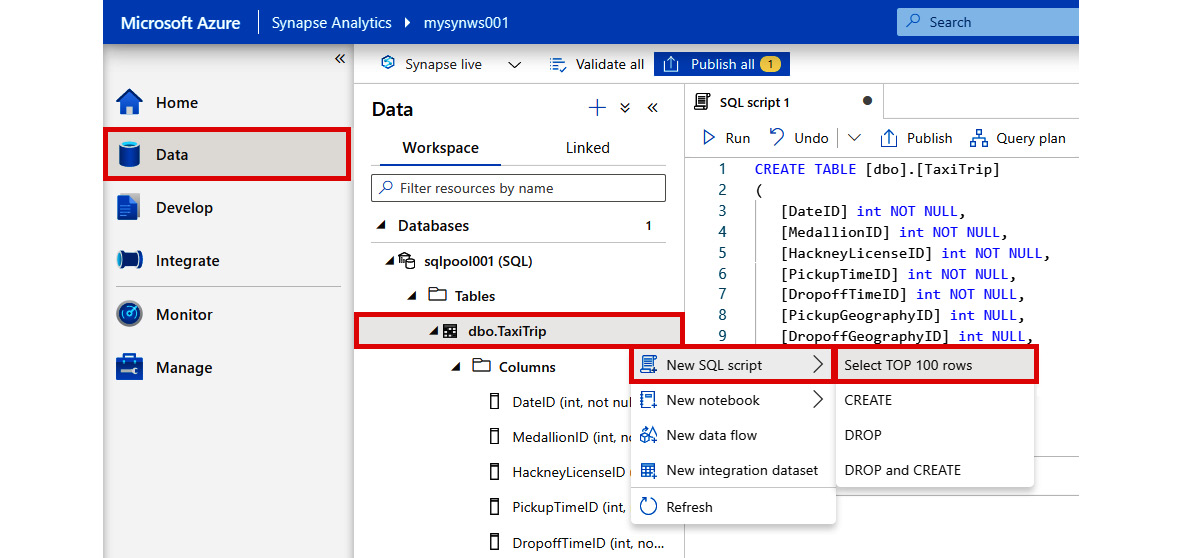
Figure 2.21: Generating a new SQL script
- You will see the output shown in Figure 2.22:

Figure 2.22: Query result
- Try replacing the query with the following and run it. This query shows how the number of passengers relates to the total trip distance and average trip distance:
SELECT PassengerCount,
SUM(TripDistanceMiles) as TotalTripDistance,
AVG(TripDistanceMiles) as AverageTripDistance
FROM dbo.TaxiTrip
WHERE PassengerCount > 0 AND TripDistanceMiles > 0
GROUP BY PassengerCount
ORDER BY PassengerCount

Figure 2.23: Query result
- You can quickly change the view to Chart to see a visualization of the results as a line chart:
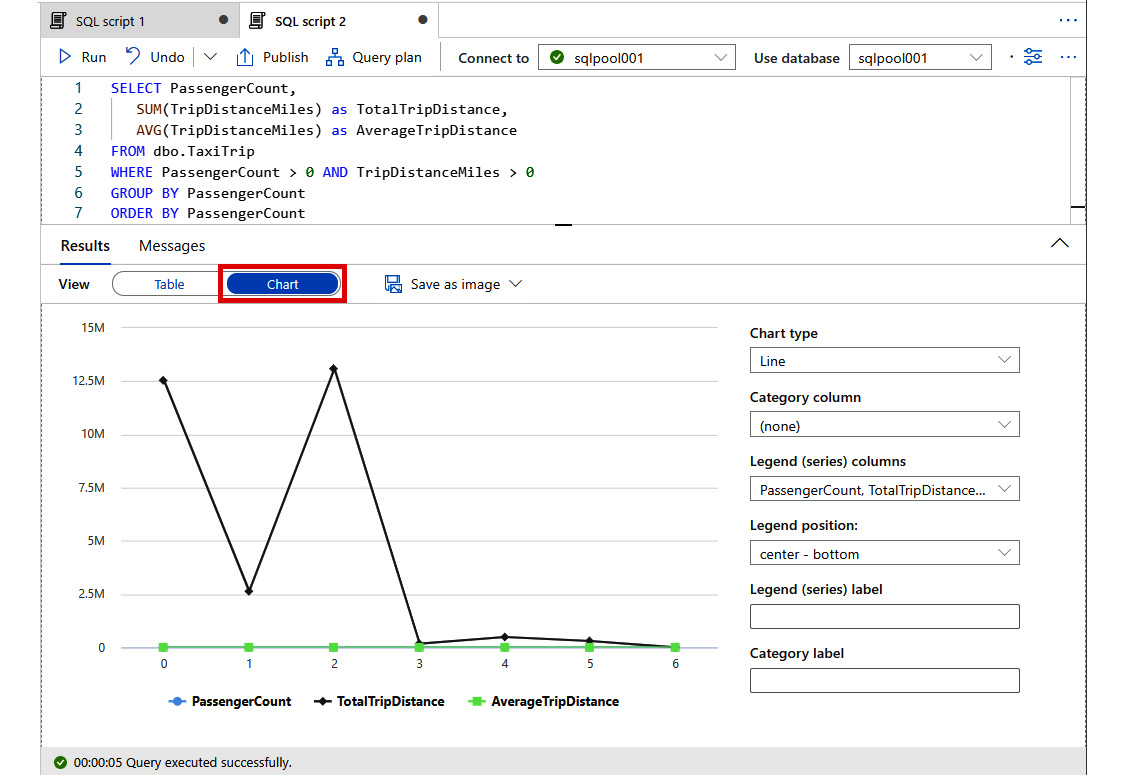
Figure 2.24: Line chart visualization
Now that we have shown you how easy it is to provision a dedicated SQL pool, ingest data, and explore the data, we will turn our attention to another key capability of Azure Synapse Analytics: the Apache Spark pool.
In the next sections, we will show you how to create an Apache Spark pool in Azure Synapse Analytics, load the NYC Taxi data into the Spark database, and analyze the NYC Taxi data using Spark and notebooks.
Creating an Apache Spark pool
Next, we will create a serverless Apache Spark pool:
- In Synapse Studio, select the Manage hub on the left-hand pane, then click Apache Spark pools under Analytics pools, and click + New:
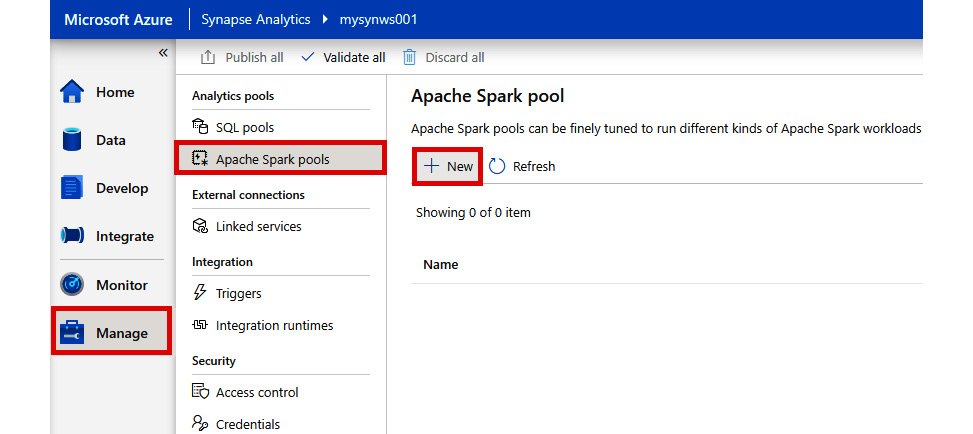
Figure 2.25: Creating a new Apache Spark pool
- Enter the Apache Spark pool details as shown. Then, click Review + create:
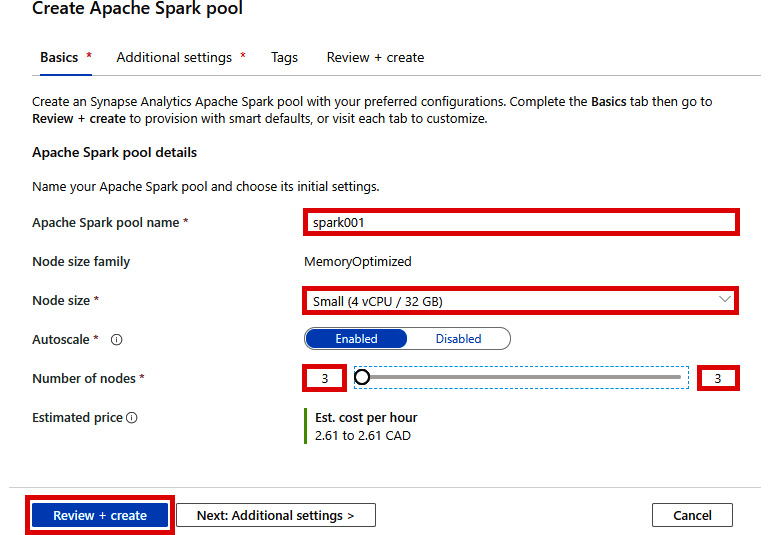
Figure 2.26: Create Apache Spark pool - Basics tab
- Under the Review + create tab, click on Create.
In just a matter of minutes, your new Apache Spark pool will be ready. We will look at linked data sources next.
Linked data sources
- In Synapse Studio, select the Data hub on the left-hand pane, then click + and Browse gallery:
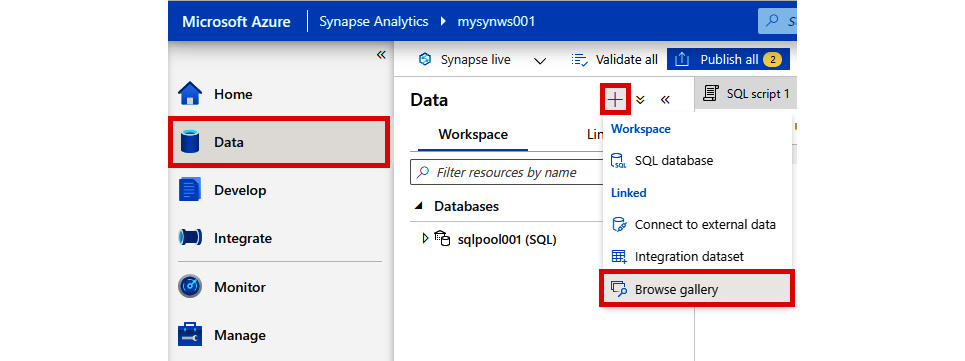
Figure 2.27: The 'Browse gallery' option
- Select NYC Taxi & Limousine Commission – yellow taxi trip records and click on Continue:
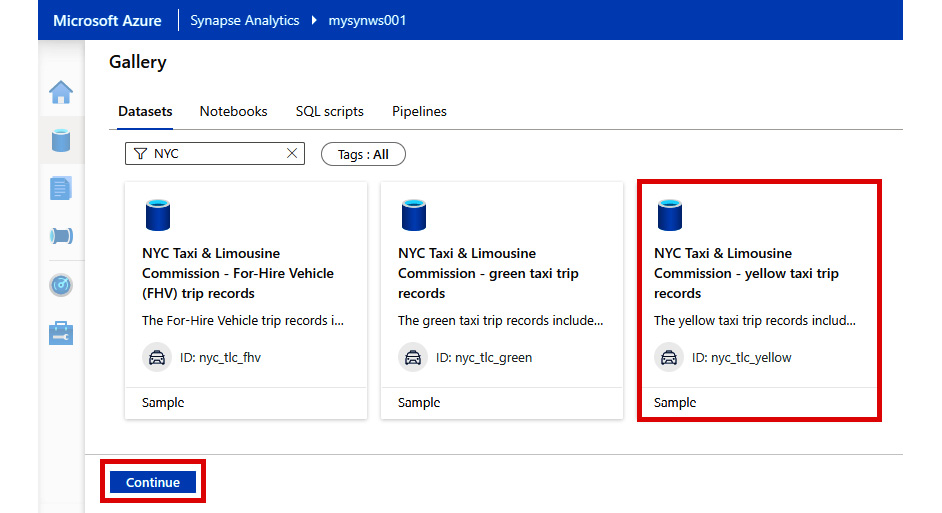
Figure 2.28: Selecting a dataset from the gallery
- Click on Add dataset:
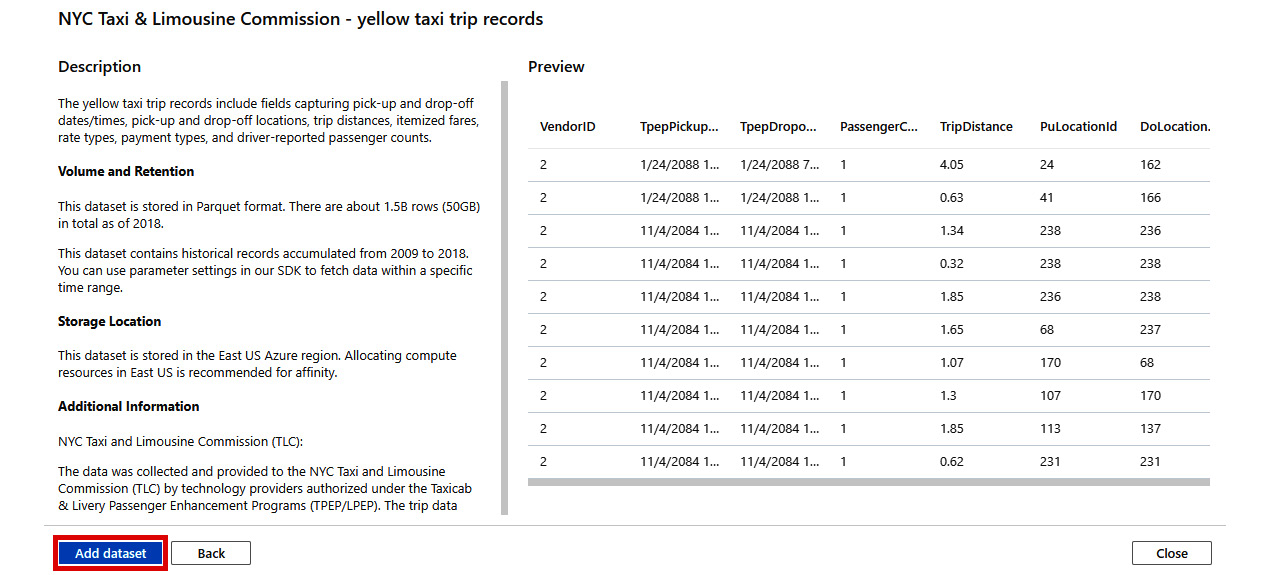
Figure 2.29: Adding a dataset
- In the Data hub, under Linked, right-click on nyc_tlc_yellow and select New notebook then Load to DataFrame:

Figure 2.30: Creating a new notebook
- A new notebook is created with the following code auto-generated. Click Run all:

Figure 2.31: Running the notebook
Feel free to experiment by linking other datasets and modifying the code to pull in different results. In the next section, you will learn how to ingest SQL pool data into a Spark database.
Ingesting SQL pool data into a Spark database
Earlier in this chapter, we loaded the NYC Taxi data into our SQL pool named sqlpool001. Let's use it to demonstrate how we can ingest data from our SQL pool into our Spark database named sparknyc:
- In Synapse Studio, select the Develop hub on the left-hand pane, then + and Notebook:
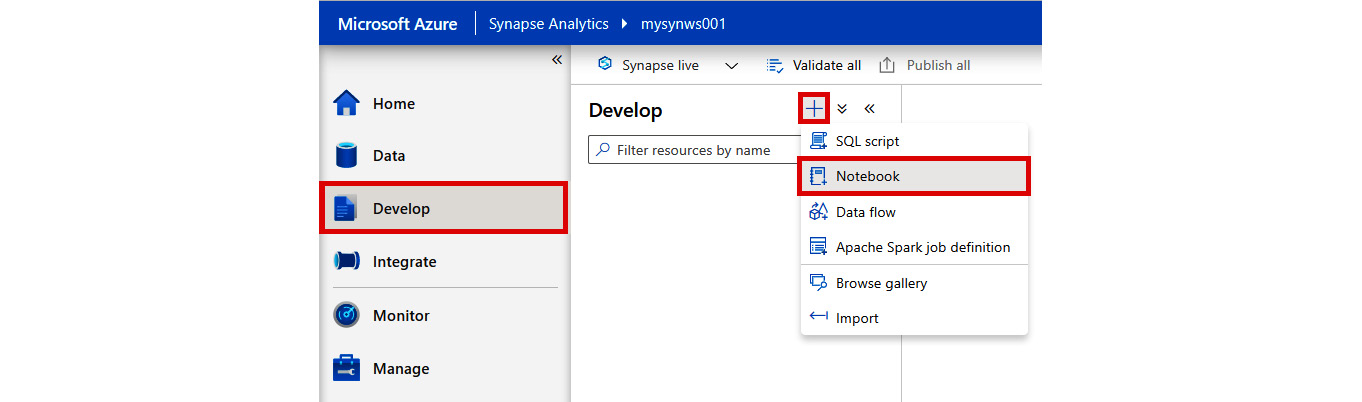
Figure 2.32: Creating a new notebook
- Click Add code:
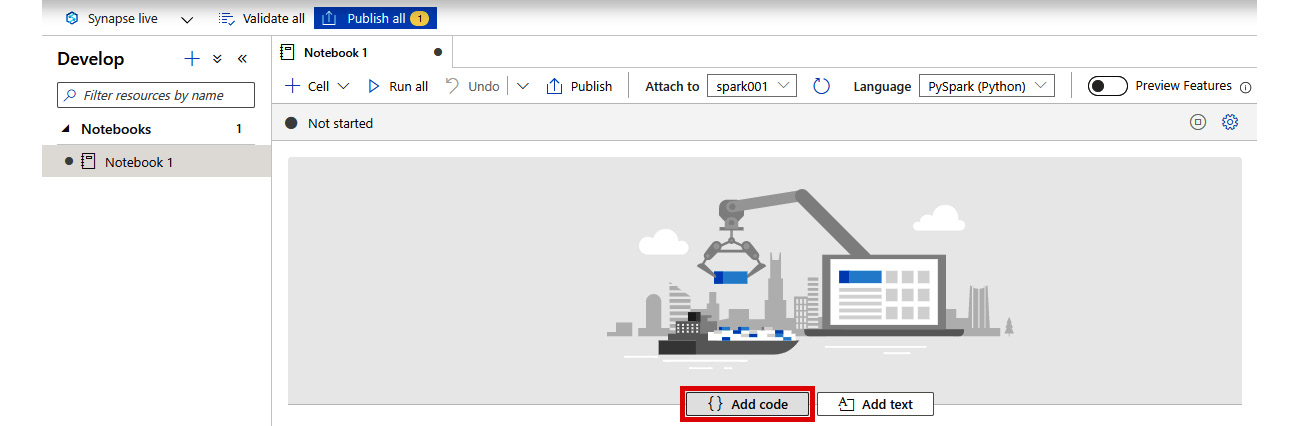
Figure 2.33: Adding code in the notebook cell
- Enter the following code in the new notebook code cell. Then click the Run button:
%%spark
spark.sql("CREATE DATABASE IF NOT EXISTS sparknyc")
val df = spark.read.sqlanalytics("sqlpool001.dbo.TaxiTrip")
df.write.mode("overwrite").saveAsTable("sparknyc.taxitrip")
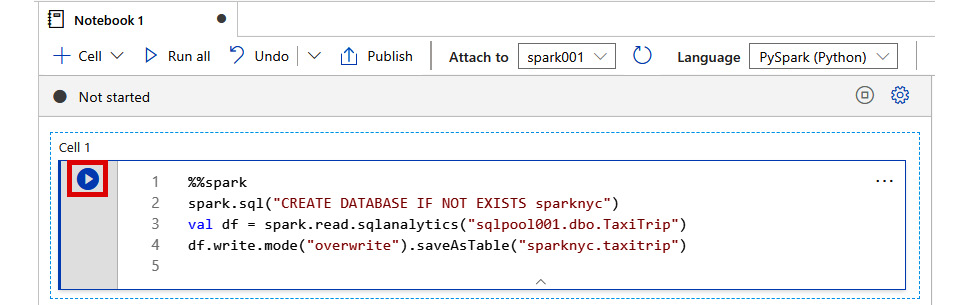
Figure 2.34: Running Spark (Scala) code to ingest SQL pool data into a Spark database
Note
The default language for the notebook is PySpark (Python). By using the %%spark magic in line 1 of the code, we are able to quickly switch this cell language to Spark (Scala).
- If you go to the Data hub and refresh the databases, you will see our newly created sparknyc (Spark) database:
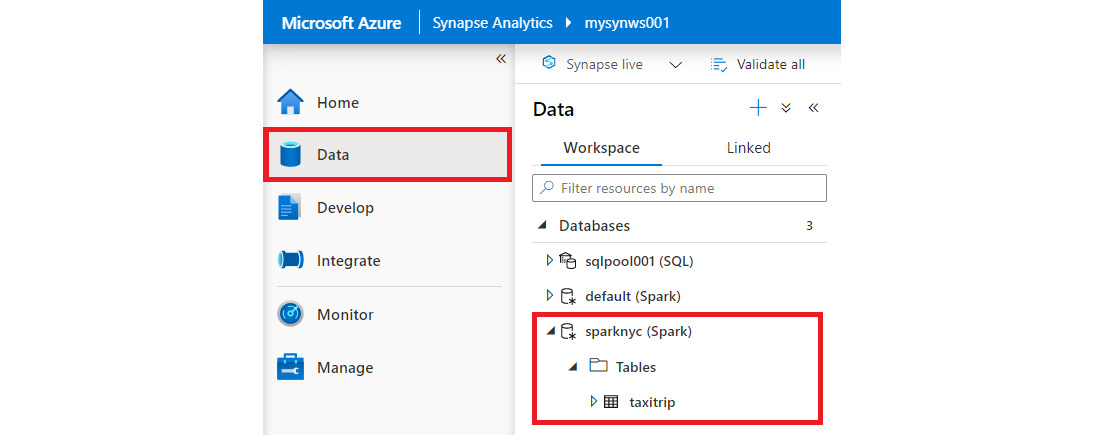
Figure 2.35: The newly created Spark database
Now that we have successfully ingested the data from the SQL pool into our Spark table, we will look at how to analyze data using Spark and notebook in the following section.
Analyzing data using Spark and notebook
Now that we have ingested data into our new sparknyc Spark database, let's use Spark and notebook to perform some data analysis:
- In Synapse Studio, select the Develop hub on the left-hand pane, then + and Notebook.
- We are now going to run the same analysis in the Spark as we did in our earlier SQL pool example. We will save the results to a new passengerstats Spark table. Enter the following code in the new notebook code cell. Then click the Run button to run the code in the default notebook language of PySpark (Python):
df = spark.sql("""SELECT PassengerCount,
SUM(TripDistanceMiles) as TotalTripDistance,
AVG(TripDistanceMiles) as AverageTripDistance
FROM sparknyc.taxitrip
WHERE PassengerCount > 0 AND TripDistanceMiles > 0
GROUP BY PassengerCount
ORDER BY PassengerCount""")
display(df)
df.write.saveAsTable("sparknyc.passengerstats")
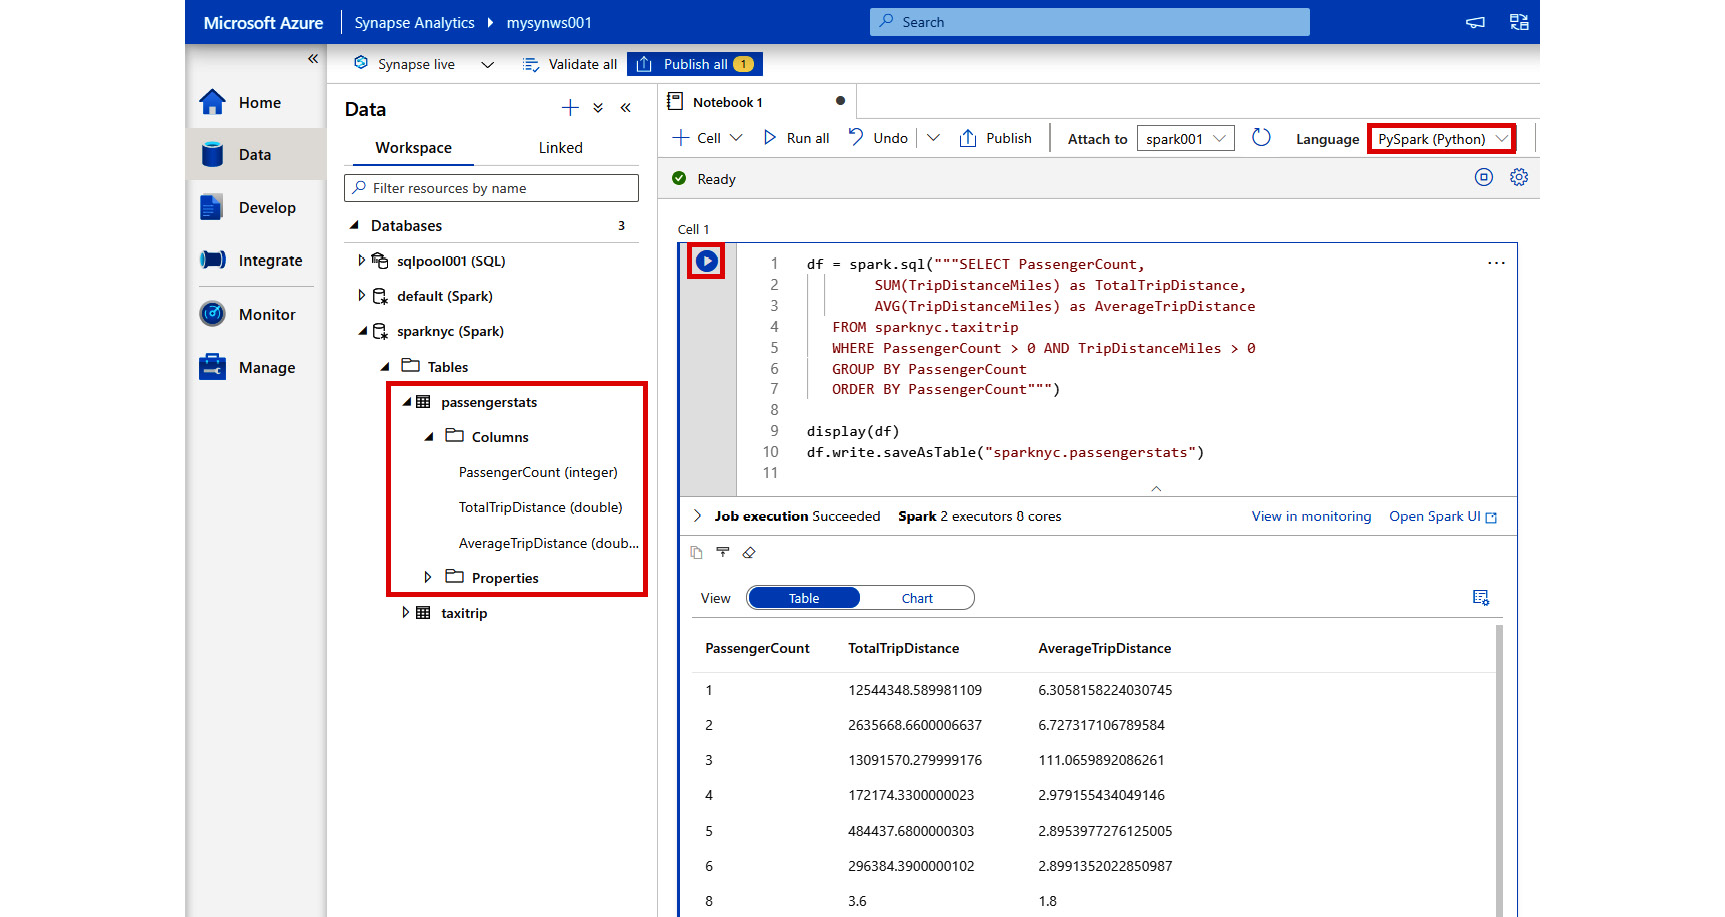
Figure 2.36: Code results
- As in our SQL pool example, we can quickly change our view to Chart to visualize the results:
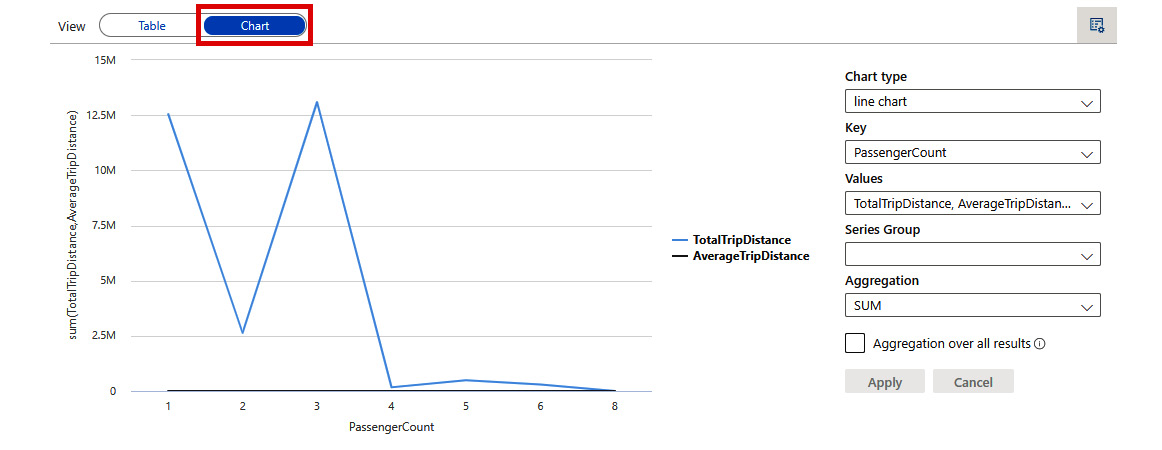
Figure 2.37: Line chart visualization
Earlier, we showed you how to ingest data from an SQL pool to a Spark table. Now, to complete the circle, we will show you how you can ingest data from a Spark table back into an SQL pool.
Ingesting Spark table data into an SQL pool table
To complete our tour of SQL pools and Spark, we will now demonstrate how to load data from the passengerstats Spark table back to an SQL pool table called sqlpool001.dbo.PassengerStats:
- In Synapse Studio, select the Develop hub on the left-hand pane, then click + and Notebook.
- Add the following code in a new notebook code cell:
%%spark
val df = spark.sql("SELECT * FROM sparknyc.passengerstats")
df.write.sqlanalytics("sqlpool001.dbo.PassengerStats",Constants.INTERNAL)
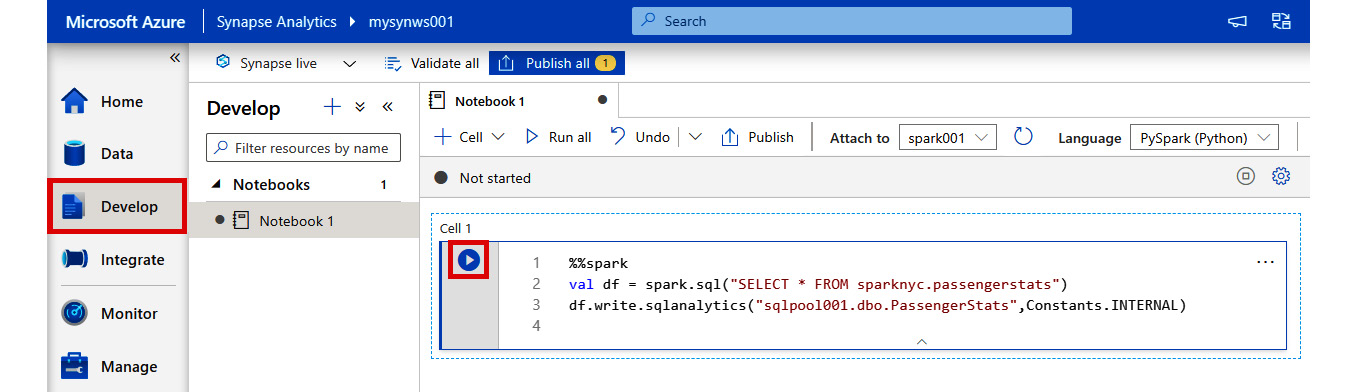
Figure 2.38: Adding a code in a notebook code cell
Note
The default language for the notebook is PySpark (Python). By using the %%spark magic in line 1 of the code, we are able to quickly switch this cell language to Spark (Scala).
- And just like that, the new dbo.PassengerStats table is created in the SQL pool along with all the data from the Spark table:
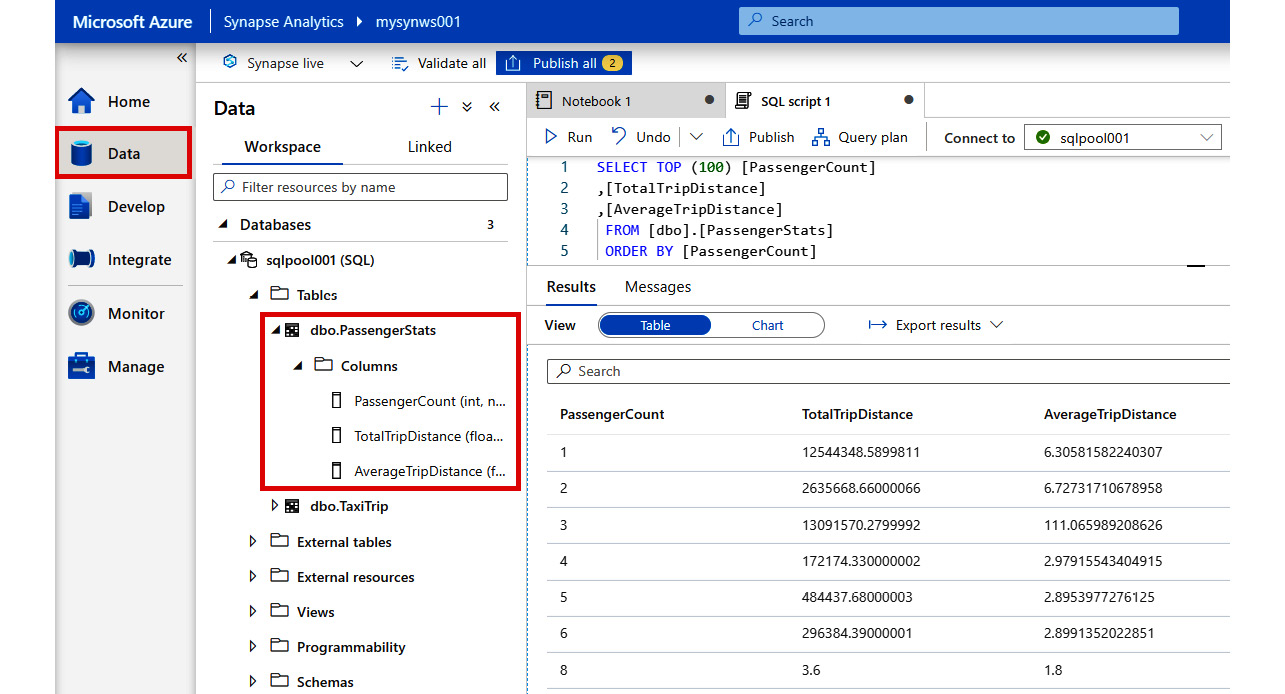
Figure 2.39: New table created in the SQL pool
Now that we have successfully ingested the data from our Spark table into an SQL pool table, we will look at how to analyze data using serverless SQL pools.
Analyzing data using serverless SQL pools
Another powerful capability of Azure Synapse Analytics is the ability to analyze data with serverless SQL pools. Serverless SQL pools allow you to run SQL queries without provisioning resources. This allows ease of exploration and data analysis in Azure Data Lake Storage Gen2 without any setup or infrastructure maintenance.
We will now demonstrate how to use serverless SQL pools to analyze data in Azure Blob Storage:
- In Synapse Studio, select the Data hub on the left-hand pane.
- Under Linked, right-click on nyc_tlc_yellow | New SQL script | Select TOP 100 rows:
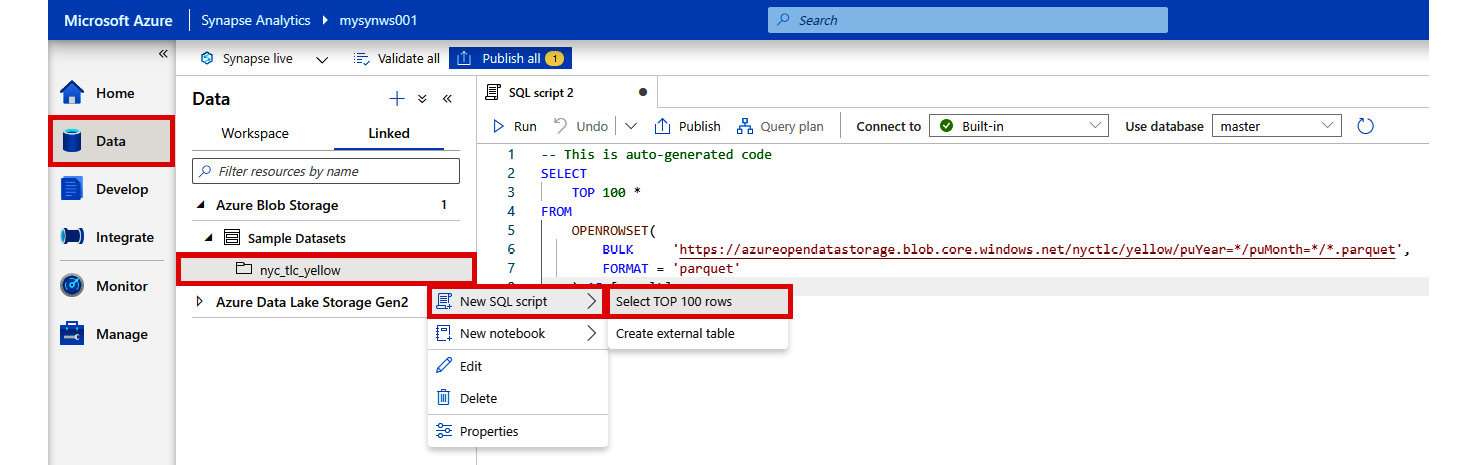
Figure 2.40: Using serverless SQL to analyze data in Azure Blob Storage
- Click Run to see the results.
From this demonstration, you can see that serverless SQL pools allow you to instantly execute queries without having to provision any resources. We will look at how to build data pipelines and perform code-free data transformations next.
Integrating with pipelines
The Integrate hub allows you to build data pipelines and perform code-free data transformations. An activity defines the actions to perform on data such as copying data, running a notebook, or running an SQL script. A pipeline is a logical grouping of activities that perform a task together. In this section, we will demonstrate how to integrate pipelines and activities using Synapse Studio:
- In Synapse Studio, select the Integrate hub on the left-hand pane.
- Click + and Pipeline to create a new pipeline:
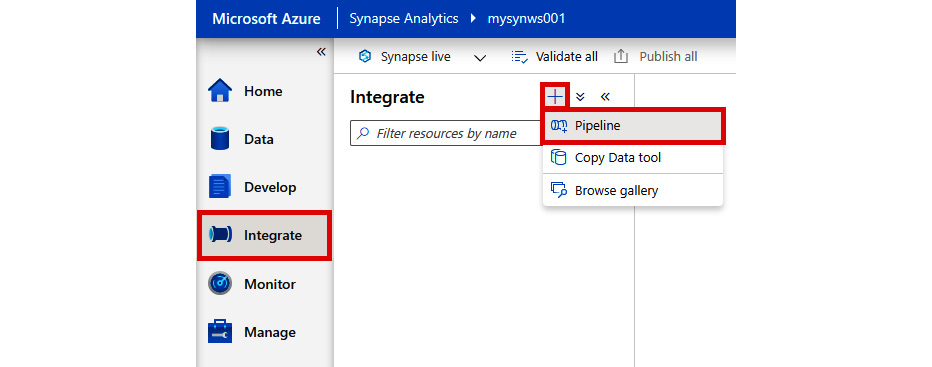
Figure 2.41: Creating a new pipeline
- Go to the Develop hub and drag an existing notebook into the pipeline:
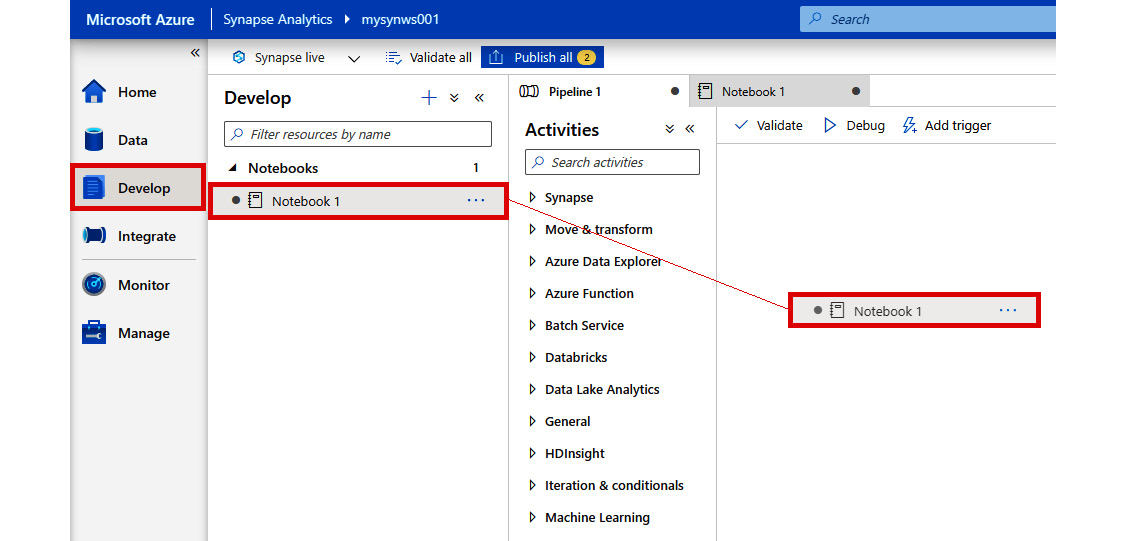
Figure 2.42: Drag an existing notebook into the pipeline
- Click Add trigger and New/Edit:
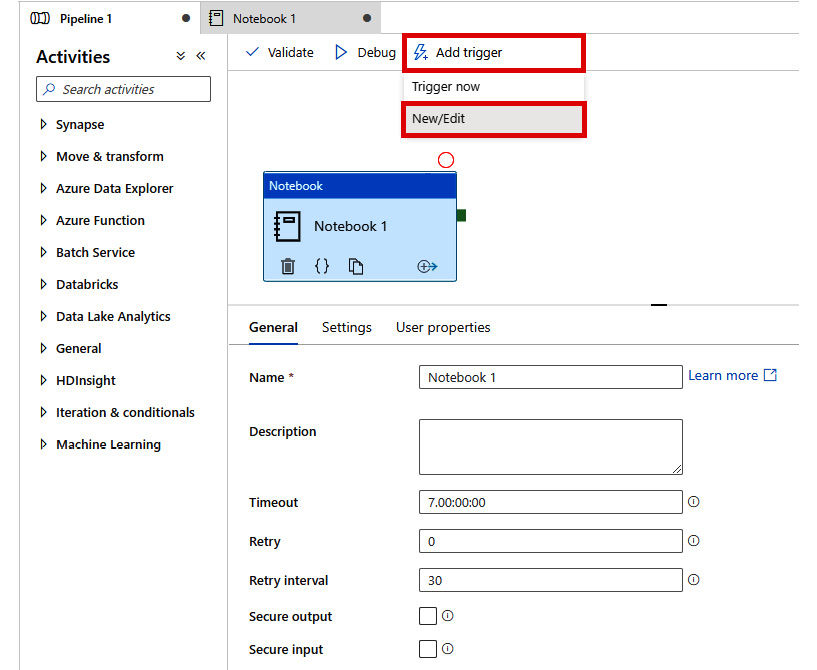
Figure 2.43: Adding a trigger
- In Choose trigger…, select New:
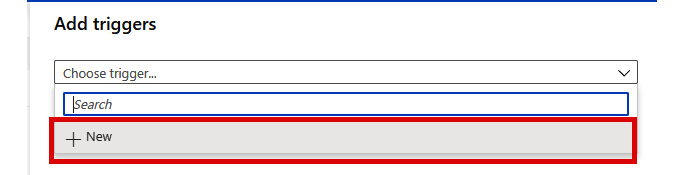
Figure 2.44: Choosing a trigger
- Configure the trigger as shown, then click OK:
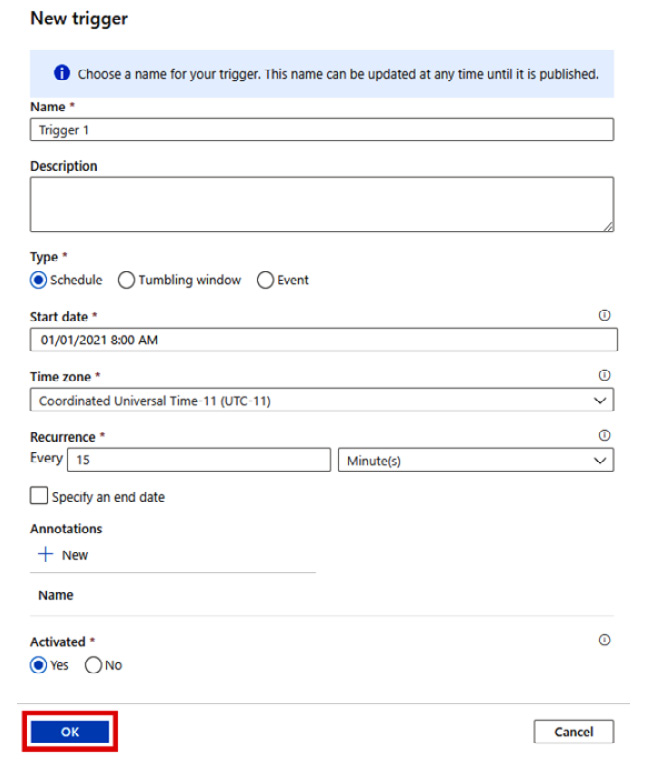
Figure 2.45: Configuring the trigger
- Commit the changes and activate the trigger by clicking Publish All.
- To run the pipeline immediately, simply go to Add trigger and Trigger now:

Figure 2.46: Choosing the 'Trigger now' option
As you can see, you can create a pipeline in Azure Synapse Analytics very easily and perform powerful data transformations without writing a single line of code.
The Monitor hub
The final feature that we will look at is the Monitor hub. This is where we can monitor currently running jobs. The best way to understand how it works is by seeing it in action:
- Run the pipeline that we created in the previous section by using Trigger now.
- In Synapse Studio, select the Monitor hub on the left-hand pane, and click Pipeline runs:
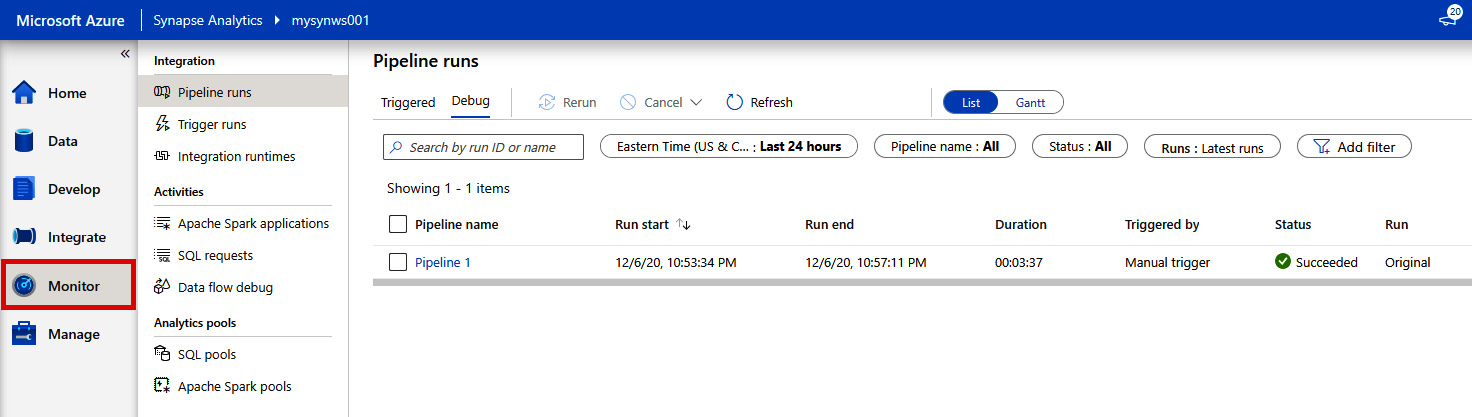
Figure 2.47: Monitor hub
In the Pipeline runs section, you can monitor the progress of your pipeline execution. Furthermore, if you encounter an error with your pipeline execution, you can use the Monitor hub to troubleshoot the issue.
In addition to pipeline monitoring, you can also monitor triggers, integration runtimes, Apache Spark applications, SQL requests, and data flow debug.
We hope that you enjoyed our introductory tour of the Azure Synapse Analytics workspace and Synapse Studio. Before we conclude this chapter, we'd like to highlight some of the advanced features in Azure Synapse Analytics that you can explore on your own:
- Optimization using materialized views and resultset caching
- Workload importance and workload isolation
- Row-level security
- Dynamic data masking
- Integration with AutoML
- SQL predict
- CI/CD integration
Summary
Azure Synapse Analytics is a groundbreaking evolution of Azure SQL Data Warehouse. It takes the best of the Azure SQL Data Warehouse and modernizes it by providing more functionalities for SQL developers, adding querying with serverless SQL pools, machine learning support, embedding Spark natively, collaborative notebooks, and data integration—all within a single service.
As you have learned in this chapter, data engineers can provision an Azure Synapse Analytics workspace in a matter of minutes and start building their end-to-end analytics solutions using a unified, simplified, and streamlined approach inside Synapse Studio. This remarkable and innovative all-in-one environment is a dream come true for many data professionals.
In the next chapter, you will look at Power BI and Azure Machine Learning. Later, we will see real use cases for how all of these technologies are integrated to provide the complete end-to-end data warehouse solutions that business decision-makers can use to derive meaningful insights from real-time data.