
7
Multichannel Television Services
Overview
Consumers are using four methods to receive packages of television channels and/or programming, including cable, satellite, telephone lines, and Internet delivery (OTT—Over-the-Top Television). This multichannel video programming distributor (MVPD) market is more competitive than ever, with consumers actively switching from one service to others, as well as subscribing to multiple services at the same time. Overall the MVPD industry continued to face substantial subscriber losses in 2016 and 2017 due to the growing cord-cutting trend. Cable operators, which still dominate the MVPD market with a 55% penetration rate, shed 2% of their video subscriber base between 2016 and 2017; direct broadcast satellite (DBS) providers with a market share of 34% lost 5%; and telephone companies with an 11% share saw their subscriber count drop by 8%. In all, the traditional MVPDs lost about 4% of their video subscribers between 2016 and 2017 and the same downward trend is expected to continue. The top four U.S. pay-TV providers (AT&T, Comcast, Charter, and DISH) served 79% of the mainstream video subscribers in 2017. The top virtual MVPDs, such as Sling TV and DirecTV Now, added more than an estimated 1.5 million subscribers in 2017. It is unclear whether the cord-cutting phenomenon will stabilize in the near future.
Introduction
Until the early 1990s, most consumers who sought to receive multichannel television service enjoyed few options other than subscribing to their local cable television operator. Satellite television reception through large dishes was available nationwide in the early 1980s, but this technology lost its luster soon after popular networks decided to scramble their signals. Multichannel multipoint distribution service (MMDS), using microwave technology and dubbed wireless cable, existed in limited areas of the country in the 1980s, but has never become a major market player. So, for all intents and purposes, the cable industry operated as a de facto monopoly with little or no competition for multichannel video service during the 1980s.
The market structure of subscription-based multichannel television began to change when DirecTV launched its direct broadcast satellite (DBS) service in 1994 and when DISH delivered satellite signals to its first customers in 1996. Another watershed moment occurred when Verizon introduced its fiber-to-the-home FiOS service in 2005 and AT&T started deploying U-verse in 2006. While few cable overbuilders (i.e., two wired cable systems overlapping and competing with one another for the same video subscribers in the same area) have ever existed, the multichannel video programming distributor (MVPD) marketplace became increasingly competitive during the second decade of the 2000s, especially with the explosive growth of hundreds of over-the-top (OTT) programming services. The Federal Communications Commission (FCC) reported that 35% of U.S. homes were able to subscribe to at least four MVPDs in 2013 (FCC, 2015a), but this statistic plunged to only 17.9% in 2015, largely attributable to the acquisition of DirecTV by AT&T. Still, 99% of housing units continued to have access to three competing MVPD services—a cable system and two direct broadcast satellite providers—in 2015 (FCC, 2017). In 2018, the MVPD industry faced a very different landscape, from an 86% near market saturation in earlier decades to 77% in 2017, with an expectation for further decline. So-called cord-cutting activity and cord-never inactivity pose a possibly existential threat to the traditional MVPD business model from over-the-top (OTT) providers like Netflix, Amazon Prime Video, Hulu, and many others. Although consumption and distribution patterns are changing quickly, MVPDs remain powerful businesses, capturing some advantage from their vertical integration as program content creators with the ability to sell their own TV subscriptions over-the-top, often in bundles containing fewer channels.
This chapter will first provide background information about multichannel television services to situate the historical, regulatory, and technological context of the industry. Special emphasis will be given to the cable industry. The other sections of the chapter will describe and discuss major issues and trends affecting the MVPD industry.
Definitions
Before we delve into the content proper, it is important to delineate the boundaries of this chapter and define key terms that are relevant to multichannel television services. Because definitions often vary from source to source, thereby creating further confusion, we will rely as much as possible on the legal framework of U.S. Federal Regulations and laws to define these terms. The Cable Television Consumer Protection and Competition Act of 1992 defines a multichannel video programming distributor (MVPD) as “a person such as, but not limited to, a cable operator, a multichannel multipoint distribution service, a direct broadcast satellite service, or a television receive-only satellite program distributor, who makes available for purchase, by subscribers or customers, multiple channels of video programming” (p. 244). For the most part, MVPD service refers to multichannel video service offered by cable operators (e.g., Comcast, Charter), DBS providers (DirecTV, DISH), and telephone companies (e.g., AT&T’s U-verse, AT&T Fiber, Verizon’s FiOS). This chapter will focus on these distributors.
Pay television designates a category of TV services that offer programs uninterrupted by commercials for an additional fee on top of the basic MVPD service (FCC, 2013a). These services primarily consist of premium channels, pay-per-view (PPV), and video on demand (VOD). Subscribers pay a monthly fee to receive such premium channels as HBO and Starz. In the case of PPV, they pay a per-unit or transactional charge for ordering a movie or another program that is scheduled at a specified time. VOD, on the other hand, allows viewers to order a program from a video library at any given time in return for an individual charge or a monthly subscription fee. The latter type of VOD service is called subscription VOD or SVOD. We should note that the terms “pay television” and “MVPD” are often used interchangeably to denote a TV service for which consumers pay a fee, as opposed to “free over-the-air television,” which is available to viewers at no cost.
But perhaps the most challenging definitional issue that confronts regulators is whether over-the-top (OTT) providers could qualify as MVPDs if they offer multiple channels of video programming for purchase, like traditional MVPDs do. In December 2014, the FCC (2014a) proposed to redefine an MVPD as a provider that makes available for purchase “multiple linear streams of video programming, regardless of the technology used to distribute the programming” (p. 15996). In so doing, the Commission sought to create a more flexible and more competitive platform-neutral framework for MVPD operations. This reinterpretation would cover Internet-based distributors as long as they provide multiple linear programming streams. A “stream” would be analogous to a channel, and “linear programming” would refer to prescheduled video programming. Specifically, the redefinition in the FCC’s (2014a) Notice of Proposed Rulemaking (NPRM) would apply to subscription linear providers (also called linear OTTs), such as Sky Angel, which delivered religious and family-friendly programming over IP (Internet Protocol) until 2014 (see FCC, 2010). We should note that the new MVPD status, if implemented, would carry both regulatory benefits (e.g., program access rules) and obligations (e.g., retransmission consent) for these Internet-based MVPDs. In December 2015, then-FCC Chairman Tom Wheeler indicated that the MVPD redefinition proceeding would be placed on hiatus given the numerous innovative developments influencing the video space (Eggerton, 2015).
In summary, while the FCC is considering expanding the meaning of the term “MVPD,” it is likely that this NPRM will progress slowly, due in part to the objections set forth by cable operators. In addition, such a reinterpretation would be limited in scope because it would only concern linear OTT providers — MVPDs that offer multiple programming streams at prescheduled times. Thus, linear OTT would be regulated quite differently from VOD OTT services, such as Netflix and Hulu. It is unclear, though, how the FCC would treat an OTT provider that offers both linear and non-linear video content. Presumably, the FCC (2015a) would continue to view a VOD OTT as an online video distributor (OVD), which “offers video content by means of the Internet or other Internet Protocol (IP)-based transmission path provided by a person or entity other than the OVD” (p. 3255). Even though it supplies more than 300 paid channels, YouTube would still be classified as an OVD because these channels are not programmed according to a regular broadcast or cable schedule. So, as of early 2018, all OTT providers were considered as OVDs according to the FCC’s classification.
Interestingly, the FCC (2014a) chose to define OTT far more narrowly than the industry does—as “linear [emphasis added] video services that travel over the public Internet and that cable operators do not treat as managed video services on any cable system” (p. 16026). More than ever, understanding the evolving increasingly complex terminology of the video space is critically important for any student of communication technologies. While OTT providers were addressed in detail in Chapter 6, the impact of OTT on multichannel video services is inescapable and will be mentioned in this chapter as warranted.
Background
The Early Years
While a thorough review of the history, regulation, and technology of the multichannel video industry is beyond this chapter (see Baldwin & McVoy [1988], Parsons [2008], Parsons & Frieden [1998] for more information), a brief overview is necessary to understand the broad context of this technology.
As TV broadcasting grew into a new industry in the late 1940s and early 1950s, many households were unable to access programming because they lived too far from local stations’ transmitter sites or because geographic obstacles blocked reception of terrestrial electromagnetic signals. Without access to programming, consumers were not going to purchase TV receivers, a problem for local stations seeking viewers and appliance stores eager to profit from set sales.
The solution was to erect a central antenna capable of capturing the signals of local market stations, amplify, and distribute them through wires to prospective viewers for a fee. Thus, cable extended local stations’ reach and provided an incentive to purchase a set. The first non-commercial Community Antenna TV (CATV) service was established in 1949 in Astoria, Oregon, but multiple communities claim to have pioneered this retransmission technology, including a commercial system launched in Lansford, Pennsylvania, in 1950 (Besen & Crandall, 1981).
Local TV broadcasters initially valued cable’s ability to extend their household reach, but tensions arose when cable operators began using terrestrial microwave links to import programming from stations located in “distant markets,” increasing the competition for audiences that local stations rely on to sell advertising. Once regarded as a welcome extension to their over-the-air TV signals, broadcasters increasingly viewed cable as a threat and sought regulatory protection from the government.
Evolution of Federal Communications Commission Regulations
At first, the FCC showed little interest in regulating cable TV. But given cable’s growth in the mid-1960s, the FCC, sensitive to TV broadcasters’ statutory responsibilities to serve their local communities and promote local self-expression, adopted rules designed to protect over-the-air TV broadcasting (FCC, 1965). Viewing cable as only a supplementary service to over-the-air broadcasting, regulators mandated that cable systems carry local TV station signals and placed limits on the duplication of local programming by distant station imports (FCC, 1966). The Commission saw such rules as critical to protecting TV broadcasters, especially struggling UHF-TV stations, although actual evidence of such harm was largely nonexistent. Additional cable regulations followed in subsequent years, including a program origination requirement and restrictions on pay channels’ carriage of movies, sporting events, and series programming (FCC, 1969, 1970).
The FCC’s robust protection of over-the-air broadcasting began a minor thaw in 1972, allowing an increased number of distant station imports depending on market size, with fewer imports allowed in smaller TV markets (FCC, 1972a). The 1970 pay cable rules were also partially relaxed. Throughout the rest of the decade, the FCC continued its deregulation of cable, sometimes in response to court decisions.
Although the U.S. Supreme Court held in 1968 that the FCC had the power to regulate cable television as reasonably ancillary to its responsibility to regulate broadcast television, the scope of the FCC’s jurisdiction under the Communications Act of 1934 remained murky (U.S. v. Southwestern Cable Co., 1968). The FCC regulations came under attack in a number of legal challenges. For instance, in Home Box Office v. FCC (1977), the Court of Appeals for the D.C. Circuit questioned the scope of the FCC’s jurisdiction over cable and rejected the Commission’s 1975 pay cable rules, designed to protect broadcasters against possible siphoning of movies and sporting events by cable operators.
In the mid-1970s, cable began to move beyond its community antenna roots with the use of domestic satellites to provide additional programming in the form of superstations, cable networks, and pay channels. These innovations were made possible by the FCC’s 1972 Open Skies Policy, which allowed qualified companies to launch and operate domestic satellites (FCC, 1972b). Not only did the advent of satellite television increase the amount of programming available to households well beyond the coverage area of local TV broadcast channels, but it also provided cable operators with an opportunity to fill their mostly 12-channel cable systems.
Early satellite-delivered programming in 1976 included Ted Turner’s “Superstation” WTGC (later WTBS) and the Christian Broadcasting Network, both initially operating from local UHF-TV channels. In 1975, Home Box Office (HBO), which had begun as a pay programming service delivered to cable systems via terrestrial microwave links, kicked off its satellite distribution offering the “Thrilla in Manila” heavyweight title fight featuring Mohammad Ali against Joe Frasier.
Demand for additional cable programming, offering many more choices than local television stations and a limited number of distant imports, stimulated cable’s growth, especially in larger cities. According to the National Cable & Telecommunications Association (2014), there were 28 national cable networks by 1980 and 79 by 1990. This growth started an alternating cycle where the increase in the number of channels led local cable systems to increase their capacity, which in turn stimulated creation of new channels, leading to even higher channel capacity, etc.
Formal congressional involvement in cable TV regulation began with the Cable Communications Policy Act of 1984. Among its provisions, the Act set national standards for franchising and franchise renewals, clarified the roles of Federal, state, and local governments, and freed cable rates except for systems that operated without any “effective competition,” defined as TV markets having fewer than three over-the-air local TV stations. Cable rates soared, triggering an outcry by subscribers.
The quickly expanding cable industry was increasingly characterized by a growing concentration of ownership. Congress reacted to this situation in 1992 by subjecting more cable systems to rate regulation of their basic and expanded tiers, and instituting retransmission consent options (requiring cable systems to give something of value to local TV stations not content with simple must-carry status).
The Cable Television Consumer Protection and Competition Act of 1992 also required that MVPDs make their programming available at comparable terms to satellite and other services. The passage of the Telecommunications Act of 1996 also reflected a clear preference for competition over regulation. It rolled back much of the rate regulation put in place in 1992 and opened the door for telephone companies to enter the video distribution business.
Distribution of TV Programming by Satellite
By the late 1970s and early 1980s, satellites were being used to distribute TV programming to cable systems, expanding the line-up of channels available to subscribers. But in 1981, about 11 million people lived in rural areas where it was not economical to provide cable; five million residents had no TV at all, and the rest had access to only a few over-the-air stations (FCC, 1982).
One solution for rural dwellers was to install a Television Receive Only (TVRO) satellite dish. Sometimes called “BUGS” (Big Ugly Dishes) because of the 8-to-12-foot diameter dishes needed to capture signals from low-power satellites, TVROs were initially the purview of hobbyists and engineers. In 1976, H. Taylor Howard, a professor of electrical engineering at Stanford University, built the first homemade TVRO and was able to view HBO programming for free (his letter of notice to HBO having gone unanswered) (Owen, 1985).
Interest in accessing free satellite TV grew in the first half of the 1980s, and numerous companies began to market satellite dish kits. From 1985 to 1995, two to three million dishes were purchased (Dulac & Godwin, 2006). However, consumer interest in home satellite TV stalled in the late-1980s when TV programmers began to scramble their satellite feeds.
In 1980, over the strenuous objections of over-the-air broadcasters, the FCC began to plan for direct broadcast satellite (DBS) TV service (FCC, 1980). In September 1982, the Commission authorized the first commercial operation. At the 1983 Regional Administrative Radio Conference, the International Telecommunication Union (ITU), the organization that coordinates spectrum use internationally, awarded the United States eight orbital positions of 32 channels each (Duverney, 1985). The first commercial attempt at DBS service began in Indianapolis in 1983, offering five channels of programming, but ultimately all of the early efforts failed, given the high cost of operations, technical challenges, and the limited number of desirable channels available to subscribers. (Cable operators also used their leverage to dissuade programmers from licensing their products to DBS services.) Still, the early effort demonstrated the technical feasibility of using medium-power Ku-band satellites (12.2 to 12.7 GHz downlink) and foreshadowed a viable DBS service model.
In 1994, the first successful DBS providers were DirecTV, a subsidiary of Hughes Corporation, and U.S. Satellite Broadcasting (USSB) offered by satellite TV pioneer Stanley Hubbard. Technically competitors, the two services offered largely complementary programming and together launched the first highpower digital DBS satellite capable of delivering over 200 channels of programming to a much smaller receiving dish (Crowley, 2013).
DirecTV bought USSB in 1998. EchoStar (now the DISH Network) was established in the United States in 1996 and became DirecTV’s primary competitor. In 2005, the FCC allowed EchoStar to take over some of the satellite channel assignments of Rainbow DBS, a failed 2003 attempt by Cablevision Systems Corporation to offer its Voom package of 21 high-definition (HD) TV channels via satellite. In 2003, the U.S. Department of Justice blocked an attempted merger between DirecTV and EchoStar. DirecTV later became a successful acquisition target.
Direct Broadcast Satellite Expansion
DBS systems proved popular with the public but faced a number of obstacles that allowed cable to remain the dominant provider of multichannel television service. One competitive disadvantage of DBS operators over their cable counterparts was that subscribers were unable to view their local-market TV channels without either disconnecting the TV set from the satellite receiver or installing a so-called A/B switch that made it possible to flip between over-the-air and satellite signals.
In 1988, Congress passed the Satellite Home Viewer Act that allowed the importation of distant network programming (usually network stations in New York or Los Angeles) to subscribers unable to receive the networks’ signals from their over-the-air local network affiliates. Congress followed up in 1999 with the Satellite Home Viewer Improvement Act (SHVIA) that afforded satellite companies the opportunity (although not a requirement) to carry the signals of local market TV stations to all subscribers living in that market. SHIVA also mandated that DBS operators carrying one local station carry all other local TV stations requesting carriage in a local market, a requirement known as “carry one, carry all.”
Today, almost all of U.S. TV households subscribing to DBS service are able to receive their local stations via satellite. DISH Network supplies local broadcast channels in HD to all 210 U.S. TV markets and DirecTV covers 198 markets (FCC, 2016). Local station signals are delivered from the satellite using spot beam technology that transmits signals into specific local TV markets. Satellites have dozens of feedhorns used to send their signals to earth, from those that cover the entire continental United States (CONUS) to individual spot beams serving local markets.
Cable System Architecture
Early cable TV operators built their systems based on a “tree and branch” design using coaxial cable, a type of copper wire suitable for transmission of radio frequencies (RF). As shown in Figure 7.1, a variety of video signals are received at the cable system’s “headend,” including satellite transmissions of cable networks, local TV station signals (delivered either by wire or from over-the-air signals received by headend antennas), and feeds from any public, educational, and governmental (PEG) access channels the operator may provide. Equipment at the headend processes these incoming signals and translates them to frequencies used by the cable system.
Tree-and-Branch Design
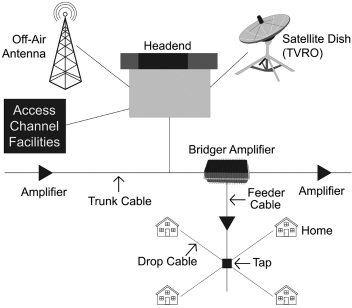
Source: P. Driscoll and M. Dupagne
Most cable companies use a modulation process called quadrature amplitude modulation (QAM) to encode and deliver TV channels. The signals are sent to subscribers through a trunk cable that, in turn, branches out to thinner feeder cables, which terminate at “taps” located in subscribers’ neighborhoods. Drop cables run from the taps to individual subscriber homes. Because electromagnetic waves attenuate (lose power) as they travel, the cable operator deploys amplifiers along the path of the coaxial cable to boost signal strength. Most modern TV receivers sold in North America contain QAM tuners, although set-top boxes provided by the cable system are usually used because of the need to descramble encrypted signals.
Over the years, the channel capacity of cable systems has increased dramatically, from 12-22 channel systems through the mid-1970s to today’s systems capable of carrying more than 300 TV channels and bidirectional communication. Modern cable systems have 750 MHz or more of radio frequency capacity, up to 1GHz in the most advanced systems (Afflerbach, DeHaven, Schulhuf, & Wirth, 2015). This capacity allows not only plentiful television channel choices, but also enables cable companies to offer a rich selection of pay-per-view (PPV) and video-on-demand (VOD) offerings. It also makes possible high-speed Internet and voice over Internet protocol (VoIP) telephone services to businesses and consumers. Most cable operators have moved to all-digital transmission, although a few still provide some analog channels, usually on the basic service tier.
As shown in Figure 7.2, modern cable systems are hybrid fiber-coaxial (HFC) networks. Transmitting signals using modulated light over glass or plastic, fiber optic cables can carry information over long distances with much less attenuation than copper coaxial, greatly reducing the need for expensive amplifiers and offering almost unlimited bandwidth with high reliability. A ring of fiber optic cables is built out from the headend, and fiber optic strands are dropped off at each distribution hub. From the hubs, the fiber optic strands are connected to optical nodes, a design known as fiber-to-the-node or fiber-to-the-neighbor-hood (FTTN). From the nodes, the optical signals are transduced back to electronic signals and delivered to subscriber homes using coaxial cable or thin twistedpair copper wires originally installed for telephone service. The typical fiber node today serves about 500 homes, but additional nodes can be added as data-intensive services like high speed broadband, video on demand, and Internet Protocol (IP) video are added. Depending on the number of homes served and distance from the optical node, a coaxial trunk, feeder, and drop arrangement may be deployed.
Rollouts of HFC cable networks and advances in compression have added enormous information capacity compared to systems constructed with only coaxial copper cable, boosting the number of TV channels available for live viewing, and allowing expansive VOD offerings and digital video recorder (DVR) service. Additionally, given the HFC architecture’s bi-directional capabilities, cable companies are able to offer consumers both telephone and broadband data transmission services, generating additional revenues.
Some MVPDs, such as Verizon’s FiOS service, Google Fiber, and AT&T Fiber, extend fiber optic cable directly to the consumer’s residence, a design known as fiber-to-the-home (FTTH) or fiber-to-the-premises (FTTP). FiOS uses a passive optical network (PON), a point-to-multipoint technology that optically splits a single fiber optic beam sent to the node to multiple fibers that run to individual homes, ending at an optical network terminal (ONT) attached to the exterior or interior of the residence (Corning, 2005). The ONT is a transceiver that converts light waves from the fiber optic strand to electrical signals carried through the home using appropriate cabling for video, broadband (high-speed Internet), and telephony services.
Hybrid Fiber-Coaxial Design

Source: P. Driscoll and M. Dupagne
Although the actual design of FTTH systems may vary, fiber has the ability to carry data at higher speeds compared to copper networks. Fiber broadband services can deliver up to a blazing one gigabit (one billion bits) of data per second. Fiber-to-the-home may be the ultimate in digital abundance, but it is expensive to deploy and may actually provide more speed than most consumers currently need. In addition, technological advances applied to existing HFC systems have significantly increased available bandwidth, making a transition to all-fiber networks a lower priority for existing cable systems in the United States. However, with ever-increasing demand, fiber-to-the-home may ultimately prevail. QAM- modulated signals can be transcoded into Internet Protocol (IP) signals, allowing program distribution via apps, and allows integration of MVPD programming on a variety of third-party devices such as a Roku box, Apple TV or a properly equipped “smart” TV receiver.
Direct Broadcast Satellite System Architecture
As shown in Figure 7.3, DBS systems utilize satellites in geostationary orbit, located at 22,236 miles (35,785 km) above the equator, as communication relays. At that point in space, the satellite’s orbit matches the earth’s rotation (although they are not travelling at the same speed.) As a result, the satellite’s coverage area or “footprint” remains constant over a geographic area. In general, footprints are divided into those that cover the entire continental United States, certain portions of the United States (because of the satellite’s orbital position), or more highly focused spot beams that send signals into individual TV markets. DBS operators send or “uplink” data from the ground to a satellite at frequencies in the gigahertz band, or billions of cycles per second. Each satellite is equipped with receive/transmit units called transponders that capture the uplink signals and convert them to different frequencies to avoid interference when the signal is sent back to earth or “downlinked.”
Basic Direct Broadcast Satellite Technology

Source: P. Driscoll and M. Dupagne
A small satellite dish attached to the consumer’s home collects the signals from the satellite. A lownoise block converter (LBN) amplifies the signals by as much as a million times and translate the high frequency satellite signal to the lower frequencies used by TV receivers. The very high radio frequencies used in satellite communications generate extremely short wavelengths, sometimes leading to temporary signal interference in rainy weather when waves sent from the satellite are absorbed or scattered by raindrops.
Unlike cable service that features bi-directional data flows, commercial DBS is a one-way service that relies on broadband connections to offer most of its VOD services. But with its nationwide footprint, DBS service is available in rural areas where the infrastructure cost of building a cable system would be prohibitive.
Video Compression
The large increase in the number of available programming channels over cable and satellite services is possible due to advances in digital video compression. Developed by the ITU and the MPEG group, video compression dramatically reduces the number of bits needed to store or transmit a video signal by removing redundant or irrelevant information from the data stream. Satellite signals compressed using the MPEG-2 format allowed up to eight channels of digital programming to be squeezed into bandwidth previously used for one analog channel. Video compression yields increased capacity and allows satellite carriage of high-definition TV channels and even some 4K Ultra High Definition (UHD) channels.
Impressive advances in compression efficiency have continued, including the adoption by DBS and some cable operators of MPEG-4 Advanced Video Coding (AVC) that reduces by half the bit rate needed compared with MPEG-2 (Crowley, 2013). Interest is now focused on High Efficiency Video Coding (HEVC), approved in 2013 by the ITU and MPEG, which doubles the program carrying capacity compared with MPEG-4 compression. Even more powerful codecs like HEVC/H.265 and VP9 will enable MVPDs and virtual MVPDs (vMVPDs) to carry additional high-definition and 4K UHD channels (Baumgartner, 2017b).
Satellite, cable, streaming services and even broadcast station operators will continue to deploy advances in compression techniques to provide consumers with picture quality that exploits improvements in TV set display technology, including features like 4K UHD, high contrast resolution (HCR)/high dynamic range (HDR), and higher frame rates. (For more on home video, see Chapter 16.)
Recent Developments
Statewide Video Franchising
Prior to 2005, the required process of cable franchising (i.e., authorizing an entity to construct and operate a cable television system in an area) was generally handled by local governments. The Cable Act of 1984 did not mandate that the franchising authority be a local body, but subjecting cable operators to local jurisdiction made sense since they used public rights-of-way to deploy their infrastructure.
On the other hand, cable operators have long argued that local franchising requirements are onerous and complex, which often involve negotiations and agreements with multiple local governments (e.g., county and city).
In 2005, Texas became the first state to enact a law shifting the responsibilities of cable/video franchise requirements from the local to the state government (see Parker, 2011). More than 20 other states followed suit. In those states, it is typically the department of state or the public utilities commission that issues cable franchises (sometimes called certificates) to wireline MVPDs (National Conference of State Legislatures [NCSL], 2014). Other state agencies may share other cable television service duties (e.g., quality complaints) that previously fell within the purview of local governments. As of November 2014 (latest statistics), at least 25 states awarded cable/video franchising agreements (NCSL, 2014).
Few studies have investigated the impact of statewide cable franchising reforms on competition. Concerns remain about the amount of franchise fees, funding and regulatory oversight of public, educational, and governmental (PEG) access channels, and the possibility and effectiveness of anti-redlining provisions to prevent service discrimination in low-income areas. The FCC (2015a) reported that some states did away with or curtailed the requirements for PEG channels whose funding was often a key provision in local franchise agreements.
A la Carte Pay-TV Pricing
A la carte MVPD service would allow subscribers to order individual channels as a customized programming package instead of relying on standard bundled packages or tiers. This issue has attracted considerable policy interest, especially in the mid-2000s, because consumers have often complained to their elected officials or policymakers about the high cost of cable service in relation to other services. Indeed, the FCC (2013b) has documented for nearly two decades that cable rate increases outpace the general inflation rate. It reported that the average price of expanded basic cable service (cable programming service tier) grew by a compound annual growth rate of 6.1% from 1995 to 2012. In contrast, the consumer price index for all items rose by only 2.4% per year during those 17 years.
The Commission also found that the number of channels available in the expanded package soared from 44 in 1995 to 150 in 2012, or by an annual rate of 5.8% (FCC, 2013b). But the per-channel price hardly changed during that time (0.2% annually), which bolstered the case of the cable industry for legitimate price hikes. In absolute terms, though, cable and other MVPD bills continue to increase far above inflation, due largely to climbing license fees (paid by distributors to non-broadcast programmers for carriage) and retransmission fees (paid by operators to broadcasters for carriage).
According to Lendu, a personal finance website, the monthly MVPD subscription fee averaged $116.93 in December 2017 (Lafayette, 2018a). By the end of 2017, 36% of respondents surveyed by TiVo (2018) reported spending more than $100 a month on their MVPD bill (excluding video-on-demand/movie buys, phone, or Internet service), and 10% indicated paying a monthly bill exceeding $150.
On paper, a bundling strategy makes more economic sense than a pure components strategy (a la carte) when the marginal cost of channel delivery is low, which is often the case with popular channels, and when consumers price channel packages similarly (Hoskins, McFadyen, & Finn, 2004). But studies have shown that consumers would be receptive to a la carte selection if afforded the opportunity. For instance, TiVo (2018) reported that about 81% of the respondents in late 2017 favored the option of customizing their own MVPD package. They ranked ABC, Fox, CBS, Discovery Channel, and A&E as the top five most desirable channels to have in a self-selected package. Respondents also indicated that they would spend an average of $35.87 per month for their a la carte pay-TV package and would select an average of 24 channels. TiVo (2018) pointed out that “the ideal price of $35.87 (for U.S. respondents) for an a la carte package compares to the price of many vMVPD services offered today, such as YouTube TV and Sling TV” (p. 9). Of course, there is no guarantee that a virtual MVPD would match a consumer’s ideal self-selection of programming.
In fact, while viewers continue to favor self-selected packages, a process that may involve scrutinizing the channel line-ups of multiple vMVPDs and be time-consuming, they also “crave simplicity” when “faced with overload” (Baumgartner, 2018d). These two goals may well conflict with each other. In addition, it is unclear whether consumers are fully cognizant of the economic implications that a la carte programming would entail. Critics have pointed out that a la carte programming would not necessarily reduce cable bills because programmers would have to raise their license fees substantially to compensate for declining viewership and advertising revenue. Furthermore, channel diversity would likely be reduced (Nocera, 2007).
Bundling is hardly an insignificant pricing matter for MVPDs. Not only does bundling play a key role in monetizing MVPDs’ video content, but it can also influence the entire revenue stream of cable operators that offer triple-play packages. Triple play, which refers to the combination of video, voice, and data products, is beneficial to both customers who can save money and some MVPDs, particularly cable operators, who can secure a competitive advantage over other MVPDs and counter the effect of cord-cutting or slow growth in the video segment. Media research group Kagan estimated that, as of December 2017, 65% of the customers served by the top five public multiple system operators (MSO) subscribed to more than one service, and 36% opted for the triple-play bundle (Lenoir, 2018).
In summary, availability of a la carte programming, while still being discussed, may never materialize in the United States, especially since some U.S. operators, perhaps as a preemptive strategy, began introducing “skinny” packages, or bundles with pared-down and cheaper channel offerings in 2015. In contrast, a la carte became a reality in Canada when one MVPD, Bell, started offering individual channels for CAN $4 or CAN $7 per channel per month in March 2016, ahead of the December 2016 regulatory deadline (Bradshaw, 2016).
In March 2015, the Canadian Radio-television and Telecommunications Commission (CRTC) (2015) had mandated all MVPDs to provide Canadian viewers with (1) a CAN $25-a-month entry-level television bundle by March 2016 and (2) the option to subscribe to individual channels beyond the basic service on a “pick-and-pay” basis by December 2016. Similar to the U.S. basic service tier, the Canadian first-tier offering includes all Canadian local and regional television stations, public interest channels, provincial educational channels, and community channels if available. Canadian MVPD subscribers can order supplemental (discretionary) channels beyond the first-level tier on a pick-and-pay basis or in small packages. Because of its importance to MVPD marketing and economics, the issue of skinny bundles in the United States will be addressed further.
Adapting to Changes in the Linear Viewing Model
MVPDs continue to adapt their technology and content distribution offerings to accommodate subscribers’ shifting patterns of TV consumption. Today, the average adult American watches three hours and 42 minutes per week of time-shifted TV, and seven out of 10 identify themselves as binge viewers (McCord, 2014; Nielsen, 2017).
The trend toward delayed viewing is one factor disrupting the TV ecosystem, especially for advertising revenues and program ratings. The digital video recorder (DVR), first introduced in 1999, is now present in 64% of television households that subscribe to an MVPD, and 81% of U.S. TV households have a DVR, Netflix, or use VOD (Leichtman Research Group, 2016). Although available as stand-alone units, DVRs are usually integrated into powerful set-top boxes provided by cable and DBS operators. Increasingly, these set-top boxes also provide access to subscription over-the-top programming like Netflix.
The versatility of DVRs has continued to expand, and the available features are sometimes used by MVPDs to distinguish themselves from competitors. For example, the DISH Network’s high-end DVR service, the “Hopper3,” boasts simultaneous recording of up to 16 program channels to its 2TB hard drive (500 hours of HD programming) and allows the viewing of four channels simultaneously on one TV receiver. It also features: automatic ad skipping on playback of some network TV shows; voice integration with Amazon’s Alexa voice assistant; and built-in apps. It can stream and record 4K video from Netflix and provide remote access on mobile devices for out-of-home viewing of live and recorded TV (using Slingbox™ technology) (Prospero, 2017).
Altice USA (formerly Cablevision Systems) offers a remote-storage DVR (RS-DVR) multi-room service that allows subscribers to record up to 15 programs simultaneously and store them in the “cloud” (remote servers at the system’s headend) eliminating the expense of providing hard drives in DVR units. (Cablevision Systems Corp., 2014). Even without a DVR unit, about 70% of MVPD subscribers have access to a huge inventory of VOD and SVOD offerings, including previously aired episodes of programs from channels subscribed to by the consumer (Holloway, 2014).
Another sign of possible upheaval for MVPDs is the growing success of over-the-top (OTT) video services available through a host of streaming media player dongles, boxes, and smart TVs, including Chromecast, Roku, Apple TV, and Sony PlayStation. The rising popularity of broadband-delivered video subscription services, such as Netflix, Hulu, and Amazon Prime Video, have led to concerns that customers, especially younger customers, will be “cutting the cord” on MVPD subscriptions (or never begin subscribing) in favor of more affordable services (Lafayette, 2014). However, for those satisfied with their existing MVPD service, Netflix has announced that it will make its service available for carriage on cable TV systems (Bray, 2014). (For more on OTT, see Chapter 6.)
Retransmission Consent
Few other issues in the MVPD business have created more tensions between distributors and broadcasters (and angered more subscribers) than retransmission consent negotiations going awry.
As noted above, the Cable Act of 1992 allowed local broadcasters to seek financial compensation for program carriage from MVPDs, a process known as retransmission consent. While most of these agreements are concluded with little fanfare (Lenoir, 2014), some negotiations between parties can degenerate into protracted, mercurial, “who-will-blink-first” disputes, which sometimes lead to high-profile programming blackouts when the broadcaster forces the removal of its signal from the MVPD’s line-up. In 2014, there were 94 retransmission blackouts of varying length; that number jumped to 193 in 2015 and to 293 in 2017 (American Television Alliance, 2018).
The economic stakes are high. Broadcasters claim that, like cable networks, they deserve fair rates for their popular programs and increasingly consider retransmission fees as a second revenue stream. Television stations expect to collect more than $10 billion in broadcast retransmission fees in 2018 (see Table 7.1). Few industry observers would disagree that “Retrans saved TV broadcasting, but it cannot save it forever” (Jessell, 2017). On the other hand, the MVPDs, fully aware that excessive customer bills could intensify cord-cutting, have attempted to rein in broadcasters’ demands for higher retransmission fees, generally with little success, reflecting consumers’ robust appetite for broadcast network programming (Baumgartner, 2016).
The Communications Act (47 U.S.C. § 325(b)(3) (C)) imposes a statutory duty on both MVPDs and broadcasters to exercise “good faith” in retransmission consent negotiations, and regulators have increasingly taken note of clashes that too often leave consumers in the dark. In 2014, the FCC barred the “top-4” broadcast stations in a TV market (that are not commonly owned) from banding together to leverage their bargaining power in retransmission consent negotiations and proposed rules to curtail program blackouts (FCC, 2014b).
Table 7.1
Annual Broadcast Retransmission Fee Projections by Medium, 2016-2018
Medium |
2016 |
2017 |
2018 |
|---|---|---|---|
Cable ($ millions) |
$4,211.10 |
$4,999.30 |
$5,482.30 |
Average cable fee/sub/month ($) |
$6.61 |
$7.94 |
$8.84 |
DBS ($ millions) |
$2,683.60 |
$3,210.50 |
$3,530.70 |
Average DBS fee/sub/month ($) |
$6.70 |
$8.03 |
$8.89 |
Telco ($ millions) |
$1,073.70 |
$1,120.70 |
$1,073.40 |
Average telco fee/sub/month ($) |
$7.28 |
$8.73 |
$9.84 |
Total retransmission fees ($ millions) |
$7,968.40 |
$9,330.50 |
$10,086.40 |
Average fee/sub/month ($) |
$6.79 |
$8.18 |
$9.07 |
Note. All figures are estimates as of June 2017. The average fee per month per subscriber for each video medium is obtained by dividing the amount of annual retransmission fee for the medium by the average number of subscribers for that medium. The average number of subscribers, which is calculated by taking the average of the subscriber count from the previous year and the subscriber count of the current year, is meant to estimate the number of subscribers at any given time during the year and reflect better the retransmission fee charged during the year instead of at the year-end. The average estimates refer to the fees paid to television stations on behalf of each subscriber, not to the payment per station.
Source: Kagan. Reprinted with permission
As a result of Congressional action in December 2014, the prohibition on broadcaster coordination in retransmission consent negotiations was applied to all same-market stations not under common legal control (STELA, 2014). The FCC also proposed rules that would label certain broadcaster retransmission negotiation tactics (such as blocking consumers access to a broadcaster’s online programming that duplicates its broadcast delivery during a blackout) as evidence of not negotiating in good faith (FCC, 2015b).
AT&T Changes the U.S. MVPD Market
As discussed earlier, AT&T added video programming to its telephone and cellular services with the fiber-optic based U-verse service. Because that service was distributed through AT&T’s local telephone network (which had long ago replaced most of its 20th century copper network with a fiber-based network designed to deliver data and video on top of telephone conversations), U-verse was limited to areas in which AT&T provided local telephone service. Not satisfied with the steady growth of U-verse, AT&T bought DirecTV in 2015 for $48.5 billion. Perhaps illustrating the economics of satellite-delivery of video, AT&T immediately began shifting video subscribers to DirecTV. It is unknown how long AT&T intends to keep using the DirecTV name, but the company has been aggressive at crossmarketing its multichannel video services with telephone, cellular phone, and broadband data services (Huddleston, 2015).
Current Status
TV Everywhere
According to the FCC (2015a), TV Everywhere (TVE) “allows MVPD subscribers to access both linear and video-on-demand (“VOD”) programming on a variety of in-home and mobile Internet-connected devices” (p. 3256). Ideally, as its name indicates, TVE should provide these subscribers the ability to watch programs, live or not, at any location as long as they have access to a high-speed Internet connection.
Launched in 2009, TVE has grown into a major marketing strategy of multichannel video operators to retain current subscribers, undercut cord-cutting trends, and attract Millennials to pay-TV subscription by offering channel line-ups on mobile devices (Wins-low, 2014). According to a survey by market research company GfK (2015), Generation Y (ages 13-38) respondents in MVPD households used TVE sites and apps more frequently than their Generation X (ages 39-52) and Baby Boomer Generation (ages 53-69) counterparts. Another study reported that among non-subscribers “54% of younger Millennials [ages 18-24] and 47% of older Millennials (ages 25-34) said that they were more likely to subscribe to a service if it offered TV Everywhere capabilities” (Baar, 2015).
Table 7.2
Pay-TV Subscribers’ Awareness and Adoption of TV Everywhere, 2012-2017
Date |
Awareness |
Adoption |
|---|---|---|
Q4 2012 |
26.4% |
26.0% |
Q4 2013 |
36.3% |
21.6% |
Q4 2014 |
42.3% |
25.2% |
Q4 2015 |
40.0% |
21.5% |
Q4 2016 |
49.1% |
30.9% |
Q2 2017 |
50.5% |
34.7% |
Source: TiVo’s Video Trends Report surveys
By the end of 2014, Comcast and other major MVPDs offered their subscribers numerous channels for in-home TVE viewing and even for out-home viewing, though in a smaller quantity (see Winslow, 2014). But even though TVE awareness has nearly doubled from 2012 to 2017, only about a third of respondents in the latest TiVo survey reported using these TVE apps (see Table 7.2). In its own study, GfK (2015) concluded that “[c]onsumer education continues to be a critical missing piece of the puzzle for TV Everywhere.” Interestingly, the authentication process, whose user-friendliness has been questioned (e.g., Dreier, 2014; Winslow, 2014), is perceived as easy to use by a large majority (68%) of surveyed users (TDG, 2014).
Skinny Bundles
“Skinny” bundles or packages refer to “smaller programming packages with fewer channels at potentially lower costs to consumers (and, less altruistically, also allow providers to save on the cost of programming)” (Leichtman Research Group, 2015, p. 1). Even though the basic service tier can be technically considered as a slimmed-down bundle (Hagey & Ramachandran, 2014), the term really applies to selected groups of channels from the (expanded) programming service tier. A skinny bundle does not have to be quantitatively tiny. For instance, DISH Network’s original Sling TV streaming service, introduced in 2015 and perhaps the best-known example of a skinny package that also happens to be an OTT service, contains a dozen channels for $20 a month (Fowler, 2015). By the end of 2017, more than 2.2 million viewers subscribed to Sling TV (Farrell, 2018a).
At least on the surface, consumers seem to prefer smaller TV packages. According to TiVo (2018), the ideal number of channels selected by respondents averaged 24 in late 2017. In addition, the ideal cost that these respondents were willing to pay averaged $35.97 per month. By comparison, MVPD subscribers received an average of 194 channels in 2015 (James, 2015).
Are skinny packages economically and mutually beneficial for consumers and distributors? It is too early to make such assessment, but we must recognize that pared-down bundles may have some drawbacks for both constituencies and may not become the cost-saving panacea that many hope. While expecting lower monthly bills, consumers may be disappointed at the limited menu of channels and frustrated by the extra charges they will have to pay to obtain additional channels. As for the distributors, they may embrace skinny packages as a marketing strategy to stabilize cord-cutting losses, shed less popular channels from their lineups, and court “cord-nevers” (i.e., never subscribing to an MVPD) with cheaper alternatives (see Hagey & Ramachandran, 2014). But they also risk cord shaving (i.e., downgrading video services) from their traditional pay-TV subscribers and higher churn (i.e., subscriber turnover). Charles Ergen, CEO of DISH, acknowledged that the churn for low-cost Sling TV was higher than for other services, but he also added that subscribers “tend to come back over a period of time” (Williams, 2016).
Decline of MVPD Subscription
As shown in Table 7.3, the MVPD penetration (MVPD subscribers/TV households) was 77% in 2017. The number of basic cable subscribers decreased by 4% from 2014 (54.0 million) to 2017 (51.9 million). For the DBS and telco (telephone company) providers, the subscriber decline was even worse (6% and 18%, respectively). Interestingly, the subscriber gap between these providers and their cable rivals has been widening in recent years (see Table 7.3). Kagan projected that this gradual decline in MVPD subscription would continue in 2018. It expected that the (traditional) MVPD penetration would fall to 73% in 2018, down from 81% in 2016 and 85% in 2014.
Table 7.3
U.S. Multichannel Video Industry Benchmarks (in millions), 2014-2018

Note. All figures are estimates. These counts exclude virtual MVPD subscribers.
Source: Kagan. Reprinted with permission
The media research firm also noted that cable networks continue to lose subscribers, due to carriage cancellation by MVPDs and cord-cutting or shaving by consumers. Nielsen’s universe estimates for 99 cable networks dropped by an average compound annual growth rate (CAGR) of 1.4% for each year from January 2014 to January 2018 (Robson, 2018). It is unclear whether the subscriber losses in the multichannel video sector will slow down or stabilize through a combination of TVE and skinny bundle marketing strategies.
Table 7.4
Top Ten MVPDs in the United States, as of December 2017 (in thousands)
Company |
Subscribers |
|---|---|
AT&T (DirecTV/U-verse) |
24,116 |
Comcast |
22,357 |
Charter Communications |
16,997 |
DISH Network |
11,030 |
Verizon Communications (FiOS) |
4,619 |
Cox Communications |
3,852 |
Cablevision Systems (Altice-owned) |
2,470 |
Suddenlink Communications (Altice-owned) |
1,112 |
Frontier Communications |
961 |
Mediacom Communications |
821 |
Estimated total U.S. MVPD market |
93,973 |
Note. These counts exclude virtual MVPD subscribers.
Source: Kagan. Reprinted with permission
The ranking of the top MVPDs changed dramatically in 2015 with AT&T’s acquisition of DirecTV. As indicated in Table 7.4, the top four providers served 79% of all MVPD subscribers at the end of 2017, generating a high degree of concentration in that industry (see Hoskins et al., 2004). All 10 MVPDs listed accounted for a 94% share of the estimated total MVPD market. We should note that this table reports the number of subscribers for Cablevision and Suddenlink separately, even though both companies are owned by European-based Altice.
Factors to Watch
MVPD Consolidation
Scale is perhaps the most important economic strategy in the media business because it allows a larger media firm to reduce input costs (e.g., programming costs) and derive competitive advantages against rivals (e.g., channel revenues and advertising opportunities). AT&T Entertainment Group CEO John Stankey pointed out that “[w]e didn’t buy DirecTV because we love satellite exclusively as a distribution medium; we bought it because it gave us scale in entertainment and scale in distribution of entertainment” (Broadcasting & Cable, 2016, p. 19).
Major consolidation of distribution and programming sectors continues against a backdrop of substantial existing horizontal ownership concentrations. For example, after completing the acquisition of Suddenlink in December 2015, European-based Altice continued to grow with the purchase of Cablevision Systems for $18 billion. In June 2016, Altice became the fourth largest cable operator in the nation, serving 4.6 million video and broadband subscribers. The company announced that it would “squeeze some $900 million in cost savings out of the consolidation of Cablevision and Suddenlink within three years of the deal’s closing” (Littleton, 2016).
In October 2016, AT&T announced its intention to buy the programming conglomerate Time Warner for $85 billion ($108 billion including debt). In November 2017, the U.S. Department of Justice filed suit against the transaction, arguing that the vertical integration of AT&T’s distribution networks with Time Warner’s programming networks could lead to anti-competitive behavior against rival MVPDs and slow the growth of emerging online distributors (U.S. v. AT&T, 2017). Time Warner’s holdings include Turner Networks (with its sports holdings), HBO, CNN, music interests, and more. In December 2017, Disney, the world’s biggest content creator, paid over $52 billion to acquire key programming assets from 20th Century Fox (Farrell, 2017).
Government has a number of tools to protect consumers from potentially anticompetitive consequences from completed mergers, including divestiture, imposition of behavioral conditions, or both, before granting approval. For example, in April 2016, the U.S. Department of Justice approved Charter Communications’ $65.5 billion acquisition of two major MSOs, Time Warner Cable and Bright House Networks, subject to pro-competition and consumer-friendly restrictions. Charter agreed to comply with the following key conditions (Eggerton, 2016; Kang & Steel, 2016):
The seismic consolidations are likely to continue, but companies ripe for takeover are shrinking. Some companies are exploring more expansion abroad, with Comcast offering $31 billion for satellite service Sky (Farrell, 2018b). Normal consolidation will likely continue between smaller-size operators, but only once the giants sort it out.
Cord-Cutting
By 2018, there was no doubt that cord-cutting (i.e., cancelling MVPD service in favor of alternatives—often OTT services) has adversely affected the number of MPVP subscriptions and associated revenues. A 2015 online survey from Forrester revealed that 24% of surveyed U.S. adults did not pay for cable, which included 18% of cord-nevers and 6% of cord-cutters (Lynch, 2015). More worrisome for the cable industry was the projection that only 50% of consumers aged 18 to 31 would subscribe to cable by 2025. In the more recent Lendu poll conducted in December 2017, 56% of the respondents reported that they did not think they would still be cable subscribers in five years (Lafayette, 2018a).
From Table 7.5. it is clear that the annual subscriber losses due to cord-cutting are substantial for traditional MVPDs. These operators shed more than an estimated 6 million subscribers in the last five years, and there are few signs of abatement for 2018. One writer even compared the evolution of cord-cutting to the continuous gradual decline of broadcast network audiences: “Each year the networks argued to advertisers, that at some point, the ratings decline would begin to stabilize” (Adgate, 2017).
The main reasons for cutting the cord have remained consistently the same over time: cost of MVPD service (factor mentioned by 87% of respondents without pay-TV service in late 2017); use of streaming services (40%) and use of an over-the-air antenna for reception of basic channels (23%; TiVo, 2018).
Table 7.5
Net Subscriber Adds and Losses for the Top Pay-TV Providers/MVPDs, 2010-2017*
Year |
All Top MVPDs |
Top Traditional MVPDs |
Top Virtual MVPDs |
|---|---|---|---|
2017 |
(1,493,245) |
(3,092,245) |
1,599,000 |
2016 |
(758,804) |
(1,903,804) |
1,145,000 |
2015 |
(398,067) |
(924,067) |
526,000 |
2014 |
(120,383) |
(163,383) |
43,000** |
2013 |
(39,615) |
(81,615) |
42,000** |
2012 |
173,192 |
161,192 |
12,000** |
2011 |
400,310 |
400,310 |
NA |
2010 |
569,227 |
569,227 |
NA |
Note. NA = not available. * The top pay-TV providers or multichannel video programming distributors (MVPDs) represent about 95% of the market. ** Subscriber data for the top Internet-delivered pay-TV providers or virtual multichannel video programming distributors (vMVPDs) from 2012 to 2014 originated from DISH’s Sling TV International service.
Source: Leichtman Research Group
The open question remains whether cord-cutting will eventually stop, even heralding a return to traditional MVPD subscription, or whether MVPD service will follow the path of the music or newspaper industries. For pay-TV providers, the options range from bad to catastrophic and may require them to rethink their video revenue model. On the very negative side, The Diffusion Group predicted that 30 million homes—about one third of the 94 million MVPD subscribers in 2017—would go without pay-TV service by 2030 (Baumgartner, 2017d).
It is also possible that viewers decide to re-subscribe to traditional MVPD service after missing the breadth of channels available in the MVPD line-up or being disappointed by the technical quality and content diversity of virtual MVPD service (see Baumgartner, 2018c; Lafayette, 2018b). For the long term, Nielsen has argued that the decline in pay-TV subscription may reverse itself by the changing viewing habits of older Millennials who have children; these cord-never Millennials may decide to become subscribers once they start families (Lafayette, 2016).
Virtual MVPD Service
Virtual multichannel video programming distributors (MVPD) are over-the-top (OTT) providers that offer low-cost and limited channel packages via streaming technology. The most popular vMVPD services include: Sling TV, DirecTV Now, PlayStation Vue, Hulu with Live TV, and YouTube TV. Monthly prices for packages range from $20 to $75 (Pierce, 2018).
As shown in Table 7.5, vMVPD service has grown to the detriment of traditional MVPD service. For instance, according to Kagan data, DISH Network lost more than 1 million subscribers in 2017 while Sling TV added more than 700,000 subscribers during the same year. But evaluating precisely this degree of cannibalization is nearly an impossible task without questioning the vMVPD subscribers. The Diffusion Group found that 54% of vMVPD subscribers were cord-cutters and only 9% were cord-nevers (Baumgartner, 2018a). UBS Securities predicted that the number of vMVPD subscribers could reach 15 million by 2020 (Farrell, 2016). Some critics, however, have argued that “[b]eing a vMVPD will remain a truly lousy business” (Baumgartner, 2018c) because its average revenue per user (ARPU) is lower and its churn is higher than that of traditional MVPD services (see Farrell, 2018c).
Smart Technology
In 2017, Comcast CEO Brian Roberts proclaimed that broadband was increasingly “the epicenter” of the company’s customer relationships, driving bundle strategies and generating more than $20 billion in annual revenue (James, 2017). In recent years, more cable operators have deployed gigabit Internet service using DOCSIS 3.1 and 3.0 technology in their footprints (Asaf, 2018). But while average Internet speeds have continued to increase, it is becoming apparent that residential broadband penetration is nearing its saturation point. According to Leichtman Research Group, 82% of U.S. homes subscribe to broadband service (Frankel, 2017). Thus, the growth of broadband service will slow down in the years to come with direct economic implications for cable operators (Baumgartner, 2017c).
Given this situation, it is not surprising that cable operators are considering alternative revenue streams, especially in the area of smart technology or Internet of Things (IoT). Smart home technology refers to Internet-connected devices used in the home, such as home security systems, thermostats, and lights. Cable operators are beginning to develop strategies to monetize these smart devices. For instance, according to Xfinity Home Senior Vice President and General Manager Daniel Herscovici, “Building partnerships with device makers and stitching them into an integrated ecosystem will help smart home products and services break into the consumer mainstream and create scale” (Baumgartner, 2017a). Using artificial intelligence techniques, Xfinity Home is working on voice-recognition applications to command home devices (Baumgartner, 2018b). (For more on IoT, see Chapter 12.)
Getting a Job
The dramatically changing MVPD marketplace offers an abundance of entry-level jobs and career paths for quick-learning, adaptable applicants. On the technology side, there is a growing demand for engineers and computer programmers working across dozens of initiatives from system security and cloud computing to network design and facilities management. As major mass media companies, MVPDs also offer a multifaceted set of employment opportunities on the business side, including management, marketing, public relations, business analysis, audience measurement, and much more. Opportunities abound for those with entrepreneurial spirit and being part of the television business often supplies a touch of glamour.
Bibliography
Adgate, B. (2017, December 7). Cord cutting is not stopping any time soon. Forbes. Retrieved from https://www.forbes.com.
Afflerbach, A, DeHaven, M., Schulhuf, M., & Wirth, E. (2015, January/February). Comparing cable and fiber networks. Broadband Communities. Retrieved from http://www.bbcmag.com.
American Television Alliance. (2018, January 9). Broadcasters shatter TV blackout record in 2017. Retrieved from http://www.americantelevisionalliance.org.
Asaf, K. (2018, February 20). DOCSIS drives gigabit internet closer to full availability in cable footprints. Multichannel Trends. Retrieved from https://platform.mi.spglobal.com.
Baar, A. (2015, October 19). TV Everywhere key to attracting Millennials. MarketingDaily. Retrieved from http://www.mediapost.com.
Baldwin, T. F., & McVoy, D. S. (1988). Cable communication (2nd ed.). Englewood Cliffs, NJ: Prentice Hall.
Baumgartner, J. (2016, April 27). TiVo: Big four broadcasters top ‘must keep’ list. Multichannel News. Retrieved from http://www.multichannel.com.
Baumgartner, J. (2017a, January 9). Home, where the smart is. Multichannel News. Retrieved from http://www.multichannel.com.
Baumgartner, J. (2017b, August 28). Direct-to-consumer models lead multiscreen push. Broadcasting & Cable. Retrieved from http://www.broadcastingcable.com
Baumgartner, J. (2017c, November 7). Broadband ‘inching toward saturation,’ analyst says. Multichannel News. Retrieved from http://www.multichannel.com.
Baumgartner, J. (2017d, November 29). ‘Legacy’ pay TV market to fall to 60% by 2030: Forecast. Multichannel News. Retrieved from http://www.multichannel.com.
Baumgartner, J. (2018a, February 12).Virtual MVPDs ended 2017 with 5.3M subs: Study. Multichannel News. Retrieved from http://www.multichannel.com.
Baumgartner, J. (2018b, February 26). Comcast builds dedicated voice team as functionality extends beyond TV. Multichannel News. Retrieved from http://www.multichannel.com.
Baumgartner, J. (2018c, March 1). Virtual MVPDs growing ‘like weeds’: Analyst. Multichannel News. Retrieved from http://www.multichannel.com.
Baumgartner, J. (2018d, March 12). Study: No ‘magic bullet’ for the new bundle. Broadcasting & Cable. Retrieved from http://www.broadcastingcable.com.
Besen, S. M., & Crandall, R.W. (1981). The deregulation of cable television. Journal of Law and Contemporary Problems, 44, 77-124.
Bradshaw, J. (2016, March 1). The skinny on skinny basic TV. The Globe and Mail. Retrieved from http://www.theglobeandmail.com.
Bray, H. (2014, April 28). Amid new technologies, TV is at a turning point. Boston Globe. Retrieved from http://www.bostonglobe.com.
Broadcasting & Cable. (2016, March 7). 146(9), 19.
Cable Communications Policy Act of 1984, 47 U.S.C. §551 (2011).
Cable Television Consumer Protection and Competition Act of 1992, 47 U.S.C. §§521-522 (2011).
Cablevision Systems Corp. (2014). About multi-room DVR. Retrieved from http://optimum.custhelp.com/app/answers/detail/a_id/2580/kw/dvr/related/1.
Canadian Radio-television and Telecommunications Commission. (2015). A world of choice (Broadcasting Regulatory Policy CRTC 2015-96). Retrieved from http://crtc.gc.ca.
Corning, Inc. (2005). Broadband technology overview white paper: Optical fiber. Retrieved from http://www.corning.com/docs/opticalfiber/wp6321.pdf.
Crowley, S. J. (2013, October). Capacity trends in direct broadcast satellite and cable television services. Paper prepared for the National Association of Broadcasters. Retrieved from http://www.nab.org.
Dreier, T. (2014, March 10). SXSW ‘14: ESPN ‘frustrated and disappointed’ by TV Everywhere. Streaming Media. Retrieved from http://www.streamingmedia.com.
Dulac, S., & Godwin, J. (2006). Satellite direct-to-home. Proceedings of the IEEE, 94, 158-172. doi: 10.1109/JPROC.2006.861026.
Duverney, D. D. (1985). Implications of the 1983 regional administrative radio conference on direct broadcast satellite services: A building block for WARC-85. Maryland Journal of International Law & Trade, 9, 117-134.
Eggerton, J. (2015, December 17). FCC’s Wheeler: MVPD redefinition still on ‘pause.’ Broadcasting & Cable. Retrieved from http://www.broadcastingcable.com.
Eggerton, J. (2016, April 25). FCC proposes Charter-Time Warner Cable merger conditions. Broadcasting & Cable. Retrieved from http://www.broadcastingcable.com.
Farrell, M. (2016, September 20). Study: Virtual MVPDs could lure 15M subs by 2020. Multichannel News. Retrieved from http://www.multichannel.com.
Farrell, M. (2017, December 14). Disney pulls Fox trigger 20th Century Fox studios, FX, NatGeo, regional sports nets and more enter Magic Kingdom. Multichannel News. Retrieved from http://www.multichannel.com.
Farrell, M. (2018a, February 21). Sling TV ends year with 2.2M subscribers. Multichannel News. Retrieved from http://www.multichannel.com.
Farrell, M. (2018b, March 1). Burke: Comcast has long had its eye on Sky. Broadcasting & Cable. Retrieved from http://www.broadcastingcable.com.
Farrell, M. (2018c, March 5). Small dish, deep decline. Multichannel News. Retrieved from http://www.multichannel.com.
Federal Communications Commission. (1965). Rules re microwave-served CATV (First Report and Order), 38 FCC 683.
Federal Communications Commission. (1966). CATV (Second Report and Order), 2 FCC2d 725.
Federal Communications Commission. (1969). Commission’s rules and regulations relative to community antenna television systems (First Report and Order), 20 FCC2d 201.
Federal Communications Commission. (1970). CATV (Memorandum Opinion and Order), 23 FCC2d 825.
Federal Communications Commission. (1972a). Commission’s rules and regulations relative to community antenna television systems (Cable Television Report and Order), 36 FCC2d 143.
Federal Communications Commission. (1972b). Establishment of domestic communications- satellite facilities by nongovernmental entities (Second Report and Order), 35 FCC2d 844.
Federal Communications Commission. (1980). Notice of Inquiry, 45 F.R. 72719.
Federal Communications Commission. (1982). Inquiry into the development of regulatory policy in regard to direct broadcast satellites for the period following the 1983 Regional Administrative Radio Conference (Report and Order), 90 FCC2d 676.
Federal Communications Commission. (2010). Sky Angel U.S., LLC emergency petition for temporary standstill (Order), 25 FCCR 3879.
Federal Communications Commission. (2013a). Definitions, 47 CFR 76.1902.
Federal Communications Commission. (2013b). Report on Cable Industry Prices, 28 FCCR 9857.
Federal Communications Commission. (2014a). Promoting innovation and competition in the provision of multichannel video programming distribution services (Notice of Proposed Rulemaking), 29 FCCR 15995.
Federal Communications Commission. (2014b). Amendment of the Commission rules related to retransmission consent (Report and Order and Further Notice of Proposed Rulemaking), 29 FCCR 3351.
Federal Communications Commission. (2015a). Annual assessment of the status of competition in the market for the delivery of video programming (Sixteenth Report), 30 FCCR 3253.
Federal Communications Commission. (2015b). Implementation of Section 103 of the STELA Reauthorization Act of 2014: Totality of the circumstances test (Notice of Proposed Rulemaking), 30 FCCR 10327.
Federal Communications Commission. (2016). Television broadcast stations on satellite. Retrieved from https://www.fcc.gov.
Federal Communications Commission. (2017). Annual assessment of the status of competition in the market for the delivery of video programming (Eighteenth Report), 32 FCCR 568.
Fowler, G. A. (2015, January 26). Sling TV: A giant step from cable. The Wall Street Journal. Retrieved from http://online.wsj.com.
Frankel, D. (2017, December 13). Residential internet penetration has grown only 1% since 2012, LRG says. FierceCable. Retrieved from https://www.fiercecable.com.
GfK. (2015, December 16). Over half of viewers in pay TV homes have used “TV Everywhere” services—up from 2012 (Press Release). Retrieved from http://www.gfk.com.
Hagey, K., & Ramachandran, S. (2014, October 9). Pay TV’s new worry: ‘Shaving’ the cord. The Wall Street Journal. Retrieved from http://www.wsj.com.
Holloway, D. (2014, March 19). Next TV: Hulu sale uncertainty swayed CBS’ SVOD deals. Broadcasting & Cable. Retrieved from http://www.broadcastingcable.com.
Home Box Office v. FCC, 567 F.2d 9 (D.C. Cir. 1977).
Hoskins, C., McFadyen, S., & Finn, A. (2004). Media economics: Applying economics to new and traditional media. Thousand Oaks, CA: Sage.
Huddleston, T. (2015, August 3). Here’s AT&T’s first TV plan after buying DirecTV. Fortune. Retrieved from http://fortune.com.
James, M. (2015, August 14). Consumers want fewer TV channels and lower monthly bills – will ‘skinny’ packages work? Los Angeles Times. Retrieved from http://www.latimes.com.
James, S. B. (2017, October 26). Broadband the ‘epicenter’ of Comcast customer relationships, CEO says. S&P Global Market Intelligence. Retrieved from https://platform.mi.spglobal.com.
Jessell, H. A. (2017, September 29). Retrans saved local TV, now what? TVNewsCheck. Retrieved from http://www.tvnewscheck.com.
Kang, C., & Steel, E. (2016, April 25). Regulators approve Charter Communications deal for Time Warner Cable. The New York Times. Retrieved from http://www.nytimes.com.
Lafayette, J. (2014, April 28). Young viewers streaming more, pivot study says. Broadcasting and Cable. Retrieved from http://www.broadcastingcable.com.
Lafayette, J. (2016, March 28). Nielsen: Pay TV subs could stabilize. Broadcasting and Cable, 146(12), 4.
Lafayette, J. (2018a, January 29). Cord cutters say they’re saving money, poll says. Broadcasting and Cable. Retrieved from http://www.broadcastingcable.com.
Lafayette, J. (2018b, March 14). Cord cutters not returning to pay TV, TiVo Q4 study finds. Broadcasting and Cable. Retrieved from http://www.broadcastingcable.com.
Leichtman Research Group. (2015, 3Q). 83% of U.S. households subscribe to a pay-TV service. Research Notes. Retrieved from http://www.leichtmanresearch.com.
Leichtman Research Group. (2016, 1Q). DVRs leveling off at about half of all TV households. Research Notes. Retrieved from http://www.leichtmanresearch.com.
Lenoir, T. (2014, January 14). High retrans stakes for multichannel operators in 2014. Multichannel Market Trends. Retrieved from https://platform.mi.spglobal.com.
Lenoir, T. (2018, March 15). Triple-play cable subs rebound in Q4’17, softening video decline. Multichannel Trends. Retrieved from https://platform.mi.spglobal.com.
Littleton, C. (2016, June 21). Altice completes Cablevision acquisition, creating no. 4 U.S. cable operator. Variety. Retrieved from http://variety.com.
Lynch, J. (2015, October 6). New study says by 2025, half of consumers under 32 won’t pay for cable. Adweek. Retrieved from http://www.adweek.com.
McCord, L. (2014, April 29). Study: 61% of frequent binge-viewers millennials. Broadcasting & Cable. Retrieved from http://www.broadcastingcable.com.
National Cable and Telecommunications Association. (2014). Cable’s story. Retrieved from https://www.ncta.com.
National Conference of State Legislatures. (2014). Statewide video franchising statutes. Retrieved from http://www.ncsl.org/research/telecommunications-and-information-technology/statewide-video-franchising-statutes.aspx.
Nielsen. (2017, 2Q). The Nielsen total audience report. Retrieved from http://www.nielsen.com.
Nocera, J. (2007, November 24). Bland menu if cable goes a la carte. The New York Times. Retrieved from http://www.nytimes.com.
Owen, D. (1985, June). Satellite television. The Atlantic Monthly, 45-62.
Parker, J. G. (2011). Statewide cable franchising: Expand nationwide or cut the cord? Federal Communications Law Journal, 64, 199-222.
Parsons, P. (2008). Blue skies: A history of cable television. Philadelphia: Temple University Press.
Parsons, P. R., & Frieden, R. M. (1998). The cable and satellite television industries. Boston: Allyn and Bacon.
Pierce, D. (2018, February 14). Why you should cut cable—and what you’ll miss. The Wall Street Journal. Retrieved from http://online.wsj.com.
Prospero, M. (2017, May 26). Dish Hopper 3 review: The best just keeps getting better. Tom’s Guide. Retrieved from https://www.tomsguide.com/us/dish-hopper-3.review-3544.html.
Robson, S. (2018, January 12). Cable networks are losing subscribers as viewers change habits. Economics of Networks. Retrieved from https://platform.mi.spglobal.com.
Satellite Home Viewer Act. (1988). Pub. L. No. 100-667, 102 Stat. 3949 (codified at scattered sections of 17 U.S.C.).
Satellite Home Viewer Improvement Act. (1999). Pub. L. No. 106-113, 113 Stat. 1501 (codified at scattered sections in 17 and 47 U.S.C.).
STELA Reauthorization Act of 2014 (STELAR). 47 U.S.C. § 325(b)(3)(C).
TDG. (2014). How would you rank your experience with the ‘TV Everywhere’ authentication process? Statista. Retrieved http://www.statista.com.
Telecommunications Act. (1996). Pub. L. No. 104-104, 110 Stat. 56 (codified at scattered sections in 15 and 47 U.S.C.).
TiVo. (2018). Q4 2017 Video trends report. Retrieved from http://blog.tivo.com.
U.S. v. AT&T, Inc. (2017). Case 1:17-cv-02511. Retrieved from http://www.justice.gov.
U.S. v. Southwestern Cable Co., 392 U.S. 157 (1968).
Williams, J. (2016, March 1). Feeling the churn: A new model for OTT. SNL Financial. Retrieved from https://plat-form.mi.spglobal.com.
Winslow, G. (2014, December 8). Operators look for TV Everywhere to live up to its name. Broadcasting & Cable, 144(44), 8-9.
_______________
*Driscoll is Associate Professor and Vice Dean for Academic Affairs, Department of Journalism and Media Management, University of Miami (Coral Gables, Florida) and Dupagne is Professor in the same department.