Chapter 10. Select the Appropriate Security Assessment Tool
This chapter covers the following topics:
Network Tool Types: This section covers the types of tools used to perform security assessments of networks, including port scanners, vulnerability scanners, protocol analyzers, SCAP scanners, network enumerators, fuzzers, HTTP interceptors, exploitation tools and frameworks, visualization tools, and log reduction and analysis tools.
Host Tool Types: This section describes the tools used to assess vulnerabilities that might be present on an individual host. These types of tools include password crackers, vulnerability scanners, command-line tools, local exploitation tools and frameworks, SCAP tools, file integrity monitoring utilities, log analysis tools, antivirus, and reverse engineering tools.
Physical Security Tools: This section covers devices used to assess the physical security of an environment, including lock picks, RFID tools, and IR cameras.
This chapter covers CAS-003 objective 3.2
While most people think in terms of the network when they consider security assessments, security assessments encompass much more than this. If only network security were considered, major vulnerabilities would be left exposed. It can be argued that without sufficient physical security, network security cannot be achieved. Moreover, when exercising a defense-in-depth strategy, security must be considered at the network, host, and physical levels. This chapter looks at the tools used to perform assessments at each of these levels.
Network Tool Types
Before it can secure a network, an organization must determine where security weaknesses exist. The only way to do this is to make an honest assessment of the current state of the network. Considering the multitude of types of weaknesses that can exist in a network, multiple methods of assessment should be used. This chapter discusses specific tools used for assessment and the weakness each is designed to reveal.
Port Scanners
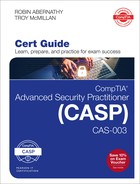
Internet Control Message Protocol (ICMP) messages can be used to scan a network for open ports. Open ports indicate services that may be running and listening on a device that may be susceptible to attack. An ICMP attack, or port scanning attack, basically pings every address and port number combination and keeps track of which ports are open on each device as the pings are answered by open ports with listening services and not answered by closed ports. One of the most widely used port scanners is Network Mapper (Nmap), a free and open source utility for network discovery and security auditing. Figure 10-1 shows the output of a scan using Zenmap, an Nmap security scanner GUI. Starting in line 12 of the output shown in this figure, you can see that the device at 10.68.26.11 has seven ports open:
Discovered open port 139/tcp on 10.68.26.11
Discovered open port 155/tcp on 10.68.26.11
Discovered open port 554/tcp on 10.68.26.11
Discovered open port 3389/tcp on 10.68.26.11
Discovered open port 445/tcp on 10.68.26.11
Discovered open port 2869/tcp on 10.68.26.11
Discovered open port 10243/tcp on 10.68.26.11
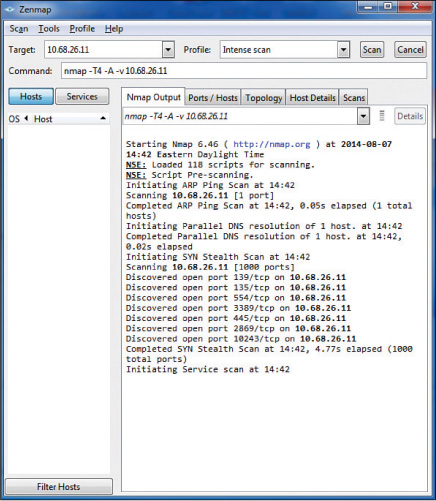
Figure 10-2 shows output from the command-line version of Nmap. You can see in this figure that a ping scan of an entire network just completed. From it you can see that the computer at 172.16.153.242 has three ports open: 23, 443, and 8443. However, the computer at 172.16.153.253 has no open ports. The term filtered in the output means that the ports are not open. To obtain this output, the command Nmap 172.16.153.0/23 was executed, instructing the scan to include all computers in the 172.16.153.0/23 network.
In a scenario where you need to determine what applications and services are running on the devices in your network, a port scanner would be appropriate.
Network Vulnerability Scanners
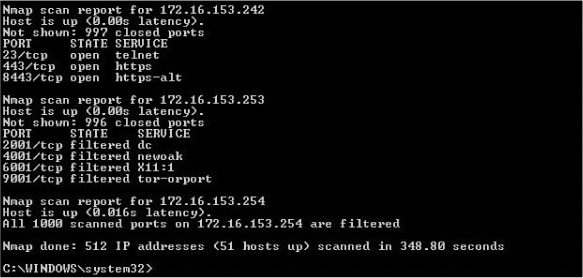
Whereas a port scanner can discover open ports, a vulnerability scanner can probe for a variety of security weaknesses, including misconfigurations, out-of-date software, missing patches, and open ports. Network vulnerability scanners scan an entire network. One of the most widely used vulnerability scanners is Nessus, a proprietary tool developed by Tenable Network Security. It is free of charge for personal use in a non-enterprise environment. Figure 10-3 shows a partial screenshot of Nessus. By default, Nessus starts by listing at the top of the output the issues found on a host that are rated with the highest severity.
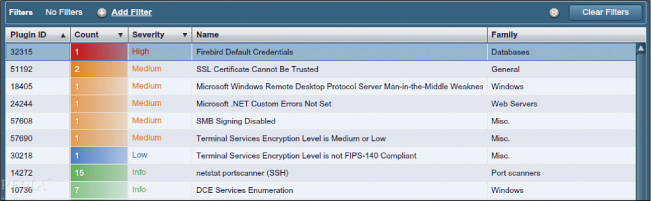
For the computer scanned in Figure 10-3, there is one high-severity issue (the default password for a Firebird database located on the host), and there are five medium-level issues, including two SSL certificates that cannot be trusted and a remote desktop man-in-the-middle attack vulnerability.
When security weaknesses in a network go beyond open ports—such as when you have cases of weak passwords, misconfigurations, and missing updates—a vulnerability scanner would be the appropriate tool.
Protocol Analyzer
Sniffing is the process of capturing packets for analysis; sniffing used maliciously is referred to as eavesdropping. Sniffing occurs when an attacker attaches or inserts a device or software into the communication medium to collect all the information transmitted over the medium. Sniffers, also called protocol analyzers, collect raw packets from the network; both legitimate security professionals and attackers use them. The fact that a sniffer does what it does without transmitting any data to the network is an advantage when the tool is being used legitimately and a disadvantage when it is being used against you (because you cannot tell you are being sniffed). Organizations should monitor and limit the use of sniffers. To protect against their use, you should encrypt all traffic on the network, where possible.
Wired
One of the most widely used sniffers is Wireshark. It captures raw packets off the interface on which it is configured and allows you to examine each packet. If the data is unencrypted, you will be able to read the data. Figure 10-4 show an example of Wireshark in use.
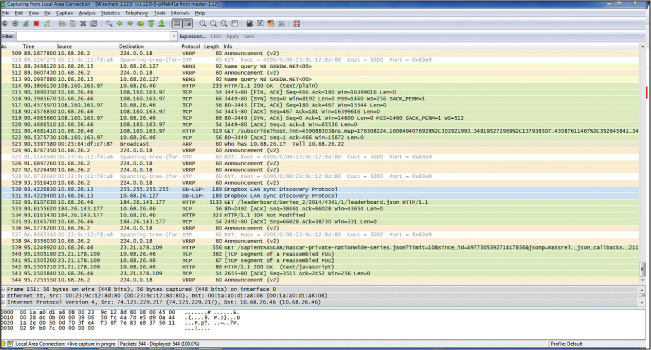
In the output shown in Figure 10-4, each line represents a packet captured on the network. You can see the source IP address, the destination IP address, the protocol in use, and the information in the packet. For example, line 511 shows a packet from 10.68.26.15 to 10.68.16.127, which is a NetBIOS name resolution query. Line 521 shows an HTTP packet from 10.68.26.46 to a server at 108.160.163.97. Just after that, you can see the server sending an acknowledgement back. To try to read the packet, you would click on the single packet. If the data were cleartext, you would be able to read and analyze it. So you can see how an attacker could acquire credentials and other sensitive information.
Protocol analyzers can be of help whenever you need to see what is really happening on your network. For example, say you have a security policy that says certain types of traffic should be encrypted. But you are not sure that everyone is complying with this policy. By capturing and viewing the raw packets on the network, you would be able to determine whether users are complying.
Wireless
Wireless frames can also be captured and analyzed with protocol analyzers. In Figure 10-5 Wireshark has captured the process of a device locating the access point (AP) with a probe request packet (frames 791 and 792), the AP answering with a probe response (frames 798 and 799), the device attempting authentication and association with the AP (frames 804–810), and the AP requesting user credentials as an EAP message in frames 811 and 812.
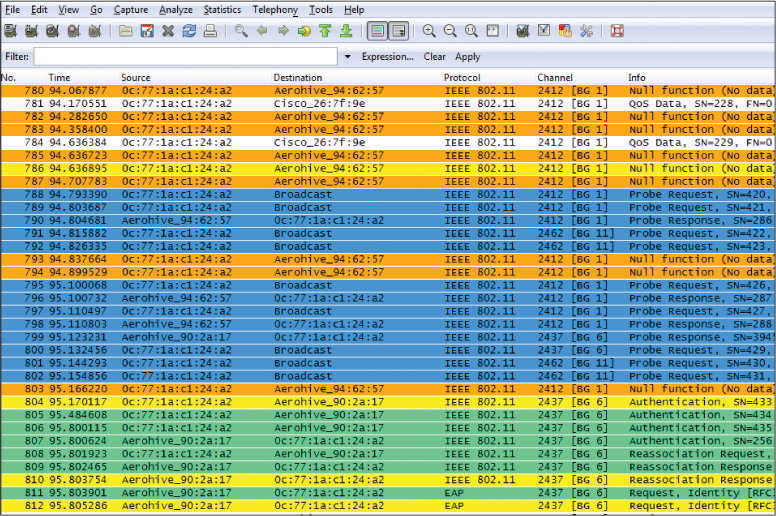
We know this is 802.11 traffic because there are many frame types not found in wired networks, such as the probe request and probe response frames.
SCAP Scanner
Security Content Automation Protocol (SCAP) is a standard that the security automation community uses to enumerate software flaws and configuration issues. It standardized the nomenclature and formats used. A vendor of security automation products can obtain a validation against SCAP, demonstrating that it will interoperate with other scanners and express the scan results in a standardized way.
Understanding the operation of SCAP requires an understanding of its components:

Common Configuration Enumeration (CCE): These are configuration best practice statements maintained by the National Institute of Standards and Technology (NIST).
Common Platform Enumeration (CPE): These are methods for describing and classifying operating systems, applications, and hardware devices.
Common Weakness Enumeration (CWE): These are design flaws in the development of software that can lead to vulnerabilities.
Common Vulnerabilities and Exposures (CVE): These are vulnerabilities in published operating systems and applications software.
The Common Vulnerability Scoring System (CVSS) is a system of ranking vulnerabilities that are discovered based on predefined metrics. This system ensures that the most critical vulnerabilities can be easily identified and addressed after a vulnerability test is met. Scores are awarded on a scale of 0 to 10, with the values having the following ranks:
0: No issues
1.0 to 3.9: Low
4.0 to 6.9: Medium
7.0 to 8.9: High
9.0 to 10.0: Critical
CVSS is composed of three metric groups:
Base: Characteristics of a vulnerability that are constant over time and across user environments
Temporal: Characteristics of a vulnerability that change over time but not among user environments
Environmental: Characteristics of a vulnerability that are relevant and unique to a particular user’s environment
The base metric group includes the following metrics:
Access Vector (AV): AV describes how the attacker would exploit the vulnerability and has three possible values:
L: Stands for local and means that the attacker must have physical or logical access to the affected system.
A: Stands for adjacent network and means that the attacker must be on the local network.
N: Stands for network and means that the attacker can cause the vulnerability from any network.
Access Complexity (AC): AC describes the difficulty of exploiting the vulnerability and has three possible values:
H: Stands for high and means that the vulnerability requires special conditions that are hard to find.
M: Stands for medium and means that the vulnerability requires somewhat special conditions.
L: Stands for low and means that the vulnerability does not require special conditions.
Authentication (Au): The Au metric describes the authentication an attacker would need to get through to exploit the vulnerability and has three possible values:
M: Stands for multiple and means that the attacker would need to get through two or more authentication mechanisms.
S: Stands for single and means that the attacker would need to get through one authentication mechanism.
N: Stands for none and means that no authentication mechanisms are in place to stop the exploit of the vulnerability.
Availability (A): The A metric describes the disruption that might occur if the vulnerability is exploited and has three possible values:
N: Stands for none and means that there is no availability impact.
P: Stands for partial and means that system performance is degraded.
C: Stands for complete and means that the system is completely shut down.
Confidentiality (C): The C metric describes the information disclosure that may occur if the vulnerability is exploited and has three possible values:
N: Stands for none and means that there is no confidentiality impact.
P: Stands for partial and means some access to information would occur.
C: Stands for complete and means all information on the system could be compromised.
Integrity (I): The I metric describes the type of data alteration that might occur and has three possible values:
N: Stands for none and means that there is no integrity impact.
P: Stands for partial and means some information modification would occur.
C: Stands for complete and means all information on the system could be compromised.
The CVSS vector looks something like this:
CVSS2#AV:L/AC:H/Au:M/C:P/I:N/A:N
This vector is read as follows:
AV:L: Access vector, where L stands for local and means that the attacker must have physical or logical access to the affected system.
AC:H: Access complexity, where H stands for high and means that the vulnerability requires special conditions that are hard to find.
Au:M: Authentication, where M stands for multiple and means that the attacker would need to get through two or more authentication mechanisms.
C:P: Confidentiality, where P stands for partial and means that some access to information would occur.
I:N: Integrity, where N stands for none and means that there is no integrity impact.
A:N: Availability, where N stands for none and means that there is no availability impact.
Permissions and Access
Access to scanning tools must be closely controlled because scanning devices without being authorized to do so is a crime. The group of users allowed to use these tools should be as small as possible. The use of these tools should also be audited to ensure that the tools are being used in accordance with the rules of engagement.
Execute Scanning
Configuring a scan is somewhat specific to the scanning product, but the following are some general recommendations with respect to conducting a scan:
Test the scanner for the environment and tackle the scan surgically rather than using a shotgun, all-at-once approach.
Critical business traffic and traffic patterns need to be factored into vulnerability scans because a scan itself adds to network traffic.
Give some thought to what time scans will be run and also to the time zones in which affected businesses operate.
These are the high-level steps in conducting a scan:
Step 1. Add IP addresses or domain names to the scan.
Step 2. Choose scanner appliances (hardware or software sensors).
Step 3. Select the scan option. For example, in Nessus, under Advanced Settings, you can use custom policy settings to alter the operation of the scan. The following are some selected examples:
auto_update_delay: Number of hours to wait between two updates. Four hours is the minimum allowed interval.
global.max_hosts: Maximum number of simultaneous checks against each host tested.
global.max_simult_tcp_sessions: Maximum number of simultaneous TCP sessions between all scans.
max_hosts: Maximum number of hosts checked at one time during a scan.
Step 4. Start the scan.
Step 5. View the scan status and results.
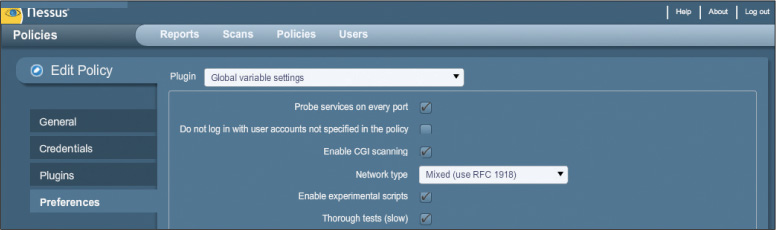
Figure 10-6 shows another option for editing a scan policy (and thus the operations of the scan), using check boxes and drop-down menus.
Network Enumerator
Network enumerators scan the network and gather information about users, groups, shares, and services that are visible—a process sometimes referred to as device fingerprinting. Network enumerators use protocols such as ICMP and SNMP to gather information. WhatsUp Gold is an example of such software. As you can see in Figure 10-7, it not only identifies issues with hosts and other network devices but allows you to organize and view the hosts by problem. It is currently set to show all devices. To see all devices with missing credentials, you could select the Devices Without Credentials folder in the tree view on the left.
![A screenshot shows Ipswitch WhatsUp Gold v14.0 [Network Explorer - All devices (dynamic group)] window.](http://images-20200215.ebookreading.net/9/4/4/9780134859538/9780134859538__comptia-advanced-security__9780134859538__graphics__10fig07.jpg)
As it is currently set, the output in Figure 10-7 shows all devices. In the details pane, you can see all devices listed by IP address and the type of device each is. For example, the highlighted device is a Cisco switch with the IP address 192.198.205.2.
In situations where you need to survey the security posture of all computers in the network without physically visiting each computer, you can use a network enumerator to find that information and organize it in helpful ways.
Fuzzer
Fuzzers are software tools that find and exploit weaknesses in web applications, in a process called fuzzing. They operate by injecting semi-random data into the program stack and then detecting bugs that result. They are easy to use, but one of the limitations is that they tend to find simple bugs rather than some of the more complex ones. The Open Web Application Security Project (OWASP), an organization that focuses on improving software security, recommends several specific tools, including JBroFuzz and WSFuzzer. HTTP-based Simple Object Access Protocol (SOAP) services are the main target of WSFuzzer.
A scenario in which a fuzzer would be used is during the development of a web application that will handle sensitive data. The fuzzer would help you to determine whether the application is properly handling error exceptions. For example, say that you have a web application that is still undergoing testing, and you notice that when you mistype your credentials in the login screen of the application, the program crashes, and you are presented with a command prompt. If you wanted to reproduce the issue for study, you could run an online fuzzer against the login screen.
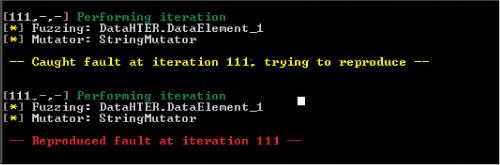
Figure 10-8 shows the output of a fuzzer called Peach. It is fuzzing the application with a mutator called StringMutator that continually alters the input over and over. You can see in this output that some input to the tool has caused a crash. Peach has verified the fault by reproducing it. It will send more detail to a log that you can read to understand exactly what string value caused the crash.
HTTP Interceptor
HTTP interceptors intercept web traffic between a browser and a website. They permit actions that the browser would not permit. For example, an HTTP interceptor may allow the input of 300 characters, while the browser may enforce a limit of 50. These tools allow you to test what would occur if a hacker were able to circumvent the limit imposed by the browser. An HTTP interceptor performs like a web proxy in that it monitors the traffic in both directions.
Some examples of HTTP interceptors are Burp Suite and Fiddler. Fiddler, a Windows tool, can also be configured to test the performance of a website, as shown in Figure 10-9.

The output in Figure 10-9 shows the connection statistics for a download from text.com. In the panel on the right, you see the elapsed time spent on each step in the process.
HTTP interceptors and fuzzers should both be used for testing web applications. They can also be used to test the proper validation of input.
Exploitation Tools/Frameworks
Exploitation tools, sometimes called exploit kits, are groups of tools used to exploit security holes. They are created for a wide variety of applications. These tools attack an application in the same way a hacker would, and so they can be used for good and evil. Some are free, while others, such as Core Impact, are quite expensive.
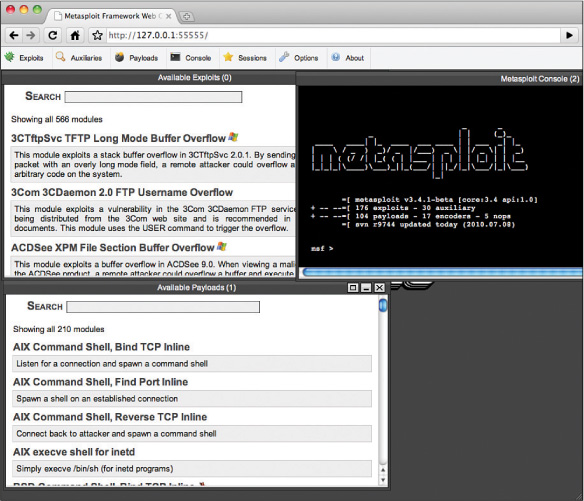
An exploit framework provides a consistent environment to create and run exploit code against a target. The three most widely used frameworks are:
Metasploit: This is an open source framework that ships with hundreds of exploits and payloads as well as many auxiliary modules.
Note
Kali Linux (an extremely popular operating system for pen testing) includes tools such as Metasploit and others.
CANVAS: Sold on a subscription model, CANVAS ships with more than 400 exploits.
IMPACT: This commercially available tool uses agent technology that helps an attacker gather information on the target.
Figure 10-10 shows the web interface of Metasploit. The attacker (or the tester) selects an exploit from the top panel and then a payload from the bottom. Once the attack is launched, the tester can use the console to interact with the host. Using these exploitation frameworks should be a part of testing applications for security holes.
Visualization Tools
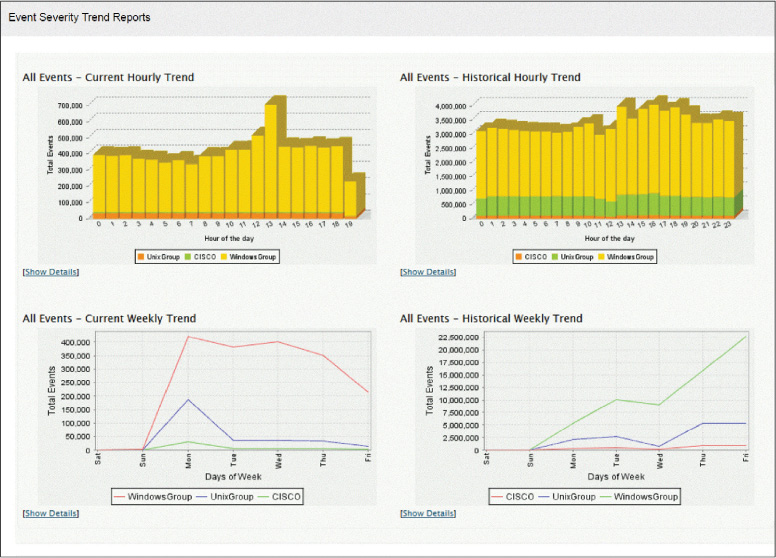
In many cases, the sheer amount of security data that is generated by the various devices located throughout our environments makes it difficult to see what is going on. When this same raw data is presented to us in some sort of visual format, it becomes somewhat easier to discern patterns and trends. Aggregating the data and graphing it makes it much easier to spot a trend.
For example, let’s say you were interested in getting a handle on the relative breakdown of security events between your Windows devices and your Linux devices. Most tools that handle this sort of thing (like security information and event management [SIEM] tools, covered in Chapter 5, “Network and Security Components, Concepts, and Architectures”) can not only aggregate all events of a certain type but graph them over time. Figure 10-11 shows examples of such graphs. Many of the tools discussed in this section would be considered visualization tools as they help you visualize and make sense of the raw data.
Log Reduction and Analysis Tools
Audit reduction tools are preprocessors designed to reduce the volume of audit records to facilitate manual review. Before a security review, these tools can remove many audit records known to have little security significance. These tools generally remove records generated by specified classes of events, such as records generated by nightly backups. Some technicians make use of scripts for this purpose. One such Perl script, called swatch (for “Simple WATCHer”), is used by many Linux technicians.
For large enterprises, the amount of log data that needs to be analyzed can be quite large. For this reason, many organizations implement a SIEM system, which provides an automated solution for analyzing events and deciding where the attention needs to be given.
Most SIEM products support two ways of collecting logs from log generators:
Agentless: With this type of collection, the SIEM server receives data from the individual hosts without needing to have any special software installed on those hosts. Some servers pull logs from the hosts, which is usually done by having the server authenticate to each host and retrieve its logs regularly. In other cases, the hosts push their logs to the server, which usually involves each host authenticating to the server and transferring its logs regularly. Regardless of whether the logs are pushed or pulled, the server then performs event filtering and aggregation and log normalization and analysis on the collected logs.
Agent based: With this type of collection, an agent program is installed on the host to perform event filtering and aggregation and log normalization for a particular type of log. The host then transmits the normalized log data to a SIEM server, usually on a real-time or near-real-time basis, for analysis and storage. Multiple agents may need to be installed if a host has multiple types of logs of interest. Some SIEM products also offer agents for generic formats such as Syslog and SNMP. A generic agent is used primarily to get log data from a source for which a format-specific agent and an agentless method are not available. Some products also allow administrators to create custom agents to handle unsupported log sources.
There are advantages and disadvantages to each method. The primary advantage of the agentless approach is that agents do not need to be installed, configured, and maintained on each logging host. The primary disadvantage is the lack of filtering and aggregation at the individual host level, which can cause significantly larger amounts of data to be transferred over networks and increase the amount of time it takes to filter and analyze the logs. Another potential disadvantage of the agentless method is that the SIEM server may need credentials for authenticating to each logging host. In some cases, only one of the two methods is feasible; for example, there might be no way to remotely collect logs from a particular host without installing an agent onto it.
SIEM products usually include support for several dozen types of log sources, such as operating systems, security software, application servers (for example, web servers, email servers), and even physical security control devices, such as badge readers. For each supported log source type, except for generic formats such as Syslog, the SIEM products typically know how to categorize the most important logged fields. This significantly improves the normalization, analysis, and correlation of log data over that performed by software with a less granular understanding of specific log sources and formats. Also, the SIEM software can perform event reduction by disregarding data fields that are not significant to computer security, potentially reducing the SIEM software’s network bandwidth and data storage usage. Figure 10-12 shows output from a SIEM system. Notice the various types of events that have been recorded.
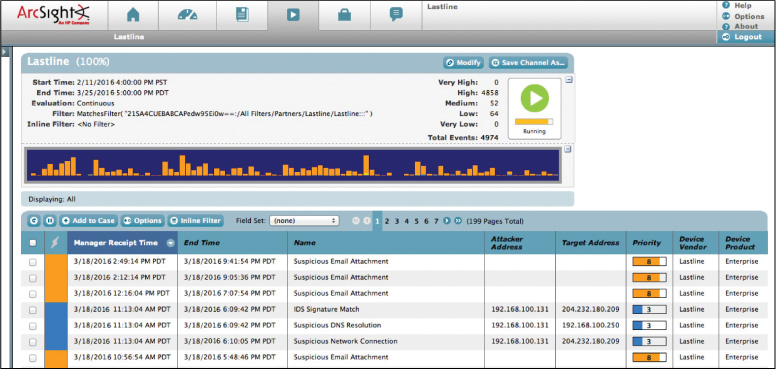
The tool in Figure 10-12 shows the name or category within which each alert falls (Name column), the attacker’s address, if captured (it looks as if 192.168.100.131 was captured), the target IP address (3 were captured), and the priority of the alert (Priority column). Given this output, the suspicious email attachments (high priority) need to be investigated. While only 4 show on this page, if you look at the top-right corner, you can see that there are a total of 4,858 alerts with high priority, many of which are likely to be suspicious email attachments.
Host Tool Types
In some cases, you are concerned with assessing the security of a single host rather than the network in general. This section looks at tools that are appropriate for assessing host security and issues for which they might be indicated.
Password Cracker
Password crackers are programs that do what their name implies: They attempt to identify passwords. These programs can be used to mount several types of password attacks, including dictionary attacks and brute-force attacks.
In a dictionary attack, an attacker uses a dictionary of common words to discover passwords. An automated program uses the hash of the dictionary word and compares this hash value to entries in the system password file. While the program comes with a dictionary, attackers also use extra dictionaries that are found on the Internet. To protect against these attacks, you should implement a security rule which says that a password must not be a word found in the dictionary.
Brute-force attacks are more difficult to perform because they work through all possible combinations of numbers and characters. These attacks are also very time-consuming.
The best countermeasures against password threats are to implement complex password policies, require users to change passwords on a regular basis, employ account lockout policies, encrypt password files, and use password-cracking tools to discover weak passwords.
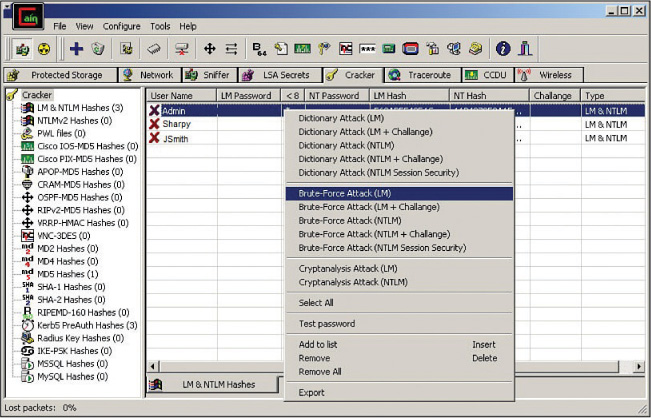
One of the most well-known password-cracking programs is Cain and Abel, which can recover passwords by sniffing the network; cracking encrypted passwords using dictionary, brute-force, and cryptanalysis attacks; recording VoIP conversations; decoding scrambled passwords; revealing password boxes; uncovering cached passwords; and analyzing routing protocols. Figure 10-13 shows sample output of this tool. As you can see, an array of attacks can be performed on each located account. This example shows a scan of the local machine for user accounts in which the program has located three accounts: Admin, Sharpy, and JSmith. By right-clicking the Admin account, you can use the program to perform a brute-force attack on that account—or a number of other attacks.
Another example of a password cracker is John the Ripper. It can work in UNIX/Linux as well as Mac systems. It detects weak UNIX passwords, though it supports hashes for many other platforms as well. John the Ripper is available in three versions: an official free version, a community-enhanced version (with many contributed patches but not as much quality assurance), and an inexpensive pro version.
If you are having difficulty enforcing strong or complex passwords and you need to identify weak passwords in the network, you could use a password cracker to find out which passwords are weak and possibly also crack them. If determining password security is time critical, you should upload the password file to one of your more capable machines (a cluster would be even better) and run the password cracker on that platform. This way, you can take advantage of the additional resources to perform the audit more quickly.
Host Vulnerability Scanners
Like network vulnerability scanners, host scanners scan for vulnerabilities—but only on the host on which the tool is installed. Many scanners can do both. The Microsoft Baseline Security Analyzer is a host scanner and can also scan multiple hosts at once. It returns a clean list of all vulnerabilities and prioritizes them, as shown in Figure 10-14.

Command Line Tools
Many local command-line utilities are available in both Windows and Linux/UNIX for making security assessments as well. While not as user friendly as some of the more automated tools, they are preferred by many of the more experienced in the field for their flexibility, while they do require more knowledge and background.
The following sections discuss several security-related command-line tools.
netstat
The netstat (network status) command is used to see what ports are listening on a TCP/IP-based system. The -a option is used to show all ports, and /? is used to show what other options are available. (The options differ in the different operating systems.) When executed with no switches, the command displays the current connections, as shown in Figure 10-15. You can use netstat to see what ports are open and what services/protocols are using them. These open ports could present a security risk to the host.
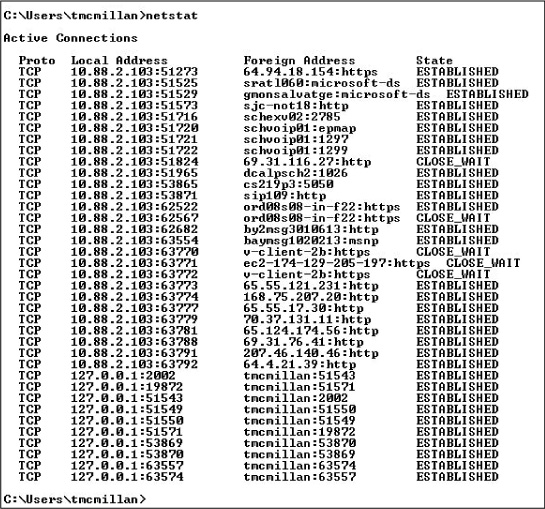
Each line of netstat output lists the source IP address and port number, the destination IP address or hostname, and the state of the connection. These are the possible states:
LISTEN: Represents waiting for a connection request from any remote TCP connection and port.
SYN-SENT: Represents waiting for a matching connection request after having sent a connection request.
SYN-RECEIVED: Represents waiting for a confirming connection request acknowledgment after having both received and sent a connection request.
ESTABLISHED: Represents an open connection, and data received can be delivered to the user. This is the normal state for the data transfer phase of the connection.
FIN-WAIT-1: Represents waiting for a connection termination request from the remote TCP connection or an acknowledgment of the connection termination request previously sent.
FIN-WAIT-2: Represents waiting for a connection termination request from the remote TCP connection.
CLOSE-WAIT: Represents waiting for a connection termination request from the local user.
CLOSING: Represents waiting for a connection termination request acknowledgment from the remote TCP connection.
LAST-ACK: Represents waiting for an acknowledgment of the connection termination request previously sent to the remote TCP connection (which includes an acknowledgment of its connection termination request).
You can use this tool to identify any improper active connections that may exist on a host system.
Table 10-1 lists other parameters that can be used with netstat.
Parameter |
Description |
-a |
Displays all connections and listening ports. |
-e |
Displays Ethernet statistics. |
-n |
Displays addresses and port numbers in numeric form instead of using friendly names. |
-s |
Displays statistics categorized by protocol. |
-p protocol |
Shows connections for the specified protocol, either TCP or UDP. |
-r |
Displays the contents of the routing table. |
ping
The ping command makes use of the ICMP protocol to test connectivity between two devices. ping is one of the most useful commands in the TCP/IP protocol. It sends a series of packets to another system, which in turn sends a response. The ping command can be extremely useful for troubleshooting problems with remote hosts.
The ping command indicates whether the host can be reached and how long it takes for the host to send a return packet. On a LAN, the time is indicated as less than 10 milliseconds. Across WAN links, however, this value can be much greater. When the -a parameter is included, ping also attempts to resolve the hostname associated with the IP address.
Figure 10-16 shows a successful ping.
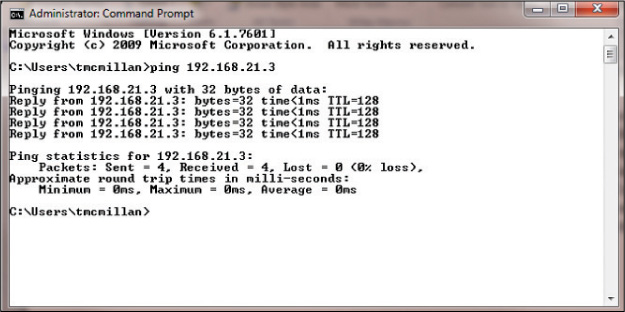
Figure 10-17 shows an unsuccessful ping. In this case, the request timed out, which typically means the host is off or disconnected from the network. When the destination cannot be reached, an error code is displayed. The most common of these codes are as follows:
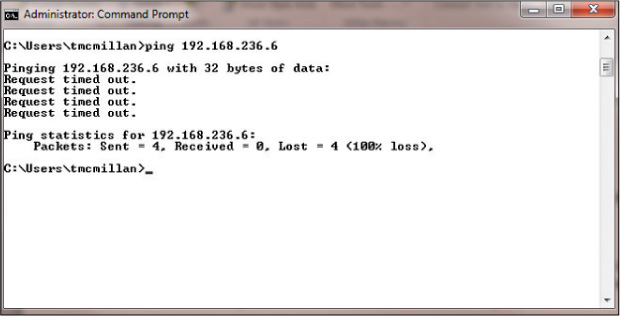
Destination Unreachable: This indicates that the IP datagram could not be forwarded. This also includes an error code (number) that indicates more detail—for example, that there is no routing table entry, or the destination is reachable but did not respond to ARP.
Request Timed Out: This indicates that the TTL of the datagram was exceeded. This means you did not even get a response from a router. This can occur if the router is configured to not respond to ICMP, which is not uncommon. This is the situation in Figure 10-17.
Although there are easier ways to do this with other tools, such as Nmap, you can perform a ping sweep by creating a simple batch file, as follows:
for /l %i in(1,1,254) do ping -n 1 -w 100 <first three octets of host network>.%i
For example, to sweep the 192.168.1.0 network, you use this command:
for /l %i in(1,1,254) do ping -n 1 -w 100 192.168.1.%i
tracert/traceroute
As discussed in Chapter 9, “Security Assessments,” the tracert command (called traceroute in Linux and UNIX) is used to trace the path of a packet through the network. Its best use is in determining exactly where in the network a packet is being dropped. It shows each hop (router) the packet crosses and how long it takes to do so. Figure 10-18 shows a partial display of a traced route to www.nascar.com.
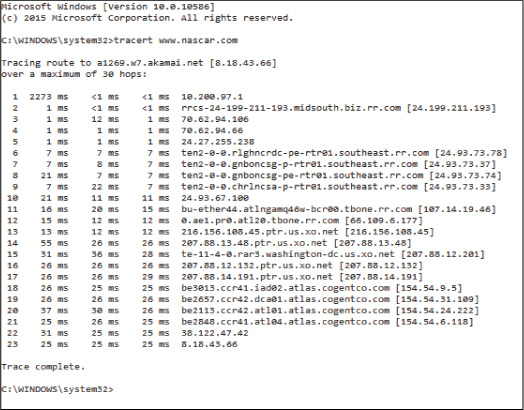
This command can also be used from within Nmap (Zenmap) to record the path to a target and present it graphically; these graphical results are sometimes easier to understand than command-line output. Each line represents a hop, or a network through which the communication crossed (that is, a router). It also indicates how long it took to cross each of those networks. Many times, these routes cannot be completely mapped because ICMP is blocked at the edge of the network in which the destination resides.
ipconfig/ifconfig
The ipconfig command is used to view the IP configuration of a device and, when combined with certain switches or parameters, can be used to release and renew the lease of an IP address obtained from a DHCP server and to flush the DNS resolver cache. Its most common use is to view the current configuration. Figure 10-19 shows its execution with the /all switch, which results in a display of a wealth of information about the IP configuration.

ipconfig can be used to release and renew a configuration obtained from a DHCP server by issuing first the ipconfig /release command followed by the ipconfig /renew command.
It is also helpful to know that when you have just corrected a configuration error (such as an IP address) on a destination device, you should ensure that the device registers its new IP address with the DNS server by executing the ipconfig /registerdns command.
It may also be necessary to clear incorrect IP address-to-hostname mappings that may still exist on the devices that were attempting to access the destination device. You can do this by executing the ipconfig /flushdns command.
If you are using a Linux or UNIX system, the command is not ipconfig but ifconfig. Figure 10-20 shows an example of the command and its output. The ifconfig command with -a option shows all network interface information, even if the network interface is down.

nslookup/dig
The nslookup and dig commands are discussed in Chapter 9. Now that you are familiar with the tools, consider how these tools can be used to enhance security. As they allow us to interact with the DNS server and even exchange and update records with the server (if allowed), they can be used to verify that such an exchange is not possible. Allowing such updates would allow DNS pollution, which can lead to users being directed to phishing sites.
Sysinternals
Sysinternals is a collection of more than 70 Windows tools that can be used for both troubleshooting and security issues. Some of the security-related utilities contained in Sysinternals are listed in Table 10-2.
Table 10-2 Sysinternals Security Utilities
Tool |
Use |
AccessChk |
Displays the access the user or group you specify has to files, Registry keys, or Windows services. |
AccessEnum |
Displays who has what access to directories, files, and Registry keys on your systems. |
Autoruns |
Displays programs that start up automatically when your system boots and you log in. |
LogonSessions |
Lists active logon sessions. |
PsLoggedOn |
Shows users logged on to a system. |
SDelete |
Overwrites sensitive files and cleanses free space of previously deleted files using this DoD-compliant secure delete program. |
ShareEnum |
Scans file shares on your network so you can view their security settings and close security holes. |
OpenSSL
OpenSSL is a library of software functions that support the use of the Secure Sockets Layer/Transport Layer Security ( SSL/TLS) protocol. Once OpenSSL is installed, a set of commands become available. OpenSSL is open source and written in C. The following are some of the functions you can perform with this tool:
Generate a certificate request
Generate a self-signed certificate
Generate a self-signed key
Test an SSL server
Local Exploitation Tools/Frameworks
Exploitation tools and the frameworks within which they operate provide powerful means to discover security issues. These tools are discussed earlier in this chapter, in the section “Exploitation Tools/Frameworks.”
A local exploit might be one in which certain exploits might be omitted because the targets are known to not be present in the environment. For example, you might omit Mac exploits when you don’t have any Mac computers. Or in another scenario, you may create an exploit for an in-house developed application.
SCAP Tool
Earlier in this chapter you learned about SCAP, a standard that the security automation community uses to enumerate software flaws and configuration issues. As the computing industry embraces the standard, tools and utilities are starting to make use of the nomenclature and formats used by SCAP.
A good example of this is the Window System Center Configuration Manager Extensions for SCAP. It allows for the conversion of SCAP data files to Desired Configuration Management (DCM) Configuration Packs and converts DCM reports into SCAP format.
File Integrity Monitoring
Many times, malicious software and malicious individuals make unauthorized changes to files. In many cases these files are data files, and in other cases they are system files. While alterations to data files are undesirable, changes to system files can compromise an entire system.
The solution is file integrity software that generates a hash value of each system file and verifies that hash value at regular intervals. This entire process is automated, and in some cases a corrupted system file will automatically be replaced when discovered.
While there are third-party tools such as Tripwire that do this, Windows offers the System File Checker (SFC) to do the same thing. The SFC is a command-line utility that checks and verifies the versions of system files on a computer. If system files are corrupted, the SFC will replace the corrupted files with correct versions.
The syntax for the SFC command is as follows:
SFC [switch]
The switches vary a bit between different versions of Windows. Table 10-3 lists the most common ones available for SFC.
Switch |
Purpose |
/CACHESIZE=X |
Sets the Windows File Protection cache size, in megabytes |
/PURGECACHE |
Purges the Windows File Protection cache and scans all protected system files immediately |
/REVERT |
Reverts SFC to its default operation |
/SCANFILE (Windows 7 and Vista only) |
Scans a file that you specify and fixes problems if they are found |
/SCANNOW |
Immediately scans all protected system files |
/SCANONCE |
Scans all protected system files once |
/SCANBOOT |
Scans all protected system files every time the computer is rebooted |
/VERIFYONLY |
Scans protected system files and does not make any repairs or changes |
/VERIFYFILE |
Identifies the integrity of the file specified and makes any repairs or changes |
/OFFBOOTDIR |
Does a repair of an offline boot directory |
/OFFFWINDIR |
Does a repair of an offline Windows directory |
Log Analysis Tools
Earlier in this chapter you learned how both scripts and filters can be used to reduce the clutter in the logs of network devices, so your focus can be on series events. However, most local audit logs contain their own built-in filters that can be used to focus attention on more serious events. These filters can be set as either display filters or capture filters.
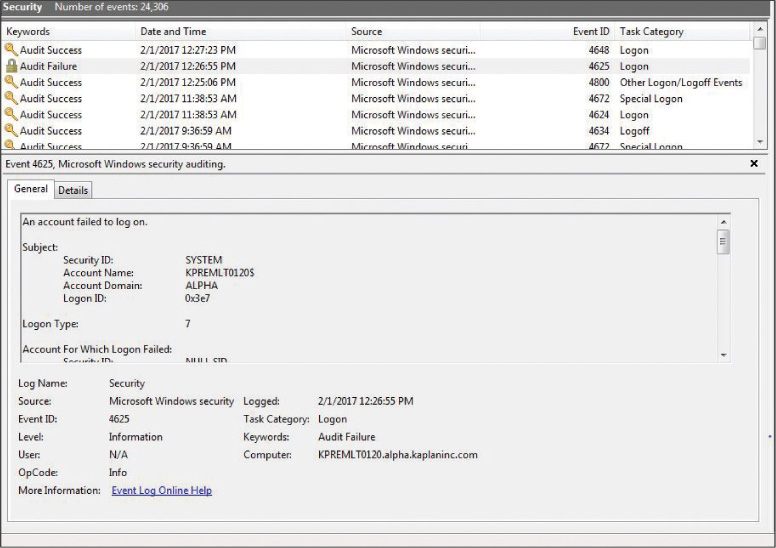
Let’s consider an example where you suspect a user has stolen the password of another user, and you would like to see if the suspect has used the password from his or her workstation. The clutter of security events can make it difficult to find what you are looking for. You could filter for only successful logon events. For example, in Figure 10-21 the Windows Security Log is filtering to show only Audit Success events.
Some good examples of log analysis tools are:
Loggly: This tool has both free and paid plans per month. It makes is easy to weed out noise and perform full text searches.
Logentries: This cloud-based system also comes in both free and paid plans. You can filter logs in real time and can tag important events, so you can return at a later time.
GoAccess: This terminal-based tool is open source and free to use. You can generate report in HTML or CSV format.
This tool has both free and paid (per month) plans. You can filter by application or use custom parameters.
Graylog: This open source tool has many large customers, such as Cisco. It makes it easy to parse logs from any data source, and it can search terabytes of data almost instantly.
Antivirus
While many scenarios that we face are new, one is not: the ever-present danger from malware. While many are still fighting this battle using traditional premises-based anti-malware tools, new approaches have emerged.
Cloud antivirus products run not on the local computer but in the cloud, creating a smaller footprint on the client and utilizing processing power in the cloud. They have the following advantages:
They allow access to the latest malware data within minutes of the cloud antivirus service learning about it.
They eliminate the need to continually update the antivirus software.
The client is small, and it requires little processing power.
Cloud antivirus products have the following disadvantages:
There is a client-to-cloud relationship, which means these products cannot run in the background.
They may scan only the core Windows files for viruses and not the whole computer.
They are highly dependent on an Internet connection.
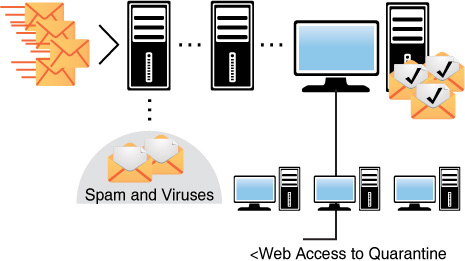
Anti-spam services can also be offered from the cloud. Vendors such as Postini and Mimecast scan your email and then store anything identified as problematic on their server, where you can look through the spam to verify that it is, in fact, spam. In this process, illustrated in Figure 10-22, the mail first goes through the cloud server, where any problematic mail is quarantined. Then the users can view the quarantined items through a browser at any time.
Reverse Engineering Tools
The term reverse engineering can apply to several security-related issues. When an attack on a host has occurred, reverse engineering tools can be used to identify the details of a breach, how the attacker entered the system, and what steps were taken to breach the system. Reverse engineering can also apply to using tools to break down malware to understand its purpose and how to defeat it; when applied to malware, it is done in a sandbox environment to prevent the spread of the malware.
When examples of zero-day malware have been safely sandboxed and must be analyzed or when a host has been compromised and has been safely isolated and you would like to identify details of the breach to be better prepared for the future, reverse engineering tools are indicated. The Infosec Institute recommends the following as the top reverse engineering tools for cybersecurity professionals:
Apktool: This third-party tool for reverse engineering can decode resources to nearly original form and re-create them after making some adjustments.
dex2jar: This lightweight API is designed to read the Dalvik Executable (.dex/.odex) format. It is used with Android and Java .class files.
diStorm3: This tool is lightweight, easy to use, and has a fast decomposer library. It disassembles instructions in 16-, 32-, and 64-bit modes. It is also the fastest disassembler library. The source code is very clean, readable, portable, and platform independent.
edb-debugger: This is the Linux equivalent of the famous Olly debugger on the Windows platform. One of the main goals of this debugger is modularity.
Jad Debugger: This is the most popular Java decompiler ever written. It is a command-line utility written in C++.
Javasnoop: This Aspect Security tool allows security testers to test the security of Java applications easily.
OllyDbg: This is a 32-bit, assembler-level analyzing debugger for Microsoft Windows. Emphasis on binary code analysis makes it particularly useful in cases where the source is unavailable.
Valgrind: This suite is for debugging and profiling Linux programs.
Physical Security Tools
As stated earlier in this chapter, without physical security, other forms of security are useless. We end this chapter with several host physical security assessment tools.
Lock Picks
Lock picks are tools used to test the ability of your physical locks to withstand someone picking them. These are the same tools used by a professional locksmith to open a lock when hired to do so and one of the reasons many organization have moved away from using physical locks. Figure 10-23 shows examples of some lock picks.

If a facility uses physical locks, the locks should be checked to see if they are susceptible to these tools. It may even be advisable to hire a locksmith to attempt to open them.
Locks
Door locks can be either mechanical or electronic. Electric locks, or cipher locks, use a key pad that requires the correct code to open the lock. These are programmable, and organizations that use them should change the codes frequently. Another type of door security system is a proximity authentication device, with which a programmable card is used to deliver an access code to the device either by swiping the card or in some cases just being in the vicinity of the reader. These devices typically contain the following electronic access control (EAC) components:
An electromagnetic lock
A credential reader
A closed door sensor
Locks are also used in places other than doors, such as protecting cabinets and securing devices. Types of mechanical locks with which you should be familiar are:
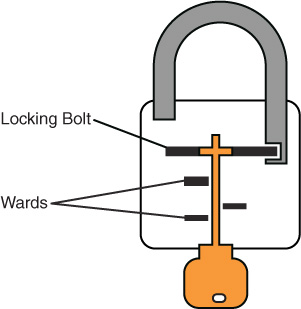
Warded locks: This type of lock has a spring-loaded bolt with a notch in it. The lock has wards, or metal projections, inside the lock with which the key will match to enable opening the lock. A warded lock design is shown in Figure 10-24.
Tumbler locks: This type of lock has more moving parts than the warded lock, and the key raises the lock metal piece to the correct height. A tumbler lock design is shown in Figure 10-25.

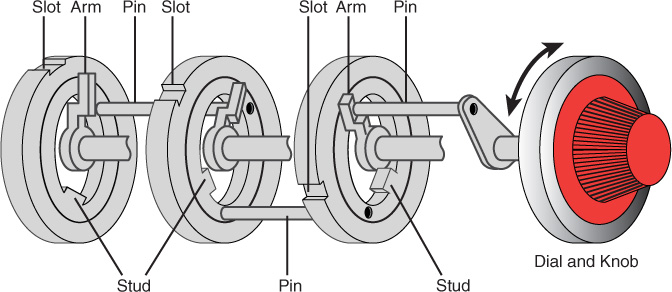
Combination locks: This type of lock requires rotating the lock in a pattern that, if correct, lines the tumblers up, opening the lock. A combination lock design is shown in Figure 10-26.
In the case of device locks, laptops are the main item that must be protected because they are so easy to steal. Laptops should never be left in the open without being secured to something solid with a cable lock—a vinyl-coated steel cable that connects to the laptop and locks around an object.
RFID Tools
Malicious individuals use Radio-frequency identification (RFID) tools to steal proximity badge information from an unsuspecting employee who physically walks near the concealed device. One example is the Tastic RFID Thief by Bishop Fox. Specifically, it targets 125 KHz, low-frequency RFID badge systems used for physical security, such as those used in HID Prox and Indala proximity products. Alternatively, it could be used to weaponize a 13.56 MHz, high-frequency RFID reader, like those for HID iCLASS access control systems.
When RFID systems are in use, penetration tests should include testing of the vulnerability of systems to the capture of such RFID credentials as their capture could lead to serious physical security issues.
IR Camera
An infrared camera is a camera that forms an image using infrared radiation and can capture images in the dark. These cameras can also detect motion in the area, making them a great choice. When physical security assessments are performed, these devices should be fully tested to ensure that they capture all intrusion attempts.
Exam Preparation Tasks
You have a couple choices for exam preparation: the exercises here and the practice exams in the Pearson IT Certification test engine.
Review All Key Topics
Review the most important topics in this chapter, noted with the Key Topics icon in the outer margin of the page. Table 10-4 lists these key topics and the page number on which each is found.
Table 10-4 Key Topics for Chapter 10
Key Topic Element |
Description |
Page Number |
List |
SCAP components |
416 |
List |
CVSS metric groups |
416 |
List |
CVSS basic metric group |
417 |
List |
Recommendations for conducting a scan |
419 |
List |
High-level steps to conducting a scan |
419 |
List |
The three most widely used exploit frameworks |
423 |
List |
Methods of SIEM log generation |
425 |
SIEM output |
426 |
|
netstat parameters |
430 |
|
Sysinternals Security Utilities |
436 |
|
SFC switches |
437 |
|
List |
Advantages of cloud antivirus |
439 |
List |
Disadvantages of cloud antivirus |
440 |
Define Key Terms
Define the following key terms from this chapter and check your answers in the glossary:
Common Configuration Enumeration (CCE)
Common Platform Enumeration (CPE)
Common Vulnerabilities and Exposures (CVE)
Common Vulnerability Scoring System (CVSS)
Common Weakness Enumeration (CWE)
Security Content Automation Protocol (SCAP)
Review Questions
1. You have recently suffered some network attacks and would like to discover what services are available on the computers in your network. Which of the following assessment tools would be most appropriate for this?
port scanner
protocol analyzer
password cracker
fuzzer
2. Recently someone stole data from your network, and that data should have been encrypted, but it’s too late to figure out whether it was. What tool could you use to determine if certain types of traffic on your network are encrypted?
port scanner
protocol analyzer
password cracker
fuzzer
3. A web application developed by your company was recently compromised and caused the loss of sensitive data. You need a tool that can help identify security holes in the application before it is redeployed. Which tool could you use?
port scanner
protocol analyzer
password cracker
fuzzer
4. Which of the following is a standard that the security automation community uses to enumerate software flaws and configuration issues?
SCAP
CANVAS
SIEM
OWASP
5. Which SFC switch scans a file that you specify and fixes problems if they are found?
/CACHSIZE=X
/SCANONCE
/SCANFILE
/SCANNOW
6. Which SCAP component contains methods for describing and classifying operating systems?
CCE
CPE
CWE
CVE
7. WhatsUp Gold is an example of what tool type?
fuzzer
sniffer
network enumerator
port scanner
8. Which tool type captures raw packets?
fuzzer
sniffer
network enumerator
port scanner
9. OllyDbg is an example of which tool type?
fuzzer
sniffer
network enumerator
reverse engineering tools
10. Which of the following are used to steal proximity badge information?
lock picks
RFID tools
rogue APs
evil twins