CHAPTER 10
Systems Management
In this chapter, you will learn about
• Policies and procedures
• Systems management best practices
• Systems maintenance
• Monitoring techniques
Up until this point, this book has primarily focused on the technologies required to deliver cloud services. This chapter explores the nontechnical aspects of cloud service delivery in policies, procedures, and best practices. These components are critical to the efficient and effective execution of cloud solutions.
The chapter begins with the documents that define the rule sets by which users and administrators must abide, called policies, and the prescribed documented actions that will carry out the expectations of the policies, known as procedures. After this, maintenance activities are introduced. These maintenance activities must be performed to keep cloud systems operating at expected performance levels and to avoid unexpected downtime.
The chapter then introduces monitoring techniques. Monitoring the cloud environment is a fundamental component of successful cloud computing environment management. Proper monitoring helps uncover problems early on, and it aids in detecting network outages quickly and efficiently, which leads to increased availability of servers, services, and applications. Valuable data obtained in monitoring metrics can be used to plan for future resource utilization and to become more proactive instead of reactive.
An organization needs to be able to monitor and manage the cloud environment quickly and efficiently. Remotely administering cloud virtualization is a flexible way to administer the environment and respond to issues or alerts that might arise. There are various options for managing and monitoring the cloud environment securely and remotely, which are covered in this chapter.
Policies and Procedures
Policies and procedures are the backbone of any IT organization. While the hardware, software, and their associated configurations are the products that enable the functionality businesses desire from their IT services, it is a cloud service provider’s or cloud consumer’s policies and procedures that allow IT service implementation, maintenance, and ongoing support.
Policies define the rule sets by which users and cloud service administrators (CSAs) must abide, and procedures are the prescribed methodologies by which activities are carried out in the IT environment according to those defined policies.
While most IT professionals focus on the technical aspects of IT, a growing percentage of all IT organizations are emphasizing policy and procedure development to ensure that they get the most out of their technology investment. Policies can be used to enforce IT best practices to significantly affect not only the operational efficiency and effectiveness of the businesses they serve but to also protect the organization from risk by defining compliance expectations and ensuring adherence to industry regulation.
This section provides information on some key business processes that aid in managing the technology environment, making it more efficient, and planning for the future. These processes include
• Creating standard operating procedures
• Workflow
• Capacity management
Standard Operating Procedures
Standard operating procedures (SOPs) are a form of knowledge management. The experience gained from one individual can be documented so that others do not need to go through the same experience, possibly involving failure, to learn from it.
SOPs help ensure that tasks are performed consistently, without significant deviation from expectations. It is likely that you will perform routine tasks many times. The first time you perform such a job, it is best to create an SOP for future migrations. You may find along the way that you can improve the SOP here or there. Feel free to add more details to the SOP as you discover enhancements.
An SOP will ensure that others who perform the same task do so with the same level of professionalism that you do. SOPs also ensure consistent implementation, including the amount of time it takes to perform the task and the resources required.
Workflow
Workflows are business processes organized in sets of discrete tasks from the beginning to the end of the operations. Workflow task details include the dependencies and requirements such as the personnel, technology, tools, and environment required to complete the task.
Workflow modeling can help visualize a workflow by placing each task on a timeline, with dependencies shown as prerequisite tasks and parallel tasks shown about one another. Relationships are depicted using paths. Each path is a set of functions that can be performed independently of other tasks. Some paths may diverge and then join back together to express group dependencies and then there is a period where tasks can be carried out at the same time. Some paths may take longer to complete than others. A project management technique known as critical path analysis identifies paths where there is no extra time available. When resources are scarce, tasks on the critical path should be given a higher priority.
Workflow can be helpful in managing standard processes, but it can be even more effective when those processes are automated. The SOPs an organization creates in the course of doing business can now be used in establishing workflow automation. Once a process has been performed several times and sufficiently well documented, there may be methods of automating the process so that it is even more streamlined. The documentation will ensure that you do not miss a critical step in the workflow, and it can help in troubleshooting workflows later on. Workflow automation with runbooks is discussed in more detail in Chapter 14.
Capacity Management
Capacity management is the process of ensuring that both the current and future capacity and performance demands of an IT organization’s customers regarding service provision are delivered according to justifiable costs. Capacity management has overall responsibility for ensuring adequate IT capacity (as the name suggests) to meet required service levels, that the appropriate stakeholders are correctly advised on how to match capacity and demand, and that existing capacity is optimized.
Successful capacity management requires considerable attention to be paid to the design of the system. The design phase must ensure that all service levels are understood and that the capacity to fulfill them is incorporated into the design’s configuration. Once the configuration has been adequately designed and documented, operations can establish a baseline. This baseline is a measuring stick against which capacity can be monitored to understand both the current demand and trend for future needs.
The capacity management process includes producing and maintaining an appropriate capacity plan that reflects the current and future requirements of its customers. The plan is designed to accomplish the following objectives:
• Provide advice and guidance to all other areas of the business and IT on all capacity- and performance-related issues.
• Ensure that service performance achievements meet or exceed all their agreed-upon performance targets by managing the performance and capacity of both services and resources.
• Ensure the current and future capacity and performance demands of the customer regarding IT service provision are delivered within justifiable costs.
• Assist with the diagnosis and resolution of both performance- and capacity-related incidents and problems.
• Assess the impact of any changes to the capacity plan and the performance and capacity of all IT services and resources.
• Ensure that proactive measures to improve the performance of services are implemented.
When building this capacity plan, its architects must factor in all IT resources, including both human and technical resources. Keep in mind that people are resources as well.
Records Management
Records management is a governance process surrounding organizational information. Much of a company’s ability to operate and its organizational value may reside within its data, so it is important to effectively manage that information so that it can be easily obtained by those who need it, revised when necessary, protected from accidental or malicious modification or deletion, and removed when it no longer provides value. Records management includes both physical and digital information. Such information includes work products created by employees or others on behalf of the company or information obtained by the company.
Records have a life cycle, beginning with their creation and ending with their destruction. The life cycle is shown in Figure 10-1. The first stage is the creation of the document. The record then may go through various modifications. The third phase is the movement of the document. This may include moving to other storage mediums or platforms. The last stage is destruction.

Figure 10-1 Records life cycle
Records management seeks to control organizational information through the following activities:
• Identifying newly created data.
• Tracking relevant metadata.
• Storing the data.
• Documenting access to data.
• Tracking revisions to the data. This may also include preserving previous versions.
• Destroying documents.
Identifying New Data
The first priority of a records management system is to track when new data is created. In some cases, the company requires that new data be stored within the records management system and leaves it to employees to comply with the requirement. However, some data can potentially fall through the cracks with this approach, so some records management systems will have agents that run on systems to identify when new data is created and then automatically archive the data within the records management system.
Tracking Metadata
The next step is to track relevant metadata on the data. Some important metadata includes creator, creation date, data classification, data owner, and revisions. Figure 10-2 shows the metadata of a sample Microsoft Word document. This is information that the application and the operating system collect automatically.

Figure 10-2 Record metadata
The actual metadata fields may differ based on the document type. For example, Figure 10-3 shows the metadata for a picture. As you can see, the camera recorded additional metadata specific to a photo, including the camera make, model, exposure time, ISO speed, and more.

Figure 10-3 Photo metadata
Storing the Data
The next step is to store the data. We covered storage mechanisms back in Chapters 2 and 3, so we will not rehash all the options available for storage, except to say that some records management systems will store the data in the application as part of the database, others will store the files on a file system and include pointers to their location within their database, and still others will leave the files where they are at and simply record their current location.
Access
The records management system should also document who has access to the file. This will typically not list each and every user that can access the data. Rather, the system may include which groups can access it. The actual access permissions may be governed by the permissions of the underlying file system or permissions within the database, depending on how the data is accessed.
Versioning
The next step in the records management process is tracking changes made to organizational data and storing previous copies so that older versions can be retrieved if needed. One component of versioning is to lock out earlier copies so that they can no longer be modified. In some cases, previous versions are stored on WORM media so that they cannot be changed. If you recall from Chapter 3, write once, read many (WORM) media is storage that cannot be modified once it has been written. It does this through write protection or by physically blocking write capabilities.
Retention
The records management system should track when information is set to expire. Typically, organizations will establish data retention rates for certain types of data. These retention rates may be set according to the organization’s determination on how long data typically has value to the company weighed against the cost to continue managing and securing the data. Additionally, compliance requirements, such as Securities and Exchange Commission (SEC) regulations or Gramm-Leach-Bliley Act (GLBA) for financial documents or Health Insurance Portability and Accountability Act (HIPAA) for health information, may specify certain retention rates. Table 10-1 shows an example of some record retention periods and how specific they might be.

Table 10-1 Sample Record Retention Periods
Destruction
The last step in records management is removing data that is no longer needed. This is typically performed by implementing policies to purge data that has expired organizational retention rates or is otherwise no longer useful to the company.
Systems Management Best Practices
The processes and procedures that IT organizations implement to achieve results more effectively and efficiently are the results of careful design, standardized environments, and thorough documentation.
With a view to building sustainable technology solutions that consistently deliver their intended value, system maintenance must be performed at every step of the application life cycle. Documentation of the business requirements for any proposed IT service additions or changes should be the first phase of the life cycle, followed by documentation for the proposed technical design, continuing into implementation planning documents and support documentation, and coming full circle in the life cycle through documented service improvement plans.
Documentation
Documentation is an important part of systems management. The Information Technology Infrastructure Library (ITIL) is a collection of best practices for IT service management. It was put together initially by the British government but was spun off under a private best practices body called AXELOS in 2013. ITIL is one of the most widely used IT service management best practices globally, and it is very helpful in understanding best practices in IT documentation. ITIL is divided into five publications, called volumes, that cover the following categories:
• Service strategy
• Service design
• Service transition
• Service operation
• Continual service improvement
ITIL provides a framework for documentation for each of the five sections, and this section will discuss documentation in that context.
During the ITIL service strategy phase, business requirements are documented as the entry point for all IT services. The key piece of documentation in this stage is the service portfolio. The service portfolio is a comprehensive list of quantified services that will enable the business to achieve a positive return on its investment in the service.
During the service design phase, technical solutions, support processes, and service level agreements (SLAs) are documented in the service design package (SDP). The SDP includes the technical solutions, such as routers, switches, servers, and storage; support processes for maintaining the service; and SLAs with the customer regarding the mutually agreed-upon levels of capacity, availability, and performance.
The service transition phase focuses on delivering the SDP and all of its detail into a living, breathing operational environment. This documentation stage consists of change and configuration documentation. See Chapter 14 for further information on change and configuration management.
Lastly, a service improvement register documents opportunities for improving IT services as follows:
• Opportunities are categorized as short-term, medium-term, or long-term options.
• Opportunities are assessed as part of the service strategy phase once the life cycle restarts.
• Opportunities are assigned a business value that can be weighed against implementation cost.
• Opportunity time frames, value, and costs are evaluated to determine which services to add or modify to provide the highest value to customers.
Documentation is one vehicle that drives effective systems administration. Documentation allows CSAs to expand their ability to comprehend complex environments without keeping all the information in their heads. Another very effective way to accomplish this goal is through standardization.

EXAM TIP All service levels must be documented and agreed upon by both the service provider and the customer.
Standardization
Standardization reduces system administration complexities because CSAs only need to learn the standard way of doing things, since that method and configuration are applicable across many systems.
Standardization focuses on two areas: procedures and configurations. Standard procedures were discussed earlier in the “Standard Operating Procedures” section. Now we will focus on standardizing configuration. Some of the advantages of standardization include
• Systems management is performed consistently.
• System access is better controlled.
• System communication protocols are the same across applications and services.
• Uniform system logging and auditing settings are employed.
• Systems are deployed in the same manner each time.
Standardization allows for systems to be managed consistently in the same way. Organizations can specify which management protocols to use and whether centralized management utilities will be put in place. When new systems are evaluated, the selection group then ensures that new software or cloud services meet the standard requirements so that they can be managed in the same way. Consistent management reduces the amount of time spent managing devices and makes employees more efficient as they get more comfortable with the process. Consistent management means that administrators need to be familiar with fewer tools, so training administrators is easier and the company spends less on licensing because fewer tools need to be licensed.
Standardization mandates which entities have access by default. Some devices come with default configurations that may not be secure or in the company’s best interests. Standards define which users have administrative access and which users should have functional access to newly deployed systems. This ensures that end users do not have access to systems until the systems have been fully provisioned and tested for use.
Standardization is used to enforce how systems communicate with one another. Using standard communication models allows the organization to specify fewer traffic rules on intermediary devices. This decreases the complexity of management and decreases the attack surface of systems and networks, since only a small set of authorized communication protocols is allowed through. Communication standardization also makes it easier to detect unauthorized communication attempts if such attempts utilize a nonstandard communication method.
Standardization ensures consistent system logging and auditing settings are applied to servers, computers, and network devices to retain accurate data. Some logging settings such as file access logging or the logging of both successes and failures may not be configured everywhere, but having such information can be very useful when there are questions about what happened on a device. Standard logging methods ensure that each device will have the information the organization needs to make decisions or remediate an incident. Furthermore, the organization will have a more complete picture because each device will be recording the same types of information.
Lastly, standardization can help confirm that systems are deployed the same way each time. This is especially important as continuous improvement, and continuous delivery models produce more frequent software deployments. Each deployment should go through the same standard steps so that it is deployed correctly and efficiently.
Organizations often specify their own standards for how systems must be configured, but these standards may be based on industry standards such as the following:
• International Organization for Standardization/International Electrotechnical Commission (ISO/IEC) 27000 series
• The National Institute of Standards and Technology (NIST) standards
• The Information Systems Audit and Control Association’s (ISACA) Control Objectives for Information and Related Technologies (COBIT)
• The Cloud Security Alliance (CSA) Cloud Controls Matrix (CCM)
• The Organization for the Advancement of Structured Information Standards (OASIS) Cloud Application Management for Platforms (CAMP) standard
Metrics
Metrics are an excellent way to track company performance. Metrics can be defined for all sorts of indicators. Another name for metrics is key performance indicators (KPIs). Metrics should be defined for items that are essential for organizational success. Some companies establish parameters because another company or trusted source uses them, but unless the metric contributes to the company’s goals and mission, it is more likely a waste of time.
Metrics fall under the role of operations, and cloud operations (or “ops”) teams often identify and track cloud-based metrics. As you can tell from the name, ops teams are part of DevOps, introduced in Chapter 8.
Cloud environments can be quite complex, with many different cloud solutions integrated into a hybrid multicloud. Metrics can help the cloud operations team and management track how systems are performing and the efficiency of processes.
Metrics are essential in evaluating whether service level agreements are being met and demonstrating to customers how the provider is achieving service level agreements. Metrics also help in identifying problems.
Reporting Based on Company Policies
Company policies specify the expectations the company has for employee behavior and how systems should operate. These items are of obvious importance to the organization because leaders took the time to write these expectations out in policy and made employees aware of the policy requirements. For this reason, policy elements can be a good guide for identifying metrics to track. For example, if the company policy says that high vulnerabilities must be remediated within seven days, it would make sense to establish a vulnerability remediation metric to track how long it takes to remediate vulnerabilities, including high vulnerabilities.
Reporting Based on SLAs
An SLA is a contract that specifies the level of uptime that will be supported by the service provider. SLAs include provisions for how the service provider will compensate customers if SLAs are not met, so it is in the organization’s best interest to ensure that SLAs are met.
Metrics can be defined to measure SLA performance. For example, if the SLA states that an application must be available 99.999 percent of the time, an important metric to track would be site availability.
EXAM TIP Similar to SLAs are operational level agreements (OLAs), which are documents that describe the expectations of internal units so that SLAs can be met.
Dashboards
Gathering metrics is useful, but metrics truly become valuable when made available for decision-making and performance monitoring. Dashboards and reporting are two methods commonly used to make metrics available to those who need them. Dashboard panels, often consisting of a web portal or a linked spreadsheet, contain a series of metrics on specific areas. Web portals can be viewed anywhere, so they are available when needed. Spreadsheets are similarly shared, if not quite as easy to use as a web dashboard. One downside with spreadsheets is that they will not update if the resources from which they obtain their data are inaccessible, making the spreadsheet data stale. Stale spreadsheets can happen if the spreadsheet is created by someone who is authorized to collect the data and then later shared with another who is not. For this reason, web portals are far superior to spreadsheets for tracking metrics.
Metrics can also be tracked with reports that are set out at periodic intervals. This is typically an automated procedure, but upper-management reports are often consolidated from other reports and prepared by hand to give them added polish. Applications can be configured to e-mail reports with selected metrics on performance at certain intervals. Of course, this requires that data regarding these metrics be available to the application.
System Availability
System availability metrics are a core metric of any service provider, including cloud service providers (CSPs). Customers are purchasing an IT service, and they need to know when and how often that service is unavailable through such metrics as system uptime, bandwidth, or error rate. Some services can ping websites and send out notifications if a site becomes unavailable. These sites also track availability percentages and provide dashboards for viewing all checks.
It is also possible to collect availability metrics on the underlying components that make up a system, such as web services, database services, file systems, critical service dependencies, and so forth. Notifications can be similarly configured for such systems, with dashboards for viewing the status of all essential functions in one place.
• Uptime Uptime can be a differentiating factor for service providers if uptime numbers are particularly high. Uptime is often measured as a percentage and described in terms of how many consecutive “nines” are in the percent. For example, a system that provides 99.999 percent availability is offering five 9s of availability, while a system that offers 99.999999 percent availability is offering eight 9s. A service provider can conduct a competitive analysis to reveal what competing service providers are offering for uptime availability metrics so that it can be sure to meet or exceed those numbers.
• Downtime Periods of unavailability are called downtime, and most cloud service providers want to minimize this because disruptions for customers mean that they are finding less value in the service offering. The number of nines was used to demonstrate uptime, but downtime is represented either as the inverse percentage or as a specific amount of time the systems were unavailable. For example, the downtime number for five 9s would be 0.001 percent, and the number for eight 9s would be 0.000001 percent. If we were to measure these in the actual amount of time the systems were unavailable, five 9s would equate to 5.39 minutes of downtime in a year, while eight 9s would be less than 1 second of downtime.
Connectivity
Connectivity metrics measure things like bandwidth consumption, congestion, and packet loss. Connectivity metrics are essential for ensuring responsive services and applications and avoiding performance or availability problems.
Track connectivity metrics to ensure that communication mediums do not get congested. By tracking connectivity metrics, a service provider can expand bandwidth or implement throttling to control available resources. Cloud dashboards can quickly show if, for example, a select group of virtual desktop users is utilizing more bandwidth than others. The cloud administrator may decide to implement throttling on those users if the cloud account as a whole is approaching a bandwidth limit, or they may choose to upgrade to a plan that includes more bandwidth if the bandwidth-consuming activity is for legitimate business purposes. Connectivity metrics are also applicable to conducting trending on connectivity metrics to determine when upgrades will be necessary.
Connectivity dashboards can show connectivity parameters for links within the network and across sites. Some system tools for collecting network connectivity data include PRTG Network Monitor and SolarWinds NetFlow Traffic Analyzer. You can use SNMP and RMON to collect device statistics. Some companies perform protocol analysis as well to gain additional insight into connectivity.
Latency
Latency metrics measure site, service, or link response time. Latency metrics are essential for ensuring responsive services and applications and avoiding performance or availability problems.
Track latency metrics to ensure that services meet established SLAs and that end users are receiving data from devices with the lowest latency. Implement changes or add local services when regions are not well served. Often performance issues can be avoided by monitoring latency metrics in replication. Synchronous replication is particularly sensitive to latency.
Capacity
Capacity metrics measure how much storage is allocated, used, and free. Capacity metrics are helpful in ensuring that enough storage is available to users and applications. Track capacity metrics to ensure that volumes do not get full. Expand volumes or add storage as needed when capacity reaches established thresholds. You should also consider conducting trending on capacity metrics to determine when upgrades will be necessary.
Storage vendors produce dashboards and tools for viewing capacity metrics. These can sometimes be integrated into other reporting suites with Web-Based Enterprise Management (WBEM) or through custom vendor integration tools or application programming interfaces (APIs).
Overall Utilization
Detailed metrics are great for solving problems and for reporting, but it helps to have an overall picture of usage across the board. Overall utilization metrics can be obtained by consolidating individual metrics to give decision-makers and operations teams valuable insight on current usage and trends and can enable forecasting of future needs and opportunities.
Cost
Cost is a fundamental metric in any scenario. IT costs can be a significant portion of a company’s budget, so it is crucial for those managing IT to know where the money is being spent and how those costs contribute to business operations. In a cloud-based environment, billing is often based on consumption, so IT needs to be able to show with metrics how that consumption is contributing to IT costs.
Cost metrics will also need to be calculated for chargebacks and showbacks to show which clients or departments should be billed for IT services as part of a chargeback initiative or just to track consumption for showbacks.
Chargebacks IT is often seen as purely an organizational cost to be reduced. IT frequently has to defend its actions and budget. IT can push the costs of technology services onto the company departments that use those services through chargebacks. Chargebacks track usage of systems by departments or individuals and then bill the department for their utilization of the service. Chargebacks are popular in consulting organizations, law firms, accounting firms, and others that bill services to clients, because costs such as printing, faxing, and cloud service usage can be charged back to their clients as a cost of providing the service.
Showbacks Showbacks track usage of IT services so that management can see the value of IT services in relation to their costs. This makes budgeting much more manageable. Also, when cutbacks are needed, management will have the data necessary to reduce services that have the least organizational impact.
Incidents
Incidents can and will happen in your organization. It is important to have an incident response plan and to specify metrics on how long certain tasks will take. Notification periods for investigations are strict, and there will be a lot of pressure during the incident to meet those deadlines. Be familiar with these metrics before the incident. Some metrics include investigation time, detection time, number of records affected, number of users affected, remediation cost, remediation hours, and investigation hours.
Health
Health metrics are valuable to gauge when equipment replacement is likely. Some CSAs may choose to replace equipment proactively in particularly critical environments. Health metrics also provide information useful for determining which spare equipment should be purchased for expected substitutes. Some important hardware health metrics include
• Mean time between failures (MTBF)
• Mean time to repair (MTTR)
• Self-monitoring, analysis, and reporting technology (SMART)
MTBF is the average time a device will function before it fails. MTBF can be used to determine approximately how long a hard drive will last in a server.
MTTR, on the other hand, is the average time that it takes to repair a failed hardware component. MTTR is often part of the maintenance contract for virtualization hosts. An MTTR of 24 hours or less would be appropriate for a higher-priority server. In contrast, a lower-priority server might have an MTTR of seven days.
Lastly, SMART is a set of hard disk metrics used to predict failures by monitoring over 100 metrics such as read error rate, spin-up time, start and stop count, reallocated sectors count, and seek error rate. SMART has predefined thresholds for each metric, and those thresholds are used to determine if a drive is in an OK, warning, or error status.
Elasticity
Elasticity is a measurement of how sensitive one variable is to changes in another. Elasticity is important in tracking metrics because some metrics may depend upon one another or may affect one another. Elasticity can track how changes in one metric affect other metrics.
Elasticity cause and effect, in turn, can be used to focus better efforts to improve performance. For example, a company may find that several key performance metrics improve when training time is increased. From a more technical perspective, backup time metrics may improve if bandwidth utilization is reduced.
Planning
Once the baseline states are documented, agreed upon in writing, and put in place, what happens when maintenance needs to occur or system upgrades occur? Such events almost certainly disrupt a baseline. These events must be planned for under controlled circumstances by the systems administrator. They cannot happen at random times without the consent of the customer. Maintenance windows need to be established as part of any IT environment for all of its configuration items. These windows should be scheduled at periods of least potential disruption to the customer, and the customer should be involved in the maintenance scheduling process. After all, the customer knows their patterns of business activity better than the systems administrators ever could.
All technology upgrades and patches should utilize these maintenance windows whenever possible. Furthermore, the timing of patch or upgrade implementation should be consistently reviewed as part of the standard change management process by the change advisory board (CAB). Change management is discussed in Chapter 14.
Systems Maintenance
IT systems require regular maintenance to help them remain free from errors and bugs and keep up with the latest technologies and processes. Maintenance and development updates can consume a great deal of IT personnel time, and yet their functions are core to the business. Additionally, some functions overlap, and others benefit from increased integration. A blended group of software developers and IT operations has evolved called DevOps to handle both objectives. DevOps was introduced back in Chapter 8, and system maintenance is also a function of the DevOps team. This section covers the following core systems maintenance activities:
• Code updates
• Patch management
• Maintenance automation
Code Updates
There is usually a queue of code updates, including requests, bugs, and features, that DevOps teams try to tackle. Teams may be working on different branches of code. Each branch is a portion of the program that is duplicated so that teams can work in parallel.
Two concepts that are often discussed within DevOps are continuous integration (CI) and continuous delivery (CD). Continuous integration involves automating the elements of the coding and testing processes. CI automates testing routines so that each time a new piece of code is committed, it is subjected to testing to ensure that it meets quality standards. Additional testing still needs to be performed, but this function helps catch the most routine issues early on in the development cycle with less effort.
Continuous delivery is a process that creates a pipeline of tasks leading toward the deployment of regular software releases. In CD, DevOps teams make frequent iterative changes to the code rather than working on a large portion of the program for an extended period. This decreases the time from the introduction of new code to the deployment of that code in production. CD also allows for software users to have more current versions and for stable releases to be produced in a short time frame. CD is also known as continuous development.
Some DevOps teams operate on short-term release schedules called sprints to accomplish some shared objective. Sprints allow developers to work as a team and celebrate the small successes rather than working on a huge project and only seeing the reward at the end.
Code Repository
Keeping track of changes in the code is essential. As the complexity of code increases, changes may cause unintended behavior that may not be caught until testing. For this reason, DevOps teams will keep a code repository. Code repositories can organize code branches to keep code consistent even when multiple teams work on the same areas in parallel.
Developers publish code changes or commits to the repository, where a record is kept of the code that has been updated since the previous submission. Developers tag commits with a short statement on what the change accomplished. Developers can synchronize their local development environments with the code repository to receive new updates to the code or select or create branches of the code to work from. Furthermore, developers can easily revert to previous versions of code that they or others worked on through the code repository.
Version Updates
Updating versions on end-user machines can be a big job. Three methods are used to complete version updates:
• Manual version updates Manual version updates require the most time from the DevOps team. Companies that use this method send teams out to update end-user machines.
Distributed environments may not be connected enough for end-user updating or package managers, so updates are sent to local staff at branch or regional offices, who update applications for the users in their location. Some companies use this method to customize the application for particular regions or languages. For example, an accounting firm may deploy different versions of its application to offices in different states or countries so that those users receive an interface that is most compatible with their tax codes and processes.
• End-user updating In the end-user updating method, new versions are pushed to an update server. The team then notifies end users that a new update is available. Notifications can be sent through e-mail or by posting to a company message board or intranet. Users are expected to keep their applications updated to the latest version. In some cases, the program may not work if it is not running the newest version.
• Package manager The third option is to use a package manager to deploy updates. The package manager resides on each end-user machine. New versions are released to a server, and the package manager checks for an update on the server when the user loads the program. If a new version exists, the package manager automatically pulls down any new code to upgrade the application to the current version.
Package managers can also check for the local language settings on the operating system and region to load the appropriate software modules into their application.
Rollback
Developers used to save copies of an entire program or specific modules, functions, or subroutines each time a milestone was reached. If the next set of changes broke the program and the solution was not apparent, it was easiest to replace the existing code with the last backup rather than find all the changes and remove them.
Code repositories make rollback much simpler. In fact, they are now standard practice. If developers detect an error in testing and cannot find the cause, the code can be rolled back to a previous version by selecting the commit from the repository and deploying it back to the development environment. The code repository only stores the changes, so it takes much less space to store and less time to roll back.
Deployment Landscapes
Deployments are typically rolled out in four landscapes: development, quality assurance (QA), staging, and production. The landscapes can be available to diverse teams that are responsible for specialized areas of development. As code is more refined, it moves to a different landscape and undergoes additional testing.
Landscapes are efficient because the most straightforward and automated testing can be performed to small code segments first. Since this testing is frequent or a regularly scheduled activity, it can be automated. Furthermore, those tests’ findings can be quickly resolved because the developer is familiar with the code he or she just wrote. Later efforts can then focus on more complex testing. Second, landscapes provide higher levels of assurance as the testing environment moves closer to that of production. Landscapes also offer some isolation and separation of duties so that the people testing the product are not influenced by those writing the code. Releases go through development, QA, staging, and production landscapes as they make their way from code sections to a functional release.
Development
The first landscape is a development environment where developers can test small changes to ensure that their code changes provide the correct results for any new features. This provides an environment where new features and modifications can be previewed without committing. Testing at this phase is mostly automated.
Quality Assurance
Once a group of small changes reaches the point where it can be packaged together into a functioning element of the specifications, it is ready to move to the QA landscape. The QA landscape is where software testers evaluate both the added code and the impact those changes could have on other parts of the application.
The application is tested as a whole in the QA landscape to ensure potential unintended actions, memory leaks, or security vulnerabilities do not occur. QA testing evaluates the edge cases to ensure that the application will not process data that is not within the program’s bounds. Testers will work from multiple defined use cases of the program and seek to break it by performing actions the developers might not have anticipated.
In addition to regular QA testers, the QA landscape sometimes includes select individuals from the specifications phase (the first phase of the application life cycle) to ensure that the specifications were correctly translated into an application. The product must be thoroughly tested in the QA landscape before heading to the next landscape. The lead QA tester will usually sign off on the code in QA before it is moved.
Staging
In the staging landscape, code is placed into an environment that mirrors the production environment as closely as possible. The DevOps team will provision virtual machines (VMs) with the exact same specifications and configurations so that they can perform tests to better ensure that additional issues will not come up when the application or code is introduced to the production landscape. The team will test the deployment of the application, configuration, and access to the system, as well as any new features or application changes. The staging landscape, sometimes called pre-production, is the last landscape the code enters before going to production. Testing in the staging landscape may include canary and beta testers.
Production
In the production landscape, code is placed into production, where it is available for end users. Companies will usually implement segregation of duties in this landscape so that the same person who can deploy to the QA landscape cannot deploy to the production landscape and vice versa. These are usually separate individuals from those doing the testing as well.
The production landscape is where the maintenance and support start. Any updates have to go through the other two landscapes first to make sure that the best quality product is delivered. If there are any changes to the production environment in the future, then the end users must be contacted and notified of any potential downtime that may occur.
Deployment Methodologies
Recall from the discussion of the application life cycle in Chapter 8 that deployment is the fourth phase of the application life cycle. For review, the phases are specifications, development, testing, deployment, and maintenance. In the deployment phase, the application is installed and configured for use and procedures are documented for how the system should be employed. Users are then trained on how to use the system, and the application starts performing the job it was designed for.
DevOps will need to provision the resources required for the application, such as compute, memory, and storage resources. Deployments do not happen in a day, but methodologies such as those mentioned in the following sections aim to keep deployments moving along on a regular schedule of releases. Some deployment methods include the following:
• Rolling updates A methodology that can be used to keep an application at a stable release, with another always in the queue to be deployed shortly after that.
• Blue-green deployment These deployments always have an active system and one that is used for testing. When testing is complete, the testing system becomes active, and the former production system is available for testing. One system is labeled “blue” and the other “green.”
• Rapid deployment Virtualization and containerization technologies are used to create new application environments faster than ever before.
• Failover clusters Deployment can be performed to more than one server that work together to provide the service. Failover cluster deployments may use some of the same techniques as other deployments, but they are given their own section because the implementation of that deployment methodology may differ for a clustered environment.
Rolling Updates
Traditionally, software development is done in individual release versions. However, implementing CI and CD is quickly becoming the norm as DevOps teams work through queues of requests, bugs, and features.
Legacy release schedules have too much overhead associated with them to meet such expectations without increasing costs exponentially. Instead of having release versions that take a long time to deploy and test, developers work off increasingly smaller code segments so that issues are identified sooner and testing is simpler.
DevOps teams do not write code from different versions. Instead, they work with a single code base, using branching to differentiate project elements and development work products from one another. Updates to the software are rolled out as releases, which usually are very small and happen frequently. A single code base ensures that only one version of the software needs to be supported at a time.
With rolling updates, the program is never really finished. The application is always at a stable release, but DevOps teams have another one in the queue with regular deployment dates.
Blue-Green Deployment
Blue-green deployment is an excellent method for DevOps teams to test changes to systems when releases are made rapidly or as part of a continuous delivery model. However, blue-green deployment is not limited to such either. Blue-green deployment uses two environments, one called blue and the other called green. One of the environments faces the customer, while the other is used for testing.
When QA teams complete testing for a new release, the two environments are swapped. For example, the blue environment is operating for production and the green for test. A new release is deployed to green and tested. When testing is complete, the DevOps team makes green the production environment, and blue becomes the new test environment.
Blue-green deployment is faster than deploying from test to production, since the testing environment becomes the production environment. Swapping rather than redeploying eliminates one step in the deployment process. Additionally, blue-green environments allow for a rapid rollback if necessary.
Blue-green switches are performed to make one environment online and open to customers and the other available to test. Blue-green switches can be implemented on cloud virtualization in a number of ways. Two ways outlined here involve virtual network swapping and resource group swapping.
For example, a CSP may host several virtual machines. These virtual machines are part of either the blue or green network, depending on which virtual network they are assigned to. One set of systems may have its virtual network interface cards (NICs) on the blue virtual switch, while the other set has its virtual NIC configured for the green virtual switch, where blue is production and green is test. CSAs swap the virtual switch to physical switch mapping on the hypervisor when they want to switch from blue to green or vice versa. Depending on the cloud platform, the actual switch may need to be performed by the CSP based on a request from the cloud consumer.
Another option is to use resource group swapping. In Microsoft Azure, resources can be deployed into groups, one for the green environment and one for the blue environment. The cloud servers in the resource group are all given private IP addresses, and an application gateway is configured with the outside IP address. The application gateway is then used to direct traffic to whichever environment is the current production environment. The CSP can redirect the application gateway to the other environment when it’s time to swap. For example, in Microsoft Azure, you could create a deployment slot for blue and green deployments. Azure lets you choose which deployment slot to send new code to. You can quickly change which one is the production deployment slot so that you can switch between your blue and green deployments.
Rapid Deployment
Rapid deployment is a way for DevOps teams to provision and release solutions with minimal management effort or service provider interaction. Rapid deployment is enabled by enhanced virtualization and container technologies such as virtual machine clones, parent-child relationships, application containerization, virtual machine templates, self-service portals, and orchestration tools that allow IT organizations to roll out systems faster than ever before.
Failover Clusters
A failover cluster is multiple systems configured to operate together to offer a set of services. If one system in the cluster fails, the others are configured to pick up the failed server’s load without a loss of availability to the application.
To deploy a failover cluster, first provision several machines. You will need at least two to form a cluster. Next, provision shared storage to all servers. Shared storage is storage from a storage array over a storage area network (SAN) such as iSCSI, Fibre Channel, or InfiniBand. Configure storage adapters in the machines such as host bus adapters (HBAs), converged network adapters (CNAs), or NICs.

NOTE If using NICs for iSCSI, it is best to use ones with TCP offload to reduce the processing burden on the CPU for storage traffic.
Put the worldwide names (WWNs) for each of the cluster members (or IP addresses of the iSCSI adapters if using iSCSI) into a host group on the storage array and then enable the storage group for concurrent access. Lastly, assign storage resources, referenced by their logical unit number (LUN), to the storage group. The storage should now be visible on each device. However, do not configure the storage yet.
Install the clustering features on each node in the cluster. The installation will set up some basic cluster resources off the bat, such as a quorum, the service that monitors if enough devices are connected to the cluster to offer services. Configure each of the LUNs as a resource in the cluster and give the storage resources a name that makes sense. For example, database components like to have dedicated storage resources for different types of I/O. Typically, databases will have drives for the following types of data: tables, log files, indexes, full-text catalogs, temporary data, and backups. The storage requirements for each of these are different based on the reads and writes expected of the storage resource.
Next, install application services on the nodes and add services to the cluster. Set dependencies on the services so that the cluster will know in what order to start the services. Assign credentials to run the services and test the credentials on each node.
Lastly, start the application and ensure that it runs. Then test failing over elements from one node to another. Ensure that each one can be successfully failed over to each node in the cluster.
Patch Management
Software vendors regularly release patches for their software. Patches are software packages that modify existing software. Patches are created to fix software bugs or discovered vulnerabilities or to add new features.
Patches must be deployed to organizational systems to protect against new vulnerabilities in the software that could be exploited by attackers or to fix bugs in the software that could cause problems for users. The strategy employed to deploy patches is known as patch management.
Some software vendors release patches on a set schedule. This helps companies stay on top of patches because they can check for patches or schedule deployment and associated downtimes regularly. For example, Microsoft releases patches on the second and fourth Tuesdays of every month. Apple, Adobe, Oracle, and many others have similar practices. Still, some vendors release patches on an as-needed basis.
Hotfixes
Hotfixes, or quick fix engineering (QFE) updates, are small patches that address a specific issue. Many vendors use hotfixes to address urgent problems such as a critical vulnerability or a bug that the company cannot wait to address in its regular patching schedule.
Some hotfixes are released to address an issue that only some customers may face. Companies issues hotfix release information (Microsoft documents them in Knowledge Base articles) to describe the issue and the patch that fixes it. Customers can then request the hotfix if they encounter the problem. Other customers need not apply the hotfix. This approach is usually taken when the hotfix has the potential of disrupting other systems, so it is only applied when the need to resolve the issue outweighs the potential drawbacks. Be aware of the drawbacks by reading the Knowledge Base article associated with the hotfix carefully before applying the hotfix.
Rollups
Companies issue patch rollups to address the issue of updating an out-of-date software application that has been around for a while. Rollups combine multiple patches in the same category, such as security, or a specific product component, into a single package that can be deployed more easily. Without rollups, customers would need to deploy a long list of updates in sequence.
Service Packs
Service packs are another type of rollup that combines even more together into a single deployment package. Companies package all patches from the last main software release or patches from the last service pack into a single update package called a service pack. This makes it much easier to bring a system up to date from its initial installation package. Simply install the service packs in order and then apply any remaining patches.
Server Upgrades and Patches
Server upgrades and patches provide enhancements to the software running on servers that can either provide fixes for known errors or add functionality. Patches are developed and released in much the same way as patches for desktop operating systems. However, server upgrades and patches differ typically in their deployment. Desktop patches are often rolled out automatically or delegated to users to deploy. However, servers are more complicated to patch because patches often require a restart, which affects the availability of services that run on the server.
Clustering, discussed later in this chapter, is often used to allow for patching and other maintenance to be performed to servers without downtime to the overall system. Clusters enable the components to be failed over to other nodes in the cluster while one machine is restarted.
Patch Management Tools
Deploying patches can be time-consuming if performed manually. Fortunately, a variety of tools are available to automate the patch management process. These tools identify the installed software version number and then query the vendor’s patch list to identify which patches need to be installed and in which order. Some tools are specific to a vendor, some are built in, and some are available from third parties. For example, Microsoft has packaged an update system into Microsoft Windows. The user can set their system to download and install updates automatically on a set schedule or as soon as they are released. Other third-party solutions can query the system to identify all applications and then identify the patches available for those systems. There are also central patch management tools that can deploy and track the patch status of groups of machines. Figure 10-4 shows the Microsoft Windows Update Services console used to centrally manage Windows updates.

Figure 10-4 Microsoft Windows Update Services console
Patch management systems can be configured to install available updates automatically or to install only approved updates. In approval mode, an administrator reviews updates, potentially applying them to a series of test systems, and if the patches appear stable, the administrator approves the patches for deployment across the enterprise.
If systems are configured to download patches automatically, those patches might trigger a restart of the system. Ensure that patch installation occurs during a period where the workstation or server can be taken offline.
Patch Testing
Application vendors test their patches before releasing them, but they may not test all configurations or compatibility with applications you may have in your environment. For this reason, many companies test patches before deploying them to production systems.
Scheduled Updates
It is prudent to schedule updates to be applied on a regular basis so that systems are kept up-to-date without excessive management effort. Major software companies have made this process simpler and predictable. For example, Microsoft releases patches on the second Tuesday of each month. They may release additional patches on the fourth Tuesday of the month if necessary. Companies can time their update schedules so that they apply updates shortly after their release by the software vendor.
Scheduled updates can be configured to download and then install automatically, or they can be configured just to download and then prompt for installation. The important thing to note when configuring scheduled updates is that automatic installation may result in a restart of the machine so ensure that you have scheduled downtime for the systems you are patching if you are using automatic installation.
Exercise 10-1: Configuring Group Policy for Automatic Updates
In this exercise, we will create and configure the Windows group policy for a domain so that computers automatically download updates.
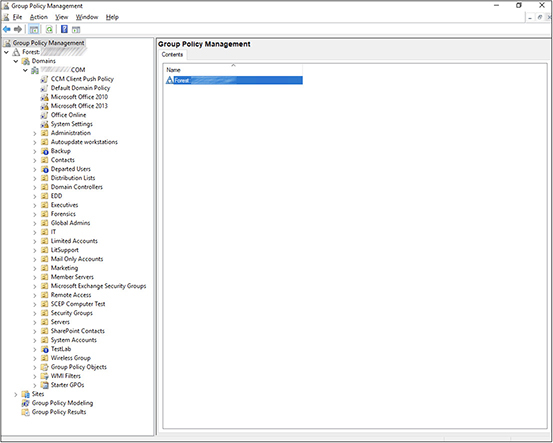
1. Log in to your domain controller. Go to Start | Administrative Tools and select Group Policy Management.
2. Expand the forest and domain, as shown next. Please note that the domain name has been blurred out. Next, right-click Default Domain Policy and select Edit.
3. A new window will open, allowing you to modify the default domain policy:
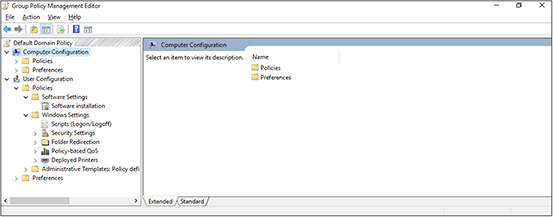
4. Navigate as follows: Computer Configuration | Policies | Administrative Templates Policy Definitions | Windows Components | Windows Update. This will display the Windows update settings, as shown in the following illustration. Please note that some of your settings may be configured differently depending on how your domain is set up.

5. Double-click the Configure Automatic Updates setting and select the Enabled option in the upper left. Set the automatic updating setting to 4 – Auto Download And Schedule The Install and then check the Every Week checkbox, as shown on the following page.
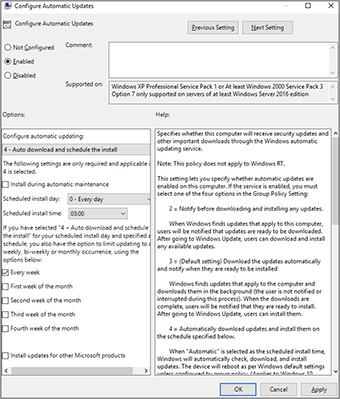
6. Click OK to save the setting.
7. You can now close the Group Policy Management Editor and Group Policy Management applications and log off the domain controller. Please note that the group policy will not immediately be applied to all machines. It can take time for it to propagate to each system. If you need to apply the policy to a machine immediately, run gpupdate/force on the local machine or script this command to run on multiple machines. This will make the machine check for and apply a new policy from the domain.
Patching Order of Operations
Patches are designed to be applied cumulatively, and they usually come with a version number and sometimes a build ID or other identifier that can show which patch level you are at. If you go to the About section in your software application, you can see which version you are running to identify if you need patches. Figure 10-5 shows the About screen from LibreOffice 5. As you can see, this system is running version 5.3.4.2, and the build ID is provided for querying for updates.
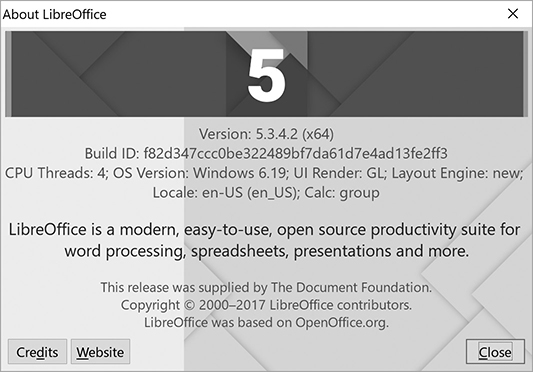
Figure 10-5 About screen for LibreOffice 5 showing the version number
Service packs are usually numbered so that customers know which service pack to apply first. For example, a customer purchases an application that has been on the market for several years. After installing the software, the customer checks for updates and finds three service packs and 22 patches. The service packs would be named service pack 1, service pack 2, and service pack 3, and the customer would install them in that order.
Newly released patches are designed to be deployed to applications running the latest service pack, so a customer would need to install service packs first and then the most recent patches. In the example, the customer would install service packs 1, 2, and 3 and then install the 22 patches in sequence.
Prioritization of Patch Application
You may have to apply many patches to a system to bring it up to date in some cases. You will need to test these patches before deploying them for any mission-critical systems to avoid unnecessary downtime or application issues. Thus, it is helpful to know in what order the patches should be applied to best protect the systems.
Patches are deployed for one of three reasons. They either fix software bugs or discovered vulnerabilities or add new features. Your first priority should be to apply security patches to address existing known vulnerabilities. After you have installed the security patches, consider some of the patches addressing bugs. You should ask yourself whether system users are experiencing issues related to any of the bugs addressed in these patches. If so, identify the patches related to those issues and add them to your priority list. Once this is complete, apply the rest of the bug fixes and then move on to the feature updates.
Dependency Considerations
Patches have dependencies. Cumulative updates, of course, are dependent upon previous patches. Other patch dependencies include specific software modules or features that may or may not have been installed when the program was deployed to the machine. Attempting to deploy a patch to a system where the dependencies are not present will result in an error. If you receive an error, double-check to ensure that you have the required dependencies. You may find that you do not need to install the patch because you do not have the component addressed in the update.
Operating System Upgrades
Operating system upgrades take an operating system from one major version to another. For example, an upgrade would take Windows 7 and bring it to Windows 10 or macOS 10.15 (Catalina) to macOS 11 (Big Sur).
Carefully consider how the upgrade will affect your applications before pursuing it. You will want to test key applications in the new operating system and test the upgrade procedure before performing it on production systems. Some applications may not be compatible with the new operating system, or they may require an update to make them compatible.
OS vendors sometimes have compatibility-checking applications that can review the applications and configurations of a system to let administrators know which items will need to be removed or updated before an OS upgrade can be performed. Document the changes required to system configurations or applications so that those can be performed on the system once the upgrade has been tested.
Once you have completed the testing, you can begin by updating the applications or modifying configurations on the production system to prepare it for the upgrade. In some cases, applications may need to be uninstalled and then reinstalled after the upgrade is complete. You will then perform the upgrade to bring the OS to the latest version. This should be immediately followed by applying the available patches to the system to protect from known vulnerabilities or bugs. Lastly, install any applications that were uninstalled before the upgrade. You should then go through a final checklist to ensure that applications and key services operate as expected, and then you can make the system available to users.
Rollbacks
You may encounter situations where patches cause some issue with the system, necessitating a rollback. Rollbacks remove a patch to bring the system back to its state before the patch was applied.
Rollbacks are also performed if the patch fails to apply for some reason. Some of the most common reasons why a patch might fail are lost Internet connectivity, lack of hard drive space, or failed dependency checks. If Internet connectivity is lost while the patch is being downloaded and applied, the system will wait for connectivity to be restored, but it may eventually time out, and the system will need to roll back to the previous state to revert any changes made by the patch. Many systems perform the download first and then check the integrity of the download before even starting the installation process to avoid this issue. The second issue you might see is the lack of hard drive space. The patch may fail if there is not enough hard drive space to apply it. Patches require the room for the download and the additional data copied to the system as part of the patch process. Patches may also need some space to decompress container files such as .zip, .msi, or .tar files. It is always good to have at least 20 percent free space for the regular operation of a system so that the system has room to expand files and add new data. Ensure that you have enough hard drive space before applying patches so that you will not need to roll back. The last reason a patch might fail is if it fails a dependency check. The patch might require a previous patch to be applied first, or it might require a system component to be at a specific level to function. Patches typically check for these dependencies as part of the installation process so that they can alert you to the condition before applying the patch, but you may encounter a situation where the patch fails because a dependency is missing, and then it will need to be rolled back.
Patches can also fail for other reasons. You could run into disk errors, or the system could crash while the patch is being applied. For whatever reason, rollbacks serve the purpose of reverting the system so that you can get it back to an operational state following a failed patch deployment.
N-1
You may not always want to run the latest version of a software application or service. Frequently bugs are identified in newly released versions, and those bugs are corrected with patches. To avoid such risks, some companies upgrade systems to the n-1 release. N stands for the current release, so n-1 means the last release before the current one.
Firmware
Firmware is software that is installed on computing hardware, such as a firewall, switch, or camera or hardware components within a machine, such as a network card, RAID controller, or system BIOS. Firmware requires updates just like other software, so it is important to check for new versions of the hardware’s firmware. The process of updating the firmware is known as flashing. Figure 10-6 shows the firmware update screen for a QNAP NAS device.
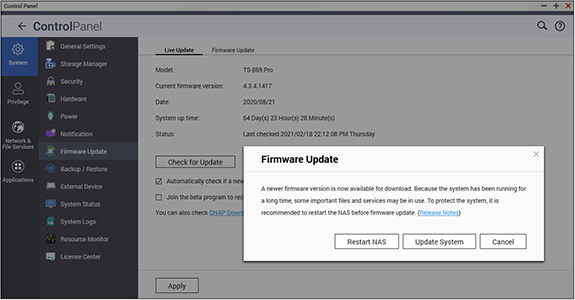
Figure 10-6 QNAP firmware update
Flashing computer hardware firmware often requires a utility from the hardware vendor. For devices such as firewalls, a web interface allows the firmware to be downloaded and installed. You can download the firmware elsewhere and then use the interface to upload the firmware to the system for installation. Other systems may require you to send the firmware to the device over a protocol such as Trivial File Transfer Protocol (TFTP). Some systems allow for many devices to be updated at the same time. For example, Cisco has software that can be used to deploy firmware updates to many devices simultaneously. You may also want to deploy software that can monitor systems for new firmware updates. Figure 10-7 shows the QFinder application that continually monitors three NAS devices for new firmware updates. The figure shows that the one named WORMHOLE has a new firmware version available.
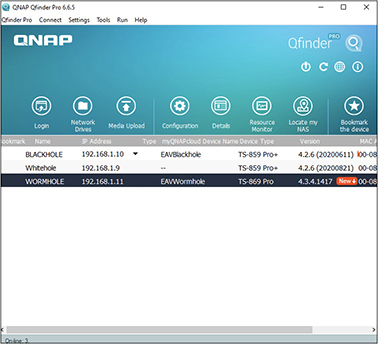
Figure 10-7 QFinder app monitoring for new firmware
It is important to only install official firmware obtained from the manufacturer. Some unofficial firmware may advertise advanced features or ways to get around the manufacturer’s programming, but these come at a cost. Some users have applied custom firmware to their cable modems in the hopes of obtaining faster Internet speeds but later discovered back doors hidden in this firmware that allowed attackers onto their systems. Unofficial firmware for mobile phones offers to allow users to obtain software from unofficial repositories at no cost. Installing such firmware is known as jailbreaking or rooting the phone. However, these firmware versions are not updated with the same security patches that the official firmware offers, and the software available on their repositories sometimes contains bugs or security vulnerabilities.
Signature Updates
A signature is a data sample that can be used to identify other data as data of the same type. Security software such as antivirus, intrusion prevention, antispam, or Internet filtering software uses signatures to identify the content they wish to block. Antivirus signatures help antivirus software identify malware. Each piece of malware, once identified, has a signature created for it. These signatures must then be applied to the antivirus software to understand what the malware looks like and take appropriate action. Figure 10-8 shows the Trend Micro antivirus client and the state of its signatures. Trend Micro calls its signatures agent patterns.

Figure 10-8 Trend signature (agent pattern) status
Similarly, intrusion detection systems (IDSs) use signatures to identify malicious traffic. An IDS would have a signature for TCP session hijacking, UDP port scan, or a Loki attack. Antispam systems use signatures to identify certain types of spam, while Internet filtering software can use signature lists to identify malicious web content and block it from being delivered to users.
Similar to patches and firmware, software must be kept up-to-date with the latest signatures, or it will not be able to identify new malware, attacks, spam, or malicious web content. Most security products can be configured to automatically download and apply new signatures. This relieves the burden of maintaining signatures. Put processes and software in place to monitor systems to ensure that they have the latest signatures. It is common for enterprises to have central software that antivirus systems check into and report back on their status, including their signature level, whether they have identified malware, their last scan date, and so forth.
Component Updates
There are some differences in updating different system components such as virtual machines, virtual appliances, hypervisors, networking equipment, storage, and clusters. A well-rounded IT professional needs to understand how to update each of these components.
Cloud services allow for some or many of the components to be managed by the CSP. This can reduce the time organizations spend on routine maintenance. For example, Amazon Web Services Relational Database Service (AWS RDS) hosts a database for use with applications or websites. The cloud consumer does not need to maintain the underlying server, operating system, database software, and networking. Instead, they can focus their efforts on the database housed within AWS RDS.
In another example, hosted options running software such as cPanel allow cloud consumers to deploy databases to a MySQL instance and then access them from cloud servers or websites. Some basic maintenance tasks, such as resetting the database administrator password or changing backup schedules and restores, can be performed by the cloud consumer, but the remaining maintenance is performed by the CSP.
Virtual Machines
Virtual machines can be updated independently using the same tools as a physical machine, but you also have some additional options. Some hypervisors can deploy updates to virtual machines. For example, vSphere Update Manager can deploy updates to virtual machines that reside on hypervisors managed by vSphere.
Here is the high-level procedure for automating the update process for the virtual machines:
1. Configure repositories for where Update Manager can find updates. Repositories are indexed sources for updates.
2. Create a baseline consisting of patches, service packs, upgrades, and hotfixes.
3. Schedule synchronization with repositories so that Update Manager is aware of new patches, hotfixes, upgrades, and service packs.
4. Assign virtual machines to a baseline.
5. Scan virtual machines against the baseline to determine which patches need to be applied.
6. Stage the patches by having Update Manager download the updates to vSphere for deployment.
7. Deploy patches to the virtual machines.
Virtual Appliances
Appliances are fully built and functional virtual machines that are purchased or downloaded from a vendor to perform a specific task. Before the age of virtualization, appliances would be rebranded servers or small rack-mounted equipment that would be purchased from a vendor to perform a task. Some vendors still offer physical equipment, but this is largely a thing of the past.
The advantage of using an appliance versus installing and configuring the software on a server is that the appliance is set up and mostly configured by the vendor. The company is provided with a ready-to-deploy virtual machine, which saves the organization valuable deployment time.
Some virtual appliances are available for free from open-source groups. Vendors may offer stripped-down appliances at no cost, or they may provide a fully functional unit to educational or nonprofit groups. If you purchase a virtual appliance or get it for free, you can download it from the vendor site as a virtual hard drive. Simply copy the virtual hard drive to your hypervisor, assign it resources, and start it up.
Virtual appliances will walk you through a configuration wizard to get the product up and running. When it comes time to update the virtual appliance, the vendor will package underlying updates together with its own software updates so that you can receive all updates in one vendor package. You can configure the appliance to download updates from the vendor and deploy them on a scheduled basis. Updates from the vendor have already been tested on the virtual machine, so there is a high likelihood that they will be deployed without issue.
Public CSPs, and in some cases private clouds, often have a marketplace where virtual machine templates and appliances can be selected to deploy new virtual machines in the cloud rapidly. These systems have already been confirmed to be compatible with the underlying cloud infrastructure, and they can be offered cost-effectively because of the CSP’s economies of scale. Research options for your CSP, because some offer many different solutions while others, usually small providers, may only offer one or two solutions. The options available to you may not be the ones ideal for your workload.
Firewall, IDS, and intrusion prevention system (IPS) virtual appliances are covered in the “Network Security” section of Chapter 12.
Hypervisors
Patching hypervisors will likely result in downtime to the virtual machines that reside on them unless the hypervisor is part of a cluster. You update a hypervisor in much the same way as you would a normal computer, but any updates that require a restart or updates to hypervisor services will make the virtual machines go into a saved state or shut down.
Networking Components
Devices such as firewalls, routers, switches, and Internet of Things (IoT) equipment have updates called firmware that can be downloaded from the manufacturer. Firmware updates are usually installed manually, but some vendors, such as Cisco, release tools that can update a multitude of systems simultaneously or in sequence. Check with the vendor of your equipment to find out which deployment options you have. It also helps to subscribe to the vendor’s mailing list for firmware updates so that you can be notified as soon as they are released.
Applications
It can be difficult to keep track of all the application updates to keep your application protected. Many applications will include an agent that keeps track of your software version and then notifies you when a new software version is available. Some agents will download the new software and then prompt for installation. Unfortunately, for the average computer running many applications, this can result in applications requesting to update all the time.
The solution is to turn off the agents and use a single third-party tool to manage the updates. Third-party solutions can scan the entire server or workstation to identify the software on it. The third-party vendor keeps track of the latest versions of all software and pushes the updates down to the computer through its tool.
Storage Components
Storage systems are one of the more complex items to update. An update to a storage system, also called storage array firmware or microcode, could affect other items in the data path, such as SAN switches or HBAs. Before applying a storage system update, ensure that devices on the data path (everything from the SAN to the initiator) support the upgrade. Devices on the data path often include the switch and HBA versions but could consist of other devices as well.
If all firmware versions for the devices in the data path meet the acceptable level for the storage upgrade, go ahead and install it. However, if a device is not supported at its current firmware level, you will need to upgrade it to a supported level first. Ensure that when you upgrade it, the updated version is supported on the current SAN version.
Clusters
Updates for cluster nodes can be done typically with no downtime to the end user. This is great for the end user, but the upgrade process is a bit more complicated for IT administrators. You will need to fail over services to free up a node so that it is not actively hosting any of the cluster resources and then update that node. You can then fail back services to that node and fail over the services on another node. Complete this process on all nodes until each node is running the same software versions.
Maintenance Automation
It can be quite a job to maintain many systems, and organizational IT departments are supporting more devices per person than ever before. They accomplish this through automation. Automation uses scripting, scheduled tasks, and automation tools to do the routine tasks so that IT staff can spend more time solving the real problems and proactively looking for ways to make things better and even more efficient.
PowerShell commands are provided in many examples because these commands can be used with the AWS CLI or the Microsoft Azure Cloud Shell. Scripts can be combined into tasks using AWS Systems Manager or Microsoft Azure runbooks.
This section discusses different activities that can be automated to save time and standardize. They include the following:
• Patch management
• Shutdown and restart
• Entering maintenance mode
• Enabling or disabling monitoring checks
Patch Deployment
Patch deployments can be scripted or controlled using patch management tools to streamline or automate the process of patch deployment. For example, with the following PowerShell command, an administrator can deploy all patches to a machine and reboot, if necessary. This command could be part of a script that iterates through a list of machines to then deploy patches on them with a few modifications. Also, please note that the PSWindowsUpdate module must be installed to make this update command available.
Get-WindowsUpdate -Install -AcceptAll -AutoReboot
Restarting
Systems run better when they are restarted regularly. However, regular restarts are not an option for all environments, but for those that can, a scheduled restart can help keep systems fresh and functional. Scheduled restarts are useful in other scenarios, such as performing maintenance on a host or some other system that requires many machines to be restarted.
Here is a PowerShell command that restarts four computers named computer1, computer2, computer3, and computer4. You can schedule this script to run as a scheduled task from a management machine with rights on each of the other servers.
Restart-Computer -ComputerName "Computer1", "Computer2", "Computer3", "Computer4"
Shutting Down
Scheduled shutdown events are applicable in maintenance or triage scenarios, such as when you are turning off all nonessential systems to save on resources.
Here is a PowerShell command that shuts down four computers named computer1, computer2, computer3, and computer4. You can schedule this script to run as a scheduled task from a management machine with rights on each of the other servers.
Stop-Computer -ComputerName "Computer1", "Computer2", "Computer3", "Computer4"
Entering Maintenance Mode
Whenever you do work on a host, it is important to put that host in maintenance mode. In fact, many maintenance tasks cannot be performed unless the host is first in maintenance mode. Some maintenance activities include restarting the host, applying firmware updates, or applying patches to the host.
Maintenance mode will migrate all the virtual machines to another host in a cluster and prepare the host for maintenance. Exiting maintenance mode will allow for virtual machines to be rebalanced across hosts in the cluster.
Many maintenance tasks can be scripted, and the transition to maintenance mode can also be placed in the maintenance script to automate the entire process. The following command can be scripted to enter into maintenance mode. Here we will assume our username is ESXAdmin and our password is 77}N50&a9fr-Q=i.
![]()
You can then script the transition out of maintenance mode in the script when the maintenance is complete. The following command can be placed at the end of the script to exit maintenance mode (assuming the same username and password):
![]()
Enabling or Disabling Monitoring Alerts
It can be very annoying to receive hundreds or thousands of e-mail notifications because someone forgot to disable monitoring alerts when doing server maintenance. Everyone who has gone through this knows what this means, because it simply destroys a mailbox. The good news is that if you forget, your coworkers are likely to remind you and not let you forget again.
Disabling alerts greatly depends on which tool is being used to send out the alerts, but there is usually a master pause function that can be enabled for the downtime. If you have regularly occurring downtimes such as patch downtimes, you can likely script this action.
Monitoring Techniques
Effective monitoring techniques provide an efficient means of monitoring all aspects of cloud infrastructure without placing a significant performance burden on the systems and network. Monitoring techniques track the performance of enterprise systems and provide detailed information on the current usage of the cloud environment that can be consolidated and displayed on dashboards or reports.
Cloud computing provides an efficient way of load balancing, task scheduling, and allocating compute resources. Monitoring compute resources is an important part of maintaining a cloud environment and ensuring that systems have adequate resources to perform their tasks. Some key benefits of resource monitoring include providing input for chargebacks and showbacks, more intelligent resource provisioning and proactive resource expansion or contraction, more effective capacity planning, and improved technology agility in response to an ever-changing environment.
One of the goals of monitoring the environment is to ensure the overall health of key systems and applications. System health information can be published to a corporate intranet site, allowing the entire organization or select decision-makers access to the health data. For example, an administrator might publish a dashboard on the company intranet site that shows the current SLAs of the organization and whether or not the IT department has met those SLAs.
Another place to use monitoring is in a chargeback situation. An IT department can monitor the environment and get a report on who consumed which compute resources and for how long, allowing the organization to charge departments for their use of compute resources.
The first part of understanding resource monitoring is understanding the protocols and methods used for resource monitoring, as discussed next. Then, this section discusses configuring baselines and thresholds and forecasting resource capacity. Finally, automation can be used to send alerts for specific events and thresholds, so this section concludes with a discussion on how that can be accomplished.
Collector Protocols and Methods
When defining a monitoring solution, it is crucial to understand the different collector protocols available for monitoring and the alerting options to problems that might arise in the cloud environment. Monitoring is enabled through a series of protocols and alerting methods that, in conjunction, can provide a robust system of threshold monitoring and alerting.
The following protocols and methods are presented in this section:
• Simple Network Management Protocol (SNMP)
• Windows Management Instrumentation (WMI) and WBEM
• Out-of-band management and Intelligent Platform Management Interface (IPMI)
• Syslog
SNMP
One of the common protocols used to manage and monitor an environment is SNMP. SNMP is commonly supported on devices such as routers, switches, printers, and servers and is used to monitor these devices for issues or conditions that might arise on the devices that would require administrative attention.
A monitoring solution that uses SNMP has an administrative computer, commonly referred to as a manager, that monitors or manages a group of network devices. Each managed device runs an agent, which reports information, using SNMP, back to the manager. For example, an SNMP agent on a router can provide information about the router’s network configuration and operations (such as network interface configurations and routing tables) and transmit that information back to the manager.
A variety of vendors use SNMP to monitor devices on the network; they use the information from SNMP to give an administrator a means of monitoring and managing network performance or reporting on and troubleshooting network issues. This knowledge enables administrators to better understand and prepare for network growth.
In addition to monitoring and managing an environment, SNMP allows for alerts to be generated. An administrator can use SNMP to modify and apply new configurations to network devices and be alerted when certain conditions are present on monitored network devices. SNMP uses notifications, known as SNMP traps, to alert on important information. SNMP traps are network packets that contain data relating to a particular component of the network device running the SNMP agent; they can notify the management stations by way of an unsolicited SNMP message that a particular event has occurred. SNMP traps are triggered when particular preprogrammed conditions are present on the monitored device.
WMI
Another option for monitoring an environment is WMI, Microsoft’s version of WBEM. WBEM is an industry initiative to develop a standardized way of accessing management information in an enterprise environment.
WMI allows you to write scripts to automate certain administrative tasks and run those scripts against remote computers. WMI can query and set information on a workstation, server, application, or supported network device.
WMI provides a way to gather hardware information from multiple physical servers or virtual servers. WMI information can be placed into a centralized database, allowing for the collection and reporting on a variety of information, including CPU, memory, operating system, and hard drive space.
WMI information can assist in determining if a system is close to maximizing compute resources, which may necessitate an upgrade to meet demands. For example, Microsoft System Center Configuration Manager (SCCM) uses WMI to gather hardware information from its clients and allows an administrator to manage and report on those systems based on the information gathered from the WMI queries.
EXAM TIP WMI can gather information about the installed software and the operating system version on a computer, along with hardware information.
Out-of-Band Management and IPMI
Out-of-band management allows an administrator to remotely manage and monitor a device using a separate network segment from normal production traffic. Out-of-band monitoring can be implemented with the IPMI protocol, which can monitor a device that is not powered on. IPMI operates independently of the operating system, which allows BIOS settings to be remotely monitored or configured.
EXAM TIP Out-of-band management allows for remotely monitoring BIOS settings.
Syslog
One of the most common ways to gather event messages is with the use of Syslog. Syslog is a logging standard that provides a mechanism for a network device to send event messages to a logging server or Syslog server over UDP port 514 or TCP port 514.
One of the benefits of a Syslog server is that the Syslog protocol is supported by a wide range of devices and can log different types of events. Syslog cannot poll devices to gather information as SNMP does; it merely gathers messages sent by various devices to a central Syslog server when a specific event has triggered. Each device is configured with the location of the Syslog collector and sends its logs to that server for collection. Syslog can be used to consolidate logs from multiple devices into a single location for review, analysis, or archival purposes. Figure 10-9 shows an example of a standard Syslog server entry.

Figure 10-9 A sample Syslog entry
Tagging
Tagging is a method of adding metadata or classification to log entries. Tags can be used to enable faster searching of data or more enhanced log processing. Tagging can be performed automatically as part of a processing task.
Let us consider several examples. An application may add tags to the log to give context to the events. A spam filter, for example, might tag specific messages as junk, spam, or bulk. Tags can also be applied manually by the engineers, who review the logs to more easily work with the data. For example, an engineer may identify a potential indicator of compromise (IOC) and could tag the event for further follow-up and research.
Log Analysis
Servers, network devices, and cloud services all produce logs. These logs show activity to varying degrees of specificity, depending on the logging settings, and they can be analyzed to re-create a situation or identify a threat.
Log Types
Log types and formats vary based on the device type and the services running on it, but there are some logs that are common to most machines. Windows systems have the following log files on them at a minimum:
• Application log The application log contains information related to drivers and software installed on the machine.
• Security log The security log contains successful and failed authentication to the system. It also records when an account escalates its privileges and audited events.
• Setup log The setup log contains information on patches that have been applied.
• System log The system log records information on operating system messages and the launching or termination of services.
The Windows logs can be viewed through the Event Viewer program. You can access this by going to Start | Run and then typing eventvwr.msc . The Event Viewer is shown in Figure 10-10.

Figure 10-10 Event Viewer on a Windows computer
Linux systems keep a wide variety of logs. Some of the most crucial logs to monitor include the boot log, which records information on boot-up processes and issues; the security log, which logs failed and successful authentication; and the Yum log, which records installations that use the yum command.
Servers running Active Directory store a record of all domain authentication requests in their security log. This is an important log to review to determine when a user logged on and to what resource.
Web server logs are important for identifying connections to the server. This can be used to investigate attacks or troubleshoot transactions. Apache web servers store their data in the HTTP log, and Windows IIS servers store their logs in the webserver log. Table 10-2 shows some of the Linux log files and their locations on the system.
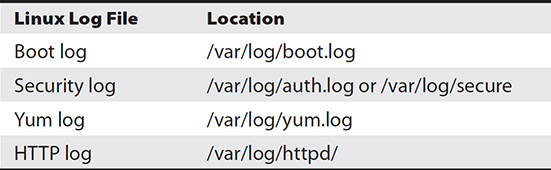
Table 10-2 Linux Log File Locations
Event Correlation
Logs can be reviewed for each device individually, but this is hardly efficient. Furthermore, each log represents a microcosm of the whole. A firewall log will give you part of the picture, but when combined with the authentication records from a domain controller or the file access logs of a file server, they reveal the whole picture. Logs are immensely more valuable when correlated with logs from other systems and network devices. Cloud machines do not operate in a vacuum, so log review should also take into consideration other devices when investigating issues or detecting threats. This is where event correlation steps in.
Event correlation can combine authentication requests from domain controllers, incoming packets from perimeter devices, and data requests from application servers to gain a more complete picture of what is going on. Software exists to automate much of the process.
SIEM
A security information and event management (SIEM) system archives logs and reviews logs in real time against correlation rules to identify possible threats or problems. Additionally, a SIEM system monitors baselines and heuristics to identify issues that crop up before they balloon into more significant issues. The information is presented so that log analysts can easily filter, sort, and report on the data or investigate threats. A dashboard with metrics from the SIEM LogRhythm is shown in Figure 10-11.
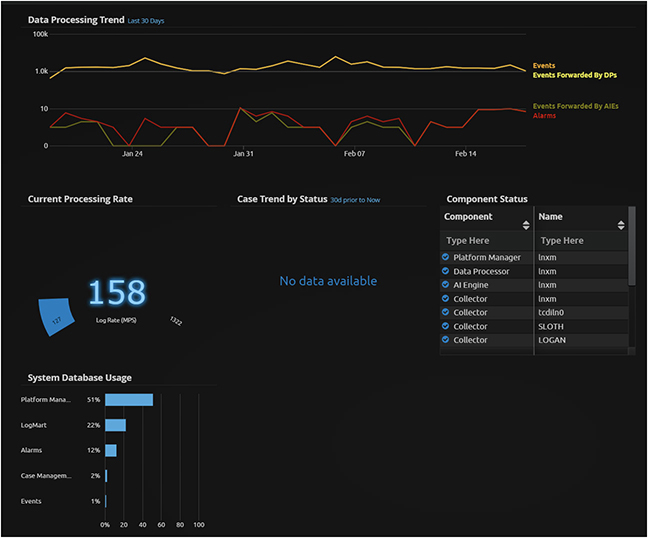
Figure 10-11 SIEM metrics
For example, when analyzed together, several informational events may present a more severe issue that can be resolved before it creates problems for end users. Without such a system, administrators would likely not notice the events until errors or warnings appeared in the log, which would probably be the same time users of the system also experienced issues. Figure 10-12 shows how log entries are displayed in a SIEM.

Figure 10-12 SIEM log entries
It is much easier to fix issues before end users discover them and begin complaining. IT administrators tend to think more clearly and logically when not under pressure. SIEM can change how IT administrators investigate issues, eventually causing them to focus more on proactive indicators of a problem rather than fighting fires.
Event Collection and Event Collection Policies
A server can consume a lot of space with event logs. All too often, companies configure small log sizes with rollover so that recent events automatically replace old ones. However, these same companies often find out too late that the events they need to see have already been overwritten.
Establish policies to ensure that events are retained for a sufficiently long period of time. Your data retention policy is an excellent place to start. A good retention rate for logs is 18 months. This can consume a lot of space on the local machine, so it is a best practice to archive logs off to lower-cost secondary storage or to a log review platform. A log review platform can also centralize log review, log analysis, and alerting functions, simplifying the entire event management process. After an organization chooses and configures its event collection policy, its next step is to develop a baseline.
Severity Categorization
Each item in a log is referred to as an event. These events can be categorized based on their severity level. The Windows event severity levels include critical, warning, error, and information. You can filter the event log based on items of a specific severity level, and log collection systems will use this value when evaluating events. The filter settings for the Windows event log are shown in Figure 10-13.
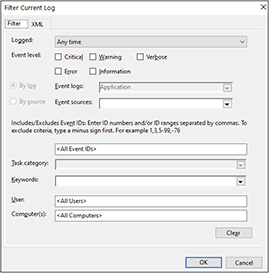
Figure 10-13 Filter logs by severity level

CAUTION Just because an event is labeled as information does not mean that it is not essential in an investigation. SIEM systems may identify a threat from information events on multiple machines.
Baselines
The purpose of establishing a baseline is to create a sample of resources consumed by the cloud services, servers, or virtual machines over a set period and provide the organization with a point-in-time performance chart of its environment. Establish a baseline by selecting a sampling interval and the objects to monitor and then collecting performance data during that interval.
A good baseline must include an accurate sampling of everyday activities. If the activity is roughly the same from week to week, then one week’s baseline might be sufficient. However, if activity fluctuates from week to week, the baseline needs to be longer. If a baseline were created for only a week and activity differed the next week, those differences would appear as outliers and be flagged as potential problems when they are actually just regular activity that was not captured in the baseline. However, do not go overboard on baseline collection, because a lengthy sampling interval can consume a significant amount of disk space and bandwidth.
Performance metrics collected when users report sluggish performance or slow response times can be easily compared to the baseline to see if performance is within normal tolerance. Continue to collect metrics at regular intervals to get a chart of how systems are consuming resources.
For example, suppose a user says that a database server is responding exceptionally slowly. In that case, the IT department can use a baseline to compare the performance of the server when it was performing well to when the user reported the slow performance.
Some software products such as VMware vCenter Operations Manager (VCOP) and Microsoft System Center Virtual Machine Manager (SCVMM) build an internal baseline over time. The baseline can be used to reveal patterns and outliers. For example, a cloud administrator may notice over 12 months that the average memory usage has increased 10 percent, which helps plan for additional resources for the server in the near future.
Target Object Baselines
Baselines should be collected not only for entire systems but also for objects within the system, such as CPU utilization, memory pages per second, CPU queue depth, memory utilization, data reads per second, data writes per second, and so forth. These values can be instrumental in determining how to improve performance over time, optimize resources for utilization, and upgrade components so that they provide maximum value to the organization.
Target Anomalies
Baselines can be used to detect anomalies. Anomalies are events that are outside the norm. The baseline shows the norm, and the anomaly can indicate a short-term increase in utilization or a problem in the works. A pattern can be inferred from baseline data, and this pattern can be used to identify anomalous data collected thereafter.
Thresholds
In addition to establishing a baseline, an organization needs to configure thresholds. When it comes to monitoring a cloud environment, thresholds are a key piece of the process. Thresholds can be set so that if a virtualization host consumes more than 95 percent of its CPU for more than 10 minutes, it sends an alert via either SMTP or SMS to the appropriate party (as described later in the chapter).
Setting a threshold allows for a more robust alerting system. Thresholds can also be used to automatically and dynamically create and orchestrate resources in the cloud computing environment. (“Orchestration” refers to automated tasks that could be scripted to happen based on particular conditions and triggers.)
Cloud computing allows a cloud consumer to define a threshold policy to check and manage resources when workload demands require. This allows the cloud provider to create instances of resources depending on how much the workload exceeds the threshold level. For example, a defined threshold could state that if CPU utilization for a particular virtual machine reaches 95 percent for 5 minutes, utilizing orchestration APIs, an additional processor should be added dynamically. The next step after determining thresholds is to perform trending.
Trending
Baselining and thresholds are useful in comparing current data to historical data and identifying some alert conditions. The same information can also be used for trending. Trending looks at baseline values over time to predict likely future utilization.
Trending can be used to forecast resource capacity to ensure that you have the resources you need and the associated budget for them when those resources are required. It can also easily show how resource consumption will increase or decrease.
Forecasting Resource Capacity
Trending can be used to identify future resource needs. It is often helpful to compare year-to-date numbers and compare corresponding months across years. Start tracking this data now, and you will see how useful it will be later. Some trends are based on the annual cycle, so it is sensible to look at trends over a 12-month period.
CAUTION Far too many companies wait to start collecting resource metrics until they urgently need answers. If you are not collecting data now, you will not have it available for analysis later when you need it, so put such systems in place right away.
Upsize/Increase
Trends may show an increase or upsize over time. For example, suppose storage consumption was 100GB in January, 105GB in February, 109GB in March, 117GB in April, and 121GB in June. In that case, we can conclude that storage will need to increase a minimum of 5GB per month and that some months will increase more than that.
Downsize/Decrease
Conversely, trends may show a decrease over time. This could be due to efficiencies in the system or decreasing use of the application or system. For example, if memory consumption was 28GB in January, 24GB in February, 26GB in March, 22GB in April, and 23GB in June, we can conclude that storage will decrease about 2GB per month with a standard deviation of 4GB per month.
Automated Event Responses
While monitoring and alerting are great ways to minimize problems in the cloud environment, some issues arise with using these features. When an organization is monitoring and alerting on all its devices, the number of alerts that might arise could be staggering. If an administrator gets too many alerts, he or she may not have enough time to respond to those alerts. This may result in some issues going unnoticed or not given the attention they deserve.
This is where automated event responses can help. For example, let’s say an administrator gets an alert that a hard drive is at 99 percent capacity. Instead of manually logging into the server and deleting files or running a disk cleanup program, the entire process can be scripted and executed by a trigger on the threshold. Once the threshold is hit, that triggers the script to run that performs the task. Automating minor tasks can save administrators considerable time and allow them to focus on more pressing issues. It also ensures that the tasks are carried out correctly and promptly.
As an example, one time, I was asked to help an organization manage its monitoring environment. I recommended the organization buy monitoring software that allows for automated responses. I configured thresholds and alerts based on the organization’s needs. I then configured the most common alerts with an automated response that would run a script to fix the issue and resolve the alert in the monitoring software.
Common Alert Methods/Messaging
An organization needs a way to be alerted when certain events occur. For example, if the organization is monitoring a server and that server loses network connectivity, IT administrators need to be notified of that occurrence so they can fix the issue that is causing the problem.
Many vendors offer network monitoring and alerting solutions both for on-premises and cloud-based deployments. Most vendors provide a website or some form of web service to monitor an organization’s cloud environment centrally, whether the cloud is private or public. The web service provides a dashboard that gives the administrator a quick and easy view of the entire cloud environment.
SMTP One of the most common alerting methods used is the Simple Mail Transfer Protocol (SMTP), discussed in Chapter 4. When configured on a device, SMTP sends an e-mail when a monitored event occurs. The alert can be configured to send an e-mail to a single user or to a group of users so that more than one person receives the alert. SMTP is a quick and easy way of sending alerts from the monitoring software when certain events occur on the network.
SMS Another option for receiving alerts is the Short Message Service (SMS), a text messaging service that allows an alert to be sent to a mobile device. SMS is a great way to notify an on-call technician when an alert has been generated after hours. Monitoring an environment is normally a 24-hour job because the network needs to be available 24 hours a day.
Enabling and Disabling Alerts
There is a balancing act when enabling and disabling alerts. It might seem like a good idea to enable everything so that you are aware of what is going on, but no one has time to review every alert, and IT administrators quickly become numb to the alerts and no longer review them if you configure alerting in this way. It is important, therefore, to select only the alerts that matter to your organization.
Cloud portals usually have a section for alerts where you can configure how alerts will be processed. Some may be e-mailed to a recipient or group, while others will be retained in the dashboard for review when someone logs on or when investigating an issue. Figure 10-14 shows the Office 365 Security & Compliance alerting section.
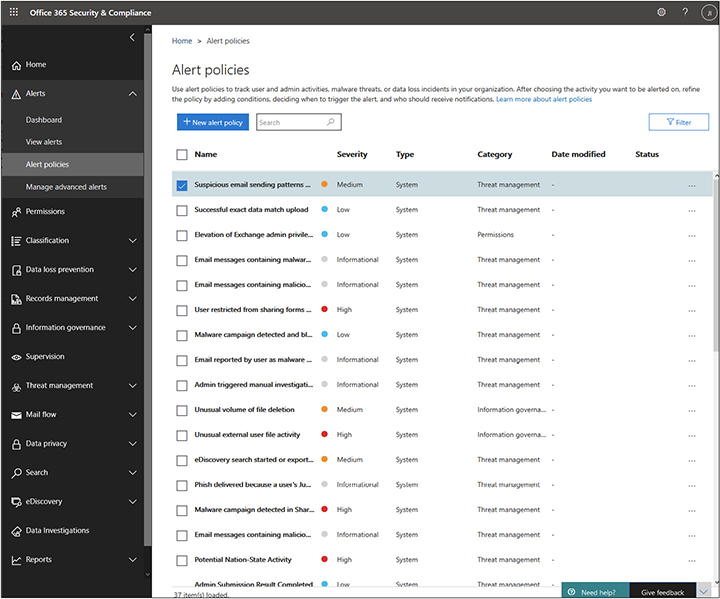
Figure 10-14 Office 365 Security & Compliance alerting section
For example, the suspicious e-mail sending patterns alert could be configured to e-mail a group by selecting the alert policy and then clicking Edit Policy. The Edit Policy screen allows for e-mail recipients to be set, as shown in Figure 10-15.
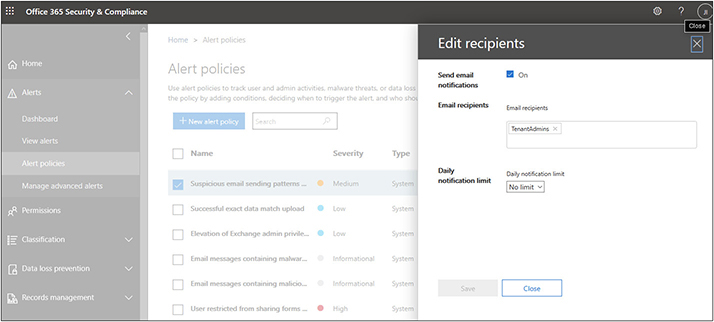
Figure 10-15 Configuring e-mail alerts for Office 365 alert policies
Maintenance Mode Servicing a virtualization host can cause problems for the machines running on the host if it is not done properly. Setting a host to maintenance mode will migrate the VMs that are currently running on that machine to other hosts so that you can perform work on it. The host will not allow VMs to be deployed or migrated to it while it is in maintenance mode.
You can put a VMWare host into maintenance mode with the following procedure:
1. Log into your virtualization environment. This step will depend on where it is hosted.
2. Browse to the host you want to service and right-click it.
3. Select Maintenance Mode | Enter Maintenance Mode
4. Wait while the machines are migrated off it. The host will show a status of “Under Maintenance” when the process has been completed.
5. Perform your maintenance.
6. Return the host to service by selecting Maintenance Mode | Exit Maintenance Mode.
Alerting Based on Deviation from Baseline
Make sure to save your baseline data. You can use simple spreadsheets, but a database is the best way to protect such data because it allows you to write queries to analyze the data in different ways. As you gather the data, configure alerts to let administrators know of significant deviations from the baseline. Resources may need to be adjusted to handle short-term spikes in demand, or this could indicate the start of a new trend. Either way, it is valuable to be aware of these changes as soon as possible.
Alerts can be configured such that when metrics are a certain percentage above the baseline, an alert is sent to a specific individual or a distribution group. For example, you may want to send out an alert if CPU utilization is 40 percent more than average for a sustained duration of at least ten minutes. You can also configure alerts to go out when certain static thresholds are met. For example, you may plan to expand a LUN when it reaches 100GB, so you set an alert that notifies you when the LUN reaches that point.
Policies to Communicate Events Properly
Metrics are not the only thing that should prompt alerting. Some events require immediate attention. These events cannot wait until an administrator reviews the logs. For such cases, policies should be created defining which events need notification and how administrators should respond to such alerts. For example, the policy may state that a critical event requires immediate notification to the on-call administrators and that administrators must respond to the event within five minutes and resolve the event within one hour.
Once the policy is defined, technical controls can be implemented to carry out the policy. Triggers can be created to alert on such events to a person or group right away, and systems can be put in place to track resolution time and who is on call.
Appropriate Responses
The appropriate responses to events should be thought out ahead of time. For example, if you are e-mailing an alert to an IT team, what do you expect them to do with that alert? The appropriate response should include investigating the alert and possibly taking some action on it. If it was important enough to e-mail out, it should be important enough to act on.
The specific actions will depend on the type of alert. For example, a message about a detected virus may prompt a full scan of the machine, while an event for multiple failed login attempts might prompt reaching out to the user to see if they are having trouble logging in. Define these expectations so that your teams will effectively respond.
Log Scrubbing
You may share log information with others as part of your normal course of business. Some log entries may contain sensitive information that you do not want to be divulged to other parties. For example, you may share logs with consumers so that they can investigate issues with their own service, but you will want to exclude entries from other clients. You could share logs with others in your supply chain to help remediate issues that affect multiple entities, but you might hide the internal IP addresses or names of specific machines.
The process of removing sensitive information from logs is called log scrubbing, and it is typically implemented by applying scrubbing policies to the process of exporting or exposing the logs to another application. If you are making your logs available via an API call, this would be performed as part of the API response process.
Verification of Continuous Monitoring Activities
Systems can be configured to continuously monitor applications or cloud services, but how do you know if those services are continuing to function properly? Regular checks of routine activities such as continuous monitoring are essential to ensure that such services continue to perform their function. The last thing you want is to find out that a key service was not functioning when its need is mission-critical. In the case of monitoring, you want to know it is running so that a security threat does not fly under your radar.
Establish processes to routinely check such services, or have checks built into other services to cross-check each other and notify you if a service becomes unavailable or if monitoring functions change.
Management Tools
There are a wide range of tools to manage cloud systems. They can be divided into three different types: CLI, Web GUI, and Cloud Portal. Each offers its own features and advantages depending on your purpose. Management tools can have different interfaces, and there are pros and cons to the interface depending on how the application is going to be used.
CLI
The command-line interface (CLI) is an interface that is text-based. The user must type instructions to the program using predefined syntax in order to interact with the program. For example, Microsoft Azure and Amazon Web Services each have their own CLI. Figure 10-16 shows the Azure Cloud Shell CLI.
Figure 10-16 Azure Cloud Shell CLI
CLI tools can seem cumbersome to those most familiar with graphical user interfaces (GUIs), but their power comes with the ability to script them. A task that could take 30 minutes of clicking in a GUI to accomplish could be achieved in a few minutes with a script because all the functions are preprogrammed with a series of commands. CLI tools are usually more lightweight, so they are easier to deploy and have less of a burden on systems.
Web GUI
Graphical user interfaces are easy to work with. Simply point and click on something to take an action. Users can get to work on an application very quickly if it has a GUI. Web GUIs offer that functionality from a web browser. The advantage of a web GUI is that tools can be administered from any machine that can connect to the web server and has the authorization to administer the tool.
Cloud Portal
A cloud portal is an interface that is accessed over the Internet to manage cloud tools or integrate with other tools. The portal displays useful dashboards and information for decision-making and ease of administration.
Cloud portals are like web GUIs, but they can be accessed from almost anywhere. Cloud portals are great for administering cloud tools and for integrating with a variety of legacy tools that would have required logging into many different web GUIs, launching traditional applications, or sending SSH commands to a CLI.
Chapter Review
Successful delivery of a cloud solution is driven not just by the technical components that make up that solution but by clear policies and standard operating procedures. The successful design, documentation, and methodical implementation and support of those technical resources result in an effective solution that is profitable for the IT provider and valuable to its customers.
Processes and procedures allow for control of the environment through life cycle metrics, dashboards and reporting, standardization, and planning. These control mechanisms make certain that the environments are designed to meet business requirements and are deployed and supported according to that design.
IT systems require regular maintenance to keep them free from vulnerabilities and bugs and to keep up with the latest technologies and processes. Maintenance and development updates can consume a great deal of IT personnel time. Maintenance and development are core to the business. This includes making code updates, documenting those updates in code repositories, ensuring that patches are applied to systems in a timely manner, and automating common maintenance tasks to do more with limited IT resources.
Monitoring the network is a key component of DevOps and cloud computing. Monitoring allows an organization to plan for future resource utilization and respond to issues that arise in the cloud environment. Combining monitoring and alerting gives an administrator a way to be proactive instead of reactive when it comes to the cloud environment.
Questions
The following questions will help you gauge your understanding of the material in this chapter. Read all the answers carefully because there might be more than one correct answer. Choose the best response(s) for each question.
1. Which of the following defines the rule sets by which users and administrators must abide?
A. Procedures
B. Change management
C. Policies
D. Trending
2. Capacity management has responsibility for ensuring that the capacity of the IT service is optimally matched to what?
A. Demand
B. Future trends
C. Procedures
D. Availability
3. Carlos works in the IT department at Sample Bank. He uses a cloud-based e-mail system and has been asked by his manager to establish metrics on mailbox usage per department so that department budgets can be billed for the expense of hosting department e-mail. What is this practice known as?
A. Chargeback
B. Billback
C. Pass-through charge
D. Showback
4. When should maintenance windows be scheduled?
A. In the morning
B. In the evening
C. On weekends
D. When they will least affect customers
5. Which of the following is not a benefit of standardization?
A. Consistent management
B. Better control of system access
C. Uniform logging across systems
D. Flexible deployment scenarios
6. Donna has been developing software for her company. She makes a copy of the directory where her code is stored each time she makes a significant change. However, the project she started years ago is now much larger, and two other developers also work on the program with her. She would like a way to better manage the code so that she can revert to previous states if necessary and track changes made by each person. Which technology would you suggest?
A. Continuous integration application
B. Code repository
C. Workflow automation
D. Chargebacks for each developer
7. Which of the following is not a method for deploying application updates?
A. Manual version updating
B. End-user updating
C. Using DevOps ticketing
D. Using a package manager
8. Which landscape is used for testing small changes made to code immediately after development?
A. Development
B. Quality assurance
C. Testing
D. Production
9. Which of the following can be used to identify which operating system version is installed on a virtual machine?
A. WMI
B. SMTP
C. SMS
D. IMAP
10. Which of these can be used by both a cloud consumer and a cloud provider to give a visual picture of performance metrics?
A. API
B. SNMP
C. Dashboard
D. SMTP
11. Which of the following utilizes UDP port 514 when collecting events?
A. SNMP
B. Syslog
C. WMI
D. Web services
12. Which of the following can be used to create scripts that can be run against target computers to perform simple administrative tasks?
A. WMI
B. SMTP
C. SMS
D. IMAP
13. Which of the following constantly executes a software component called an agent, which reports information using the protocol back to a manager?
A. WMI
B. SMTP
C. SMS
D. SNMP
14. Which of the following alerting methods allows a technician to receive an alert on a mobile device such as a cell phone?
A. SMTP
B. SMS
C. SNMP
D. Syslog
15. Which of the following alerting methods can be configured to send an e-mail when a certain alert is triggered?
A. SMTP
B. SMS
C. SNMP
D. Syslog
16. Which of the following allows for out-of-band management of a computer?
A. WMI
B. SMS
C. SNMP
D. IPMI
17. You have been tasked with gathering a list of software installed on all the computers in your environment. You want to gather this information remotely. Which of the following would you use to gather this information?
A. WMI
B. SNMP
C. HTTP
D. Syslog
Answers
1. C. Policies are defined as rule sets by which users and administrators must abide.
2. A. Capacity management’s primary objective is to ensure that the capacity of an IT service is optimally matched with its demand. Capacity should be planned to meet agreed-upon levels, no higher and no lower. Because controlling costs is a component of capacity management, designs that incorporate too much capacity are just as bad as designs that incorporate too little capacity.
3. A. Chargebacks can be used to establish metrics on mailbox usage per department so that department budgets can be billed for the expense of hosting department e-mail.
4. D. A maintenance window is an agreed-upon, predefined time period during which service interruptions are least impactful to the customer. This could fall at any time and depends on the patterns of business activity for that particular customer.
5. D. Flexible deployment scenarios is not a benefit of standardization because standardization establishes consistent deployment scenarios and does not allow for each one to be deployed however the user or administrator wishes.
6. B. A code repository organizes code branches to keep code consistent even when multiple teams are working on the same areas in parallel. Developers can publish code changes to the repository, can synchronize their local copy of the code with the repository, or can revert to previously published versions.
7. C. DevOps ticketing is not a method for deploying application updates. The methods are manual version updating, end-user updating, and using a package manager.
8. A. Small changes made to code are tested immediately in the development landscape before being passed to other landscapes.
9. A. Windows Management Instrumentation (WMI) provides an administrator a way to gather hardware information from multiple physical servers or virtual servers and put that information into a centralized database.
10. C. A dashboard is a great way for both the cloud consumer and cloud provider to access key metrics when it comes to monitoring cloud resources. A dashboard can give a summary of the current usage of the cloud resources in an easy-to-view format of charts and graphs.
11. B. Syslog provides a mechanism for a network device to send event messages to a logging server or Syslog server using UDP port 514 or TCP port 514.
12. A. Windows Management Instrumentation (WMI) allows you to write scripts to automate certain administrative tasks and run those scripts against remote computers.
13. D. A monitoring solution that uses SNMP has an administrative computer, commonly referred to as a manager, that monitors or manages a group of network devices. Each managed device constantly executes a software component, called an agent, that reports back to the manager.
14. B. Short Message Service (SMS) is a text messaging service that allows an alert to be sent to a mobile device.
15. A. Simple Mail Transfer Protocol (SMTP) can be configured to send an e-mail alert when a certain monitored event occurs.
16. D. The Intelligent Platform Management Interface (IPMI) operates independently of the operating system. It provides out-of-band management and monitoring of a system before the operating system is loaded, which allows BIOS settings to be remotely monitored or configured.
17. A. With Windows Management Instrumentation (WMI), it is possible to query workstations remotely and gather a list of all the software installed on those workstations.