3.5. Review: Selling the Airtime
The Data Flow Diagram As a Recording Device
During your early interviews with the users, the data flow diagram can serve as a note-taking device. As people talk, draw processes and data flows. Your diagrams won’t be great art, but they nevertheless have a use. You capture what the users said, and immediately afterward confirm that you have the correct interpretation of what they said.
For example, the model in Figure 3.5.1 shows that bubble 3.4 SET SALES POLICY RATES updates the BREAKCHART with BREAK MINIMUM RATE. You show this model to Stamford Brook, sales manager, and ask him, “Is this right? Is it true that when you set the sales policy, you update the minimum rates on the breakchart?” If this isn’t true, if he said something he didn’t mean or you misunderstood what he said, now is the time to find out. You have no ego invested in this model (nobody can love a diagram with fourteen bubbles), and you cannot mind changing it. After all, its purpose is to provide you with an accurate and unambiguous statement of what happens in the Sales Department. Changes now will save time later on.
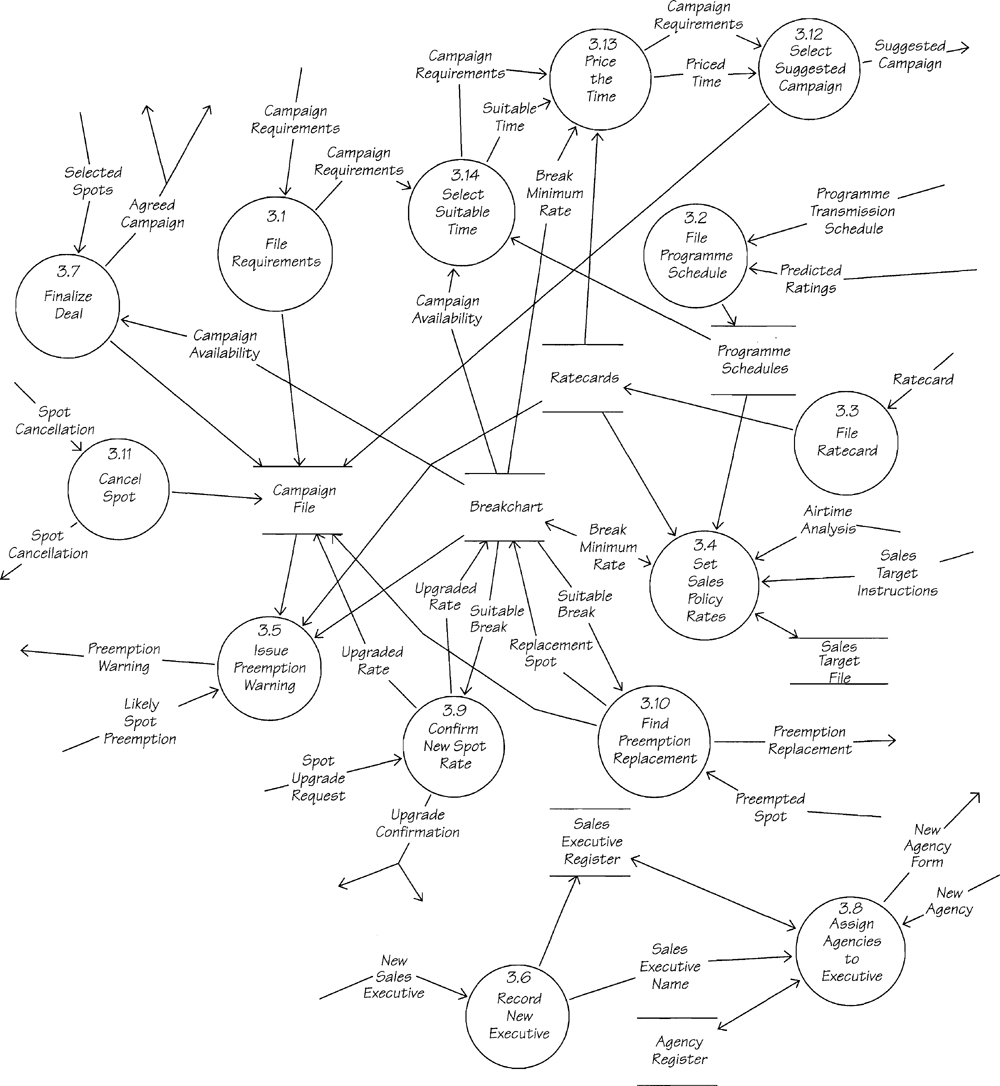
Figure 3.5.1: Preliminary version of Diagram 3 Sales Department, reflecting what Stamford told you. There are too many processes in this diagram, but this can be fixed later by leveling upward. At this stage, the model is used to confirm Stamford’s description of the business.
The model should be comprehensible to Stamford. If he were available, you would walk through the model with him and raise all the questions you could. Maybe he would disagree with your model, or contradict something he said, or remember something he forgot to tell you. What you would be doing is communicating with him in a language he could understand.
Don’t worry if initially there are no data flows joining all the processes in your diagram; you’ll find these when you go over the model with the users. Also don’t be too concerned if your model breaks some of the rules discussed in this book. You can clean it up later.
Leveling Upward to Reduce Complexity
The first thing that strikes you about this model is that there are more bubbles in it than we recommend in Chapter 2.7 Leveled Data Flow Diagrams. When you use a data flow diagram as a note-taking device, this often happens. Sometimes, it results in models even more complex than this one. As an information-gathering tool, that’s fine, but you cannot leave the model in this state forever.
To control the complexity and reduce the number of bubbles, group processes to create a high-level summary. Before making this higher level, though, you have to identify which processes can be logically grouped together.
There are two guidelines. The first is to group processes so that you minimize the number of interfaces at the highest level. This can be done by trial and error, but it is probably faster to look for groupings of bubbles that are closely connected to each other but loosely connected to anything else. The second guideline is to look for groups of bubbles with similar functionality so that the group can be given a functional name that is meaningful to the business being studied.
Figure 3.5.2 is the result of leveling upward. Bubbles 3.5, 3.9, 3.10, and 3.11 (from Figure 3.5.1) were functionally related and were consolidated into the honestly named process MAKE CHANGES TO SPOTS. We also grouped bubbles 3.1, 3.12, 3.13, and 3.14, which had data flow connections, into one high-level bubble called PLAN CAMPAIGN.
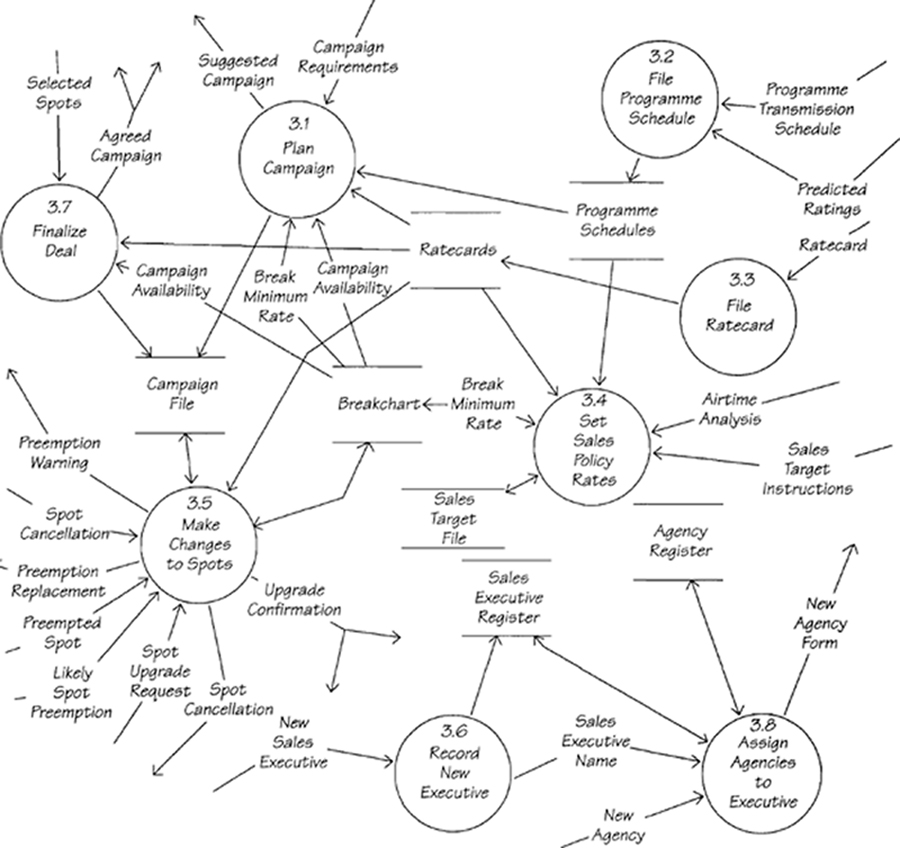
Figure 3.5.2: Second version of Diagram 3 Sales Department, combining some of the bubbles of the previous version. It was leveled upward to make the model less complex. Notice how many of the processes have interfaces through the use of common physical data stores.
The model shown in Figure 3.5.2 is more presentable. It shows all of the functionality of the Sales Department, but does it in only eight bubbles. This model would be used to present an overview of the department, or to reassure Stamford if he became apprehensive over the complexity of the previous version. The details of the department are not lost, and they are now shown in two lower-level diagrams 3.1 and 3.5. These appear in Figures 3.5.3 and 3.5.4, respectively.
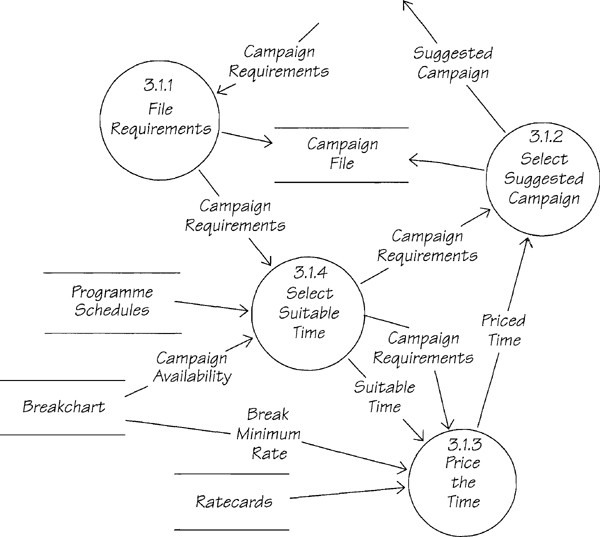
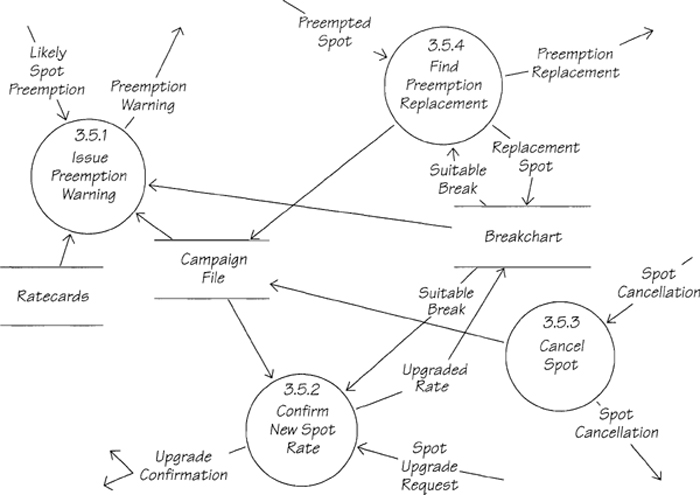
Figure 3.5.4: Diagram 3.5 Make Changes to Spots. This diagram shows the processes that were summarized in the higher-level diagram.
The Big Picture
Your work in the Sales Department has identified two new data flows: SPOT CANCELLATION, which comes from the agency; and PREEMPTION REPLACEMENT, which goes to the agency.
To keep your models in balance, you have to add these data flows to Diagram 0 (Figure 3.3.1) and the context diagram (Figure 3.3.2). Figures 3.5.5 and 3.5.6 are updated versions of these diagrams.
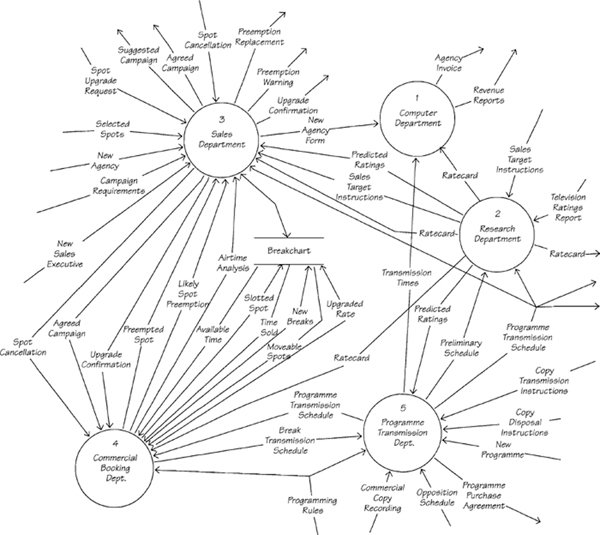
Figure 3.5.5: Updated Diagram 0 contains the two new data flows identified during your work in the Sales Department.
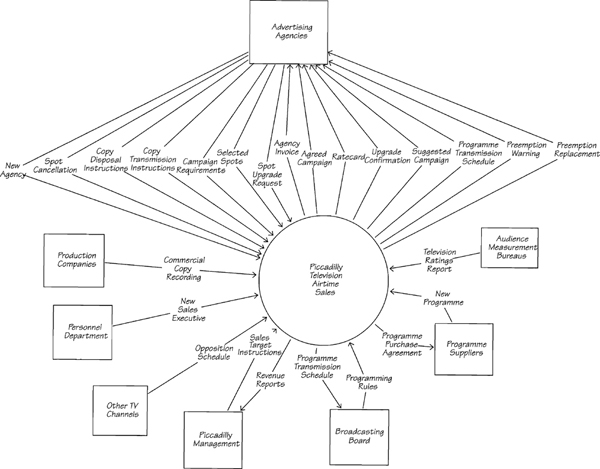
Figure 3.5.6: Updated context diagram. The two additional data flows were both interfaces with terminators, so they must be shown in the context diagram.
 Ski Patrol
A common error with lower-level data flow models is to omit the processes that store data. If a data flow that originates outside the context of your diagram is to be stored, there must be a process to store it. For example, some of Piccadilly’s data originate in the advertising agencies, but they have no mechanism to store data inside Piccadilly’s system. Besides, it is not desirable for outsiders to be able to change data. Similarly, if the data originate in a bubble that is not part of your diagram, you still must have a process to store it. Data cannot come from out of nowhere and go directly into your data stores. You must control the storage.
It is not necessary that you have exactly the same diagrams as these samples. You may have partitioned the problem a different way. However, you should have one or more models that you would feel confident about talking through with Stamford Brook.
By this stage of the Project, we want you to feel comfortable with drawing leveled data flow diagrams, and maintaining the correct balance between levels. Remember that having balancing abnormalities does not always mean that the lower-level diagram is wrong. Sometimes, the parent diagram needs to be changed because it fails to show a flow or store that appears in the more detailed child diagram.
If you have any questions about the symbology used in data flow diagrams, review Chapters 2.2 Data Flow Diagrams and 2.6 More on Data Flow Diagrams. Chapter 2.7 Leveled Data Flow Diagrams provides reference material on how leveling works. If you are having trouble with why you want to build a model of the current system, try a detour through Chapter 2.8 Current Physical Viewpoint. We also want you to be confident with your ability to record data dictionary entries. A refresher on the notation can be found in Chapter 2.9 Data Dictionary.
What to Do
Trail Guide
![]() Easiest,
Easiest, ![]() More Difficult, and
More Difficult, and ![]() Most Difficult: Go to Chapter 1.7 Strategy: Focusing on the Essentials. Now you’ll leave the physical model to move on to a more logical view of the system.
Most Difficult: Go to Chapter 1.7 Strategy: Focusing on the Essentials. Now you’ll leave the physical model to move on to a more logical view of the system.
![]() Promenade: You may rejoin your trail in Chapter 2.8 Current Physical Viewpoint, where you will learn more about the change in direction the Project is about to take.
Promenade: You may rejoin your trail in Chapter 2.8 Current Physical Viewpoint, where you will learn more about the change in direction the Project is about to take.