Chapter 8
Stage 4—Optimize
If you're trying to persuade people to do something, or buy something, it seems to me you should use their language.
—David Ogilvy
Organizations in this stage focus on optimizing digital initiatives. This stage uses a combination of analytics aimed at actionable insights and optimization using testing and personalization (see Figure 8.1).

Figure 8.1 Sitecore® Customer Experience Maturity Model™—Optimize Stage
The Optimize Stage
Going to the Optimize stage marks an important shift of focus. The focus shifts from marketing tactics to acquire traffic to focusing on how to optimize the experience and how to achieve your objectives.
The first step in optimizing is to change one-size-fits-all messaging to messaging tailored to unique customer segments, their needs, motivations, and objectives. Personalization is key to this. It enables you to create better and more targeted conversations. As we cover in this chapter, personalization comes in many flavors. In the Optimize stage, your focus will be on quick wins using the easier methods of personalization.
The next important step in optimizing is to focus on digital goals that are key to achieving your strategic objectives. Creating better experiences through personalization is not only a win for the customers, but also for your organization as more engaged customers convert more digital goals. You will also use testing, beginning with A/B testing to optimize conversions. In both personalization and testing Engagement Value will be used to measure which marketing efforts produce the best customer experience and outcomes.
A third area of optimizing is using Engagement Value combined with a marketing taxonomy to optimize marketing initiatives and spend.
Optimizing is a fun journey; it's halfway between one-size-fits-all messaging and the automated personalized messaging. It's the stage where opportunities and gold mines open, all from a few new marketing processes. When optimizing begins to produce its results you will see a new appreciation for the impact marketing can have on strategic objectives.
Objectives of the Optimize Stage
The main objectives of the Optimize stage are:
- Optimize your digital presence to get higher engagement by focusing on the customer first and creating relevant experiences in the different channels used. Use personalization and testing to help learn what is most effective and relevant for the different customers.
- Optimize marketing initiatives by measuring marketing performance across channels.
- Key performance indicators (KPIs) are tied with strategic objectives and measured toward specific marketing objectives.
Case Story: QT Mutual Bank
How does a bank with a track record for innovation vie for new customers and greater share of wallets in a highly competitive consumer banking market? The answer for QT Mutual Bank (QTMB) was to combine web-based gamification with social media, email, mobile, and data-driven marketing. This helped the bank to create connected customer experiences and achieve a 60 percent increase in quarterly sales growth.
Australia-based QT Mutual Bank offers savings accounts, home loans, credit cards, and financial planning services. With its origins as the Queensland Teachers Credit Union, the bank has a reputation for using technology to magnify its personal banking service. One example is the fact that QTMB was the first financial institution in Australia to install a network of 24-hour ATMs in 1977. In 2011, QTMB became one of Australia's first mutual banks.
Facing an increasingly competitive atmosphere, QTMB looked for innovative ways to serve the community while attracting new customers. With a product range that puts it squarely in competition with a number of other banks, a key objective was to enable QTMB to engage its customers in as personal a conversation as they'd have in a branch—whether they're interacting with QTMB's main website, mobile site, or through social media.
The innovative approach that QTMB and its digital agency developed is a campaign called “Staffroom for Improvement.” It is an annual campaign that awards a cash prize to a deserving school. The prize is used to refurbish the teachers' staff room of the winning school. The campaign was active for three weeks and open to anyone who registered. A gamification concept encouraged people to return, vote daily, and share with their friends. Participants used apples as virtual “apples for the teacher” that functioned as votes.
Participants were allowed to vote once per day but different techniques were used to generate repeated daily voting. For example, a participant's giving power could be boosted by participating in “happy hours.” Participants could also reach higher levels—from Apple Noob to Apple Ninja to Apple Wizard—that would give them increased giving power. A variety of data-driven personalization techniques were used to visually inform logged-in participants about their current giving power.
The Staffroom for Improvement campaign was promoted in QTMB branches, on QTMB.com.au, on the bank's Facebook page, and with a television ad. QTMB's marketers emailed the bank's 70,000 member customers and people who had voted in the previous contest. Visitors where directed to a registration site where a personalized experience helped create context. Results for the campaign were impressive:
- 60 percent increase in quarterly sales growth
- 40,000 participants
- 37,000 survey responses
- 1.74 million apples (votes) given
- 7,000 Facebook “likes”
- 1.25 million-plus Facebook impressions
Collecting and connecting data was an important objective for the campaign. Surveys that QTMB sent out at various timed intervals asked participants about their banking needs. These surveys, supported via email-delivered calls to action, were based on personalization rules such as the recipient's date of birth or home ownership status. For example, a participant born in 1998 would receive a survey asking if they had a savings account, while a survey sent to a married person born in 1978 would inquire about mortgage and credit card needs.
The annual campaign has enabled QTMB to take steps toward forming the QTMB marketer's single view of the customer. Information collected via the different channels provided marketers at QTMB with massive amounts of data. That data was used to personalize the customer experience in the weeks and months following “Staffroom for Improvement.” For example, upon returning to the QTMB site, a contest participant who'd provided credit card product information would be greeted with a page comparing the visitor's current card to one of QTMB's three MasterCard products.
This journey for QTMB—where it has moved up the Customer Experience Maturity Model—is a demonstration of how organizations can drive successful business outcomes.
Benefits
Moving from the Align stage to the Optimize stage is a prime opportunity for many organizations. It is a chance to shift gears and change focus from pure attraction marketing to optimizing your customers' experience.
Benefits to Your Customers
We all know the feeling when the joy of making a purchase turns to dissatisfaction and frustration. Imagine you have just bought a new TV online. You receive it and when you go to look for some setup information on the site where it was purchased, you see everything but the TV. You probably ask yourself, “Why doesn't the site know that I just bought a TV through this site?” After browsing to the section with the TV, you find that now it's on sale at 10 percent below the price you paid. You still can't find the information you came for, and, to top it off, you are very frustrated at having paid more. You tried to call the number on the screen to get the discount, but end up waiting 20 minutes before being connected to a support representative who tells you he can't give you the discount. And if you want the setup information you originally came back for, then you have to go to the manufacturer's website. By that time the transient joy of buying another electronic gizmo is a distant memory that has been replaced with the strong feeling you will never purchase from this retailer again.
This type of customer interaction is exactly what the Optimize stage is designed to prevent. The Optimize stage is where the customer is at the center. The different interactions customers have with the brand, even across different channels, need to be connected and relevant.
The benefits for the customer are reducing friction and noise and creating relevant connected experiences, something most customers prefer. A survey found that 62 percent of consumers find personalized retail websites useful when shopping online.1
Benefits to Your Organization
Moving to the Optimize stage means that you have a clear alignment of strategic objectives, marketing objectives, and digital goals. As the results of optimizing begin to show, a new culture is fostered that is more data driven and focused on achieving key objectives.
Another benefit in the Optimize stage is being more efficient in how you do marketing. As you begin to measure and optimize marketing initiatives, it becomes easier to make better decisions in terms of marketing spend and using past insights to strengthen initiatives or launch new ones.
What You Need to Do
Optimizing is the process of making your marketing message more relevant to the customer's needs and context. To do this you will need to know the customer's context and customer data, and test to validate your hypothesis.
Contextualization
Contextualization is about being relevant, making the experience relevant to your customers' intent and their style and channels of communication.
An important part of contextualization is personalization. Personalization covers many tactics. Some marketers think of it as simple tactics like using the customer's name after a log-in. For other marketers it is the creation of extensive personalization using predictive algorithms. When we address personalization in this book, we group it into four categories; all four can work with both known and unknown visitors.
| Rules-based personalization | This is the simplest form of personalization and is a proven tactic to optimize conversions. This kind of personalization relies on explicit rules to change content (e.g., when the keyword is “ski holiday,” show a ski rental promotion). The downside of rules-based personalization is that if you need many rules, it quickly becomes complex and requires a lot of manual maintenance. However, for pages with up to 20 different rules this is still the easiest tactic. |
| Algorithm personalization | Here we use the power of algorithms, like fuzzy logic or Euclidean distance, to calculate which content is most relevant for visitors based on their In the Moment Behavior. Once in place, algorithm personalization is very powerful and is easy to maintain, as it's a matter of profiling content according to a selected taxonomy. Algorithms require planning to create a proper taxonomy, profiling content and mapping content to personalized spots. We typically recommend having some experience with personalization before doing this. |
| Connected personalization | Here personalization is used across different channels, like web, mobile, email, and point of sale. The power of connected personalization is its focus on understanding and connecting the customer's touch points. Typically this starts with web and email, as these are the easiest to connect. If you are using a connected platform, this will allow you to recognize a customer coming from email and continue the conversation throughout the web visit. It will also allow you to have triggers on the website where you can respond back through emails. |
| Automated personalization | This is the most advanced and powerful form of personalization. Machine learning algorithms using a single view of the customer help anticipate the needs of each individual customer. It gives you the power to reach out in the preferred channel at the right time with the right message. |
From this stage forward, your marketing will benefit by having as much customer data as possible. A focus on not only collecting, but also connecting the data, will help you to create individual, relevant customer experiences.
In the Optimize stage, you are just getting started with personalization, so rules-based personalization should be your initial focus. Rules-based personalization is simple to get started with and will give you experience in using personalization as well as optimizing outcomes. The work you did in Chapter 6 on the Digital Relevancy Map will help you identify the visitor segments and criteria you need to move forward with rules-based personalization.
If you look at customers, you can determine what is behind their intent, motivations, and preferences by looking at these four areas:
- In the Moment Behavior
- Profile data
- History
- Connections
In the Moment Behavior
For the majority of visitors through any channel, you will have little or no information. You will have to work with the information you have at the moment. There is no profile data, history, or past connections. In the Moment Behavior is the data you have when the visitor arrives and their behavior is anonymous.
Digital Fingerprint
When visitors arrive at your site, they have what we call the digital fingerprint; in this fingerprint, you get access to a lot of valuable data, data that can help determine the intent of the visitor.
Let's look at some of the data you have access to that could be a predictor of intent.
| Marketing campaigns | The campaign visitors respond to tells you something about their intent and stage in the decision journey. Each marketing campaign should have a unique identifier (campaign ID) that can be used to map visitors to the campaign they responded to. By getting the campaign ID, you can identify the intent of the visitor and align the content the visitor sees on the website to the intent of the campaign. |
| Keywords | Keywords used to be gold mines, as you could use the keywords to classify the stage of a decision journey as well as which product or service the visitor was interested in. However, with Google hiding the organic keywords, using keywords is rarely an option. If you have many visits coming from pay-per-click (PPC) advertising, you still get access to search keywords. This can be used to map visitor intent toward the decision stage and products or services. |
| Referrals | Referrals are the sites from which the visitor arrives at your site. These could be partners, social sites, search sites, forums, PR links, and so on. Many of these sites could help classify the intent of the visitor, either by mapping referral sites with demographics or by looking at the actual link. The link's wording and context can be used to tell what the visitor expects and therefore the visitor's intent. |
| Location | Location can refer to country, region, state, city, longitude, and latitude. In many cases this can help map relevant local content to visitors based on their location. |
| Device | Device gives you information about the device (desktop, mobile, tablet, etc.) used to access your digital channels. This can help you to add context for visitors—for example, presenting quick facts for mobile visitors and additional detail for desktop visitors. |
| Internet Protocol (IP) Address | Accessing IP addresses can map visitors with known ranges of IP addresses to a specific business, press reporters, competitors, and so on. These can be used to determine the origin of the visitor and, based on that, which content might be relevant for that visitor. |
On-Site Behavior
On-site behavior is what the visitor is doing on the site. Visitors are still anonymous, but through their on-site behavior, we are able to detect their intent and use that knowledge to show them relevant content. What follows is a list of what to consider for on-site behavior.
| Landing page | The page the visitors arrive at, if different from the home page, then they probably have an interest in the topic of that page. Entering at a deeper page could also imply that they are further along in their decision journey. |
| Site areas | Many sites have different areas, like Jobs, Services/Products, Thought Leadership, Cases, Training, and so on. Monitoring which areas visitors look at can help classify their intent and interest and can be the foundation for targeting. |
| Product/service areas | The specific products or services the visitor browses can be used to identify specific items of interest. |
| Internal search | Looking at which keywords are used to search the site internally will help classify the visitor's interest and intent. |
| Content type | Looking at the specific pages browsed can help identify a stage in the decision journey. You could map content in different levels between high-level content (home page, About Us, section front pages) and deeper-level content (specific products/services, specifications, price quotes). The deeper the level of content that visitors consume, the further they have progressed in their decision journey. |
Situation
The situation could be trending topics that might be top of mind for the person, but it can also include topics such as weather, and time of day. One of our clients found extremely high correlations between specific products being ordered and the dates and weather in specific cities. Using dates and weather, the client could almost exactly predict the volume of visitors from a region.
Profile Data
Profile data is what you already know about the visitor's profile. This can be based on explicit and implicit data.
Profile data can be collected from many sources. Explicit data can be collected from a customer filling in a form with personal information and later be connected to profile data from social networks. The combination enriches the profile with demographic and psychographic data.
Personal Information
Very specific data like name, address, phone, email, company, and so on is typically collected on a form or when somebody opens an account.
Demographics
Gender, age, status, job role, and so on are typically collected through a mix of data coming from forms or provided by connected social networks.
Psychographics
Interests, activities, values, lifestyle, attitudes, and so on can be collected through social networks and on-site behavior. An example could be classifying whether somebody is methodical or spontaneous as part of researching a product or service. This could influence the type of call to action used, something that would be very relevant for the profile.
Preferences
Preferences are more explicit and are based on what we know of the profiles (e.g., which areas the visitors prefer, which content they are looking at, whether they prefer blue over red).
History
History includes all past transactions such as which products or services visitors have bought in the past and their historical activity in the different touch points, like call centers and point of sale. Or if you are a municipality, it could be history of transactions in terms of self-service on the site.
Connections
How is the person connected? You can map the different connections visitors have on social networks. Use this to determine if they are influencers or connectors.
Connect Your Data
The more connected data we have about a visitor or customer, the better and more relevant we can create their experience. If you look at the Customer Life Cycle, you should be able to identify which data are accessed at different stages, as shown in Figure 8.2.

Figure 8.2 Customer Life Cycle with Data Points
In many cases people move through the life cycle in three stages: from unknown to known, from known to customer, and from customer to advocate (see Figure 8.3).

Figure 8.3 Progression from Unknown to Advocate
User Scenarios
Once we understand which data we have available, we can look at how visitors and customers use it. Our goal is to get them interested, have them invest more time, and build trust and commitment.
Personalization is key to making the connection between the visitor's intent and the relevant content. The danger with personalization is that it can easily create very complex scenarios with too many alternative branches. To avoid this we advocate getting started with a few quick wins. Later in this chapter are descriptions of different types of personalization used as quick wins.
The Sitecore® Interest Relevancy Model, shown in Figure 8.4, maps content relevancy (y-axis) with visitor interest (x-axis); the more relevant, the greater the value (the circle's size shows the value).

Figure 8.4 Sitecore® Interest Relevancy Model
The model has four quadrants, which can be interpreted like this:
| Low Interest, High Relevancy |
| Here relevant content is used to grab the attention of the visitor. Even though this can be in the early stages of the decision journey and interest in your offerings are low, you want to reduce bounces and engage the visitor to learn more about your offerings. At this stage most visitors would be unknown and the first important digital goal would be to get simple data, like an email from the visitor. |
| High Interest, High Relevancy |
| This is the area of greatest opportunity, as the visitor is engaged and you are able to provide relevant content. You need to leverage this, and at this point you could ask for more commitment, such as more data, or demonstration of advocacy by sharing content with peers. |
| Low Interest, Low Relevancy |
| The value from this quadrant is very low, and most likely there will be many visitors bouncing as you are not able to get their attention. At this point it's very hard to get any commitments in terms of the digital objectives. Focus should be to find and segment those who fall into this quadrant and then use personalization to make their experience more relevant. |
| High Interest, Low Relevancy |
| Visitors in this quadrant have high interest, but the site isn't relevant to their interest. This is frustrating for them, as they are interested but don't find what they want. If you have many visits in this quadrant, your top focus should be using personalization, as this will be a quick win and potentially move them to a higher quadrant. You should also survey users to find why the content or context is not relevant. |
Moving from Unknown to Known
Here you are focusing on getting visitors to give information about themselves, most likely personal information, as this will be important in order to recognize them in different channels and send personalized messages. Early stages will limit the amount of information they are ready to give, whereas deeper stages will mean they are more willing to risk giving more information. In both cases, if they feel that what they get in return for providing information is valuable, then they will give you the information.
You can use the Sitecore Interest Relevancy Model (Figure 8.4) to move visitors from unknown to known. For example, assume you are working with an anonymous visitor. You need to look at what data you can get from In the Moment Behavior and use that to contextualize the visitor's experience. Using the Sitecore Interest Relevancy Model, the visitor interest might be low, so the first task is to increase relevancy for the biggest segment of visitors. Once you have found two or three visitor segments that need to be moved in the model, then you can apply personalization to increase their value. You can nurture these same segments to increase their commitment and get more data. You can use this data to personalize more and create a virtuous cycle that builds and builds.
Nissan in Australia began this journey in 2013. The automaker used its website as a key touch point for many potential customers looking to buy a new car. Nissan identified different groups of buyers and their behavior. A key marketing objective was to make the experience more relevant and engage visitors to learn more about the different Nissan car models. Using the intent of visitors, learned from their keyword searches, accessed with In the Moment Behavior, Nissan focused on identifying visitors as early as possible and used that to show relevant content based on the specific models that the visitor searched for. Throughout the visit and subsequent visits, the visitor saw more relevant content about those specific models.
Figure 8.5 shows the default website.

Figure 8.5 Nissan's Default Website
If the visitor enters through a marketing campaign, in this case searching for Nissan Patrol and clicking on the PPC advertising, the home page changes so it's relevant, as shown in Figure 8.6.

Figure 8.6 Nissan's Website with Personalization
Doing this personalization based on the visitor's intent increased the on-site engagement, increased on-site car configurations, and increased the request to test drive Nissan cars.
Moving from Known to Customer
When moving from known to customer, personalization becomes easier. In this situation you already have some information about the visitor—it might just be an email address. The focus is to be relevant and nurture the visitor along the decision journey until you win that person as a customer.
Unless you are working with e-commerce, the financial conversion of a customer might not happen digitally. The most important objectives could be to continue to get more customer data that can be used to increase relevance and finally convert a sale through the appropriate channel.
In the Moment Behavior and profile data provide insights that can be combined to make the experience more relevant. As you get access to more data, you can use more channels to communicate; for example, an email address will enable you to send relevant email based on the information from In the Moment Behavior.
Monarch Airlines, a leading scheduled leisure airline based in the United Kingdom, strives to be a customer-centric brand, providing superior service at an affordable price. The purpose of its site is to make finding the perfect flight as easily as possible while delivering a great user experience.
Prior to the new customer-focused site, the old site provided a reasonable user experience but didn't push any boundaries in terms of content—it was very much a one-offer-suits-all experience.
With its new site, Monarch has the ability to use various levels of knowledge it has of its individual customers, whether based on the previous site activity of a returning visitor or the digital fingerprint of a new site user, to provide relevancy in what it is showing to them. Through this, Monarch focused on optimizing sales conversions as well as increasing revenue from seat and ancillary sales.
To engage the visitor through a more relevant experience, Monarch has used personalization that includes these insights into visitor intent:
- Flight search
- Booking activity (both incomplete and complete bookings)
- Geolocation
- Keyword search referrer
- Flight search categories
By displaying on the home page near real-time flight prices relevant to personalized promotions, Monarch has increased sales conversions by 5 percent, compared to a 2 percent target.
Moving from Customer to Advocate
Creating customer advocates is an area that many organizations neglect. We need to care for our customers and make sure that they get the most value from using our products and services. We want to create Lifetime Customers. Doing that will increase the number of vocal customers who share their experience with peers. We want our customers to become advocates for us.
There are two main objectives to focus on. The first one is bringing new customers on board while providing them with the best experience. Second, they should be encouraged to share their experience.
An example of this is Auckland Airport. Handling 10 million passengers a year, Auckland Airport's web presence is seen as a critical funnel for engaging airport customers and educating them about the best use of their time and shopping opportunities.
Focusing on educating customers before coming to the airport, Auckland Airport selected parking and getting customers to the most relevant retail stores as its objectives. With recommended in-terminal time reduced by 30 minutes due to increased effectiveness in security, there was less time for passengers to shop in retail stores at the airport. One of the most important objectives was to make the travelers' trips easier and give them more time to shop. This was accomplished by sending visitors information that gave them more time to shop. Visitors booking parking received information relevant to them about their flights and could initiate a series of automated relevant follow-up reminders before coming to the airport. With these messages, Auckland Airport also used the information about the customer to promote relevant retail offers.
Not only did the customer receive better and more relevant messages, but the outcome for Auckland Airport was also significant, with an 84 percent increase in redeemed personalized retail offers compared to nonpersonalized offers.
On its site, Auckland Airport also used In the Moment Behavior to promote relevant messages about the airport as well as retail offers. This has given invaluable insights into product/brand popularity and leads to a 400 percent increase in traffic to its retail partners. Their bounce rate was reduced by 13 percent.
To work with contextualization, we recommend starting with filling out the Sitecore Digital Relevancy Map described in Chapter 6, which will help map key segments with stages in the decision journey or Customer Life Cycle. The Digital Relevancy Map is critical to informing which content and calls to action are most needed for each visitor segment at each stage in the journey.
As seen in Figure 8.7, personalized content begins with data from In the Moment Behavior and progresses to a combination of In the Moment Behavior, Profile Data, and History. Connections can be used either to build trust or to get commitment to share on social networks.

Figure 8.7 Prioritized Levels of Personalization
To help map and prioritize personalization triggers for use with content, we have created the Sitecore® Content Strategy Map (see Figure 8.8), which can be used after filling out the Digital Relevancy Map. It maps spots that should be personalized on the most important pages with specific triggers and content.
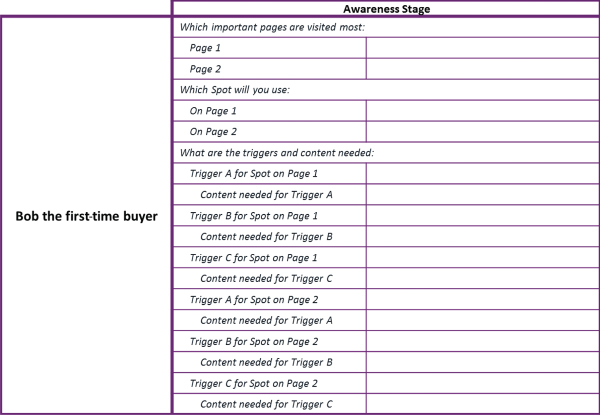
Figure 8.8 Simplified View of the Sitecore® Content Strategy Map
The Sitecore® Content Strategy Map can be downloaded at the book's companion website www.ConnectTheExperience.com/SCSM.
Testing to Optimize the Experience
For too many years, decisions on which content should be used on different pages, included in email, and highlighted on the home page have been left to chance, to stakeholder opinion, or, even worse, to the sway of shifting politics. Unfortunately, this often results in very poor experiences, where the visitor needs to digest home pages with 40 different calls to action.
Testing doesn't leave things to chance. You can start testing different sets of content and calls to action to learn what works best for your visitors and which have the greatest impact on your objectives.
Improving conversion rates through testing is a well-proven method and is something every organization should do. Testing is easy and can be seen as a low-hanging fruit opportunity to get more conversions. If you don't test, you don't know if your new design, content, video, call to action, or whatever is relevant enough for your visitors to engage with. If you test, you will know exactly which variation on your marketing effort is most relevant for your visitors. When testing is done by organizations, it's typically limited in scope due to budgets and complexity. Testing needs to be a core of the daily operation and accessible for the entire marketing team instead of limited to small specialist groups.
There are two types of tests that can be used: an A/B split test or a multivariate (MV) test.
A/B Split Test
An A/B split test is a simple test of one element tested against a variation. Elements can be anything from the design of the site to a title, video, picture, or the text on a label within a page.
Multivariate Test
A multivariate (MV) test is a test of several elements with several variations. For example, on a website with landing pages that foster low engagement, multivariate testing allows elements such as headline, picture, and call to action message to be tested against each other to see which combination results in the highest engagement.
Establish a Marketing Taxonomy
As part of the Optimize stage, you should also optimize marketing performance across different channels, both online and offline. Establishing a Marketing Taxonomy will help you identify which channels earn the highest Engagement Value. (Engagement Value is described in Chapter 7, Stage 3—Align.)
A marketing taxonomy identifies channels and subchannels. This same taxonomy code can be used to identify revenue or expenses attributable to a channel and subchannel. Through the use of the taxonomy the channel, revenue, and expenses can be brought together for analysis.
The following table shows part of an online marketing taxonomy. If you have multinational or regional marketing, then you may want to have another level that specifies the country or region.
| Taxonomy Code | Channel | Subchannel |
| PPC Advertising | ||
| 41.10.01 | PPC advertising | Bing search |
| 41.10.02 | PPC advertising | Google search |
| 41.10.03 | PPC advertising | LinkedIn search |
| 41.10.04 | PPC advertising | YouTube search |
| 41.10.99 | PPC advertising | Other search |
| Display Advertising | ||
| 41.11.01 | Display advertising | |
| 41.11.02 | Display advertising | |
| 41.11.99 | Display advertising | Other display |
| Social | ||
| 41.20.01 | Social | |
| 41.20.02 | Social | |
| 41.20.03 | Social | YouTube |
| 41.20.04 | Social | |
| 41.20.05 | Social | Slideshare |
| 41.20.06 | Social | |
| 41.20.99 | Social | Other |
| Email Marketing | ||
| 41.30.01 | Email marketing | Nurture |
| 41.30.02 | Email marketing | Purchased list |
| 41.30.03 | Email marketing | Customer mailing |
| 41.30.04 | Email marketing | Partner mailing |
| 41.30.99 | Email marketing | Other |
Every marketing campaign will have its own taxonomy code that identifies the campaign's channel and subchannel. For example, a PPC campaign through Google could have a code of 41.10.02 (41 being online, 10 being PPC advertising, and 02 being Google search).
Experience Analytics can use these taxonomy codes associated with each campaign to segment or group marketing efforts and see the Engagement Value or Value per Visit for those channels or campaigns (see Figure 8.9). In Figures 8.9 and 8.10 the taxonomy code appears as a prefix to the channel name.
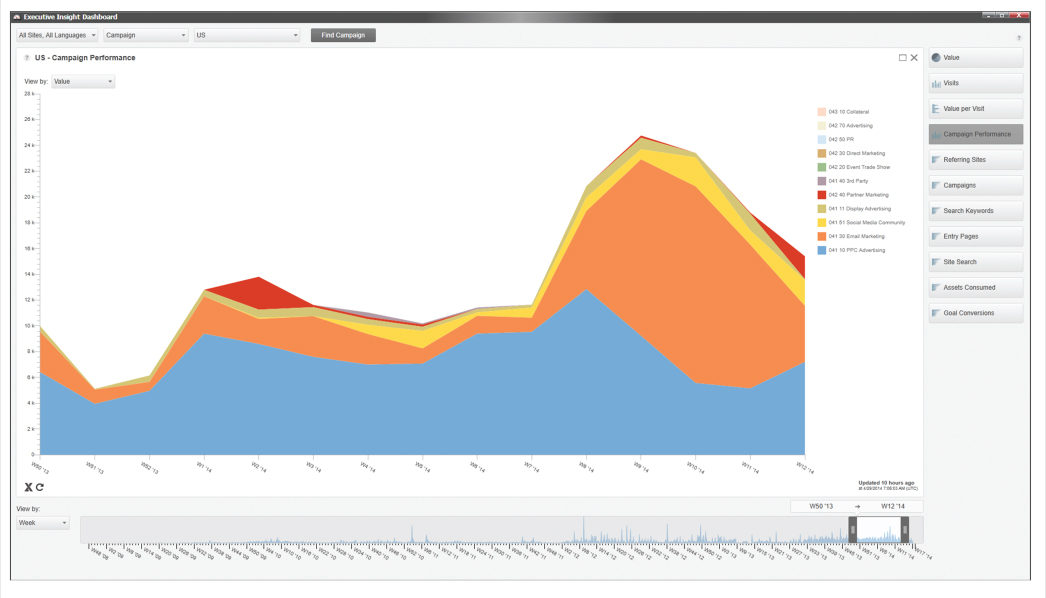
Figure 8.9 Marketing Taxonomy Identifies Channels Being Analyzed

Figure 8.10 Looking at Social Channel Effectiveness
By segmenting on a specific channel, you get insights about subchannels. In the example shown in Figure 8.10, social has been selected and the subchannels show the value from Twitter, Facebook, and LinkedIn as well as the value per campaign launched for either of those.
Using a marketing taxonomy makes it easy to compare value and efficiency between channels, even social channels as shown in Figure 8.10.
Using a marketing taxonomy helps get an overview and also allows comparison of performance between channels. Once you have that, you can optimize your cross-channel marketing.
Extend Customer Experiences with New Owned Channels
Another way to optimize the customer experience is to offer customers ways to gain product or service information, while simultaneously engaging with other customers. These customer communities increase the sharing of best practices, knowledge, and increases advocacy.
Collect Data by Applying Content Profiles
Content profiles are similar to taxonomies, but with them you are better able to understand the behavior of each visitor according to the content that visitor consumes.
Think of content profiles as a way for you to identify what visitors are interested in by watching where they go and what they do. Content profiles go beyond the limitation of tags. Content profiles use real-time information from the content consumed by the visitor to create a pattern of information about that visitor. These real-time content profiles can be used to determine the intent and interests of the visitor.
With content profiles, you have the opportunity to create profiles that describe the content on your sites. As visitors move through the website, you can keep track of which content they have touched. When you create the content profiles that describe your content, you must consider what information you want to capture about the visitors.
For example, if you need information about which persona the visitor matches and which services visitors are most interested in, then you will want to create content profiles for personas and services.
If you are a B2B organization with four primary personas, with five different service areas targeting four different industries, then your website's content profile taxonomy could look like this:
Persona Content Profile
- Brad the Business Director
- Dennis the Decision Maker
- Ida the Influencer
- Oliver the Operational
Service Content Profile
- On-site professional services
- Security solutions
- Outsource solutions
- Risk management solutions
- Portfolio solutions
Industry Content Profile
- Manufacturing
- Service
- Government
- Health care
With the content profile taxonomy created, you can apply the profiles to the different content items. A website page or asset can have a combination of different profiles. For example, a page with an industry slant might be 50 percent manufacturing and 50 percent service.
Another example could be applying a downloadable asset titled “Case Study: How We Use Risk Management in Health Care.” This asset would have high values in risk management and health care. The personas it was written for could be Dennis the Decision Maker and Ida the Influencer. The content profiles might look like Figures 8.11, 8.12, and 8.13.

Figure 8.11 Persona Content Profile

Figure 8.12 Service Content Profile

Figure 8.13 Industry Content Profile
As a visitor to the website downloads this document, the content profiles from this asset are added to the visitor's historical data. Over time the visitor builds a collection of all the content profiles that person has consumed. The resulting aggregation of data for each visitor gives a clear picture of each visitor's position toward persona, service, and industry.
Based on how the visitor consumes content and using the content profile, we can better understand the visitor. As part of the next stage, Nurture, we also use this insight to apply more advanced personalization, algorithm personalization.
Breaking Barriers
In the Optimize stage, organizations can begin to meet the limits of the systems they are currently using. In this stage the better your connected view of the customer is, the better you can personalize the experience by using data from different marketing systems, social media, email, and so on. This is where you need to begin planning and developing a customer data hub that will give you a single view of the customer.
If your marketing direction has been driven by gut-level artistic feelings, internecine ego-driven opinions, or just random acts of marketing, then you need to get ready to face a major culture change in your marketing organization. The marketing organizations that win now and in the future are data driven. Art and experience are still critical as creative drivers, but it is constant testing that proves what works best. (Imagine the joy of being able to have meetings that aren't hijacked by unfounded opinion. You'll be able to test an idea and prove what works. Just test it and move on.) For a foundation on how to change the culture in your marketing organization, see Chapter 5, Making It Happen!
Moving to a Higher Level of Marketing
While going into the Optimize stage focuses on the low-hanging fruit of optimization, not knowing what to optimize will paralyze you. You need the right approach to enter this stage and succeed. The approach we advocate is to leverage quick wins to build momentum.
The Quick Win Approach
A quick win is a focused effort that builds better experiences in areas where a small change can have a high impact. Using rules-based personalization to increase relevance and A/B testing to improve conversion are excellent tactics for quick wins.
Based on the outcomes, quick wins can be used as business cases to advocate for more initiatives in the Optimize stage—for example, more uses of personalization and testing.
People, Process, and Technology
In the Optimize stage, you can either use external consultants that are experienced in data-driven optimization or use change agents that understand data and the principles of optimization.
People
We do recommend looking for resources that fully understand the nature of data-driven optimization. You may already have a digital analyst that can provide the insights and recommendations for optimization; otherwise it might be time to start looking for additional resources with a strong background in digital analytics and optimization.
Process
To get started with the quick wins, you first need alignment between strategic and marketing objectives. With this you will know what you are optimizing to achieve. Second, you need to complete the Sitecore Digital Relevancy Map. It will help you understand the intent and motives of your different customer groups. Third, analytics will help you find areas for optimization. To execute these improvements, use the Sitecore Content Strategy Map, described earlier in this chapter, to apply optimization.
Technology
To have fully developed customer profiles requires connected data that bring together a single view of the customer, online and offline. This is a key part of the higher levels in the Customer Experience Maturity Model and is described in following chapters.
How Long Will It Take?
Coming from the Align stage, the time to get to Optimize depends on the resources you have available and how connected your technology is. Assuming your data are actionable and available, then focusing on the quick wins could be a matter of weeks for executing and a few more weeks for proving the effects.
The more focused you and your organization are on testing and failing faster, the more agile your approach will be to launching and benefiting from optimization initiatives.
How Do You Know You Are There?
You know you are in the Optimize stage when discussion about the customer experience has changed from gut feelings to data-driven. People who have been change agents in the shift to data-driven marketing will start sharing results from optimization. Discussions will focus on phrases like “increases in conversions by using personalization” or “optimizing campaigns with A/B testing.” Data-driven marketers will have an important role in influencing which type of content is needed.
All this will lead to different business units using optimization to increase outcomes toward strategic objectives. In return this will foster top management focusing on what marketing can deliver and how marketers play an important part in the strategy. Marketing will move away from “Can we publish this on our site?” to “What is the impact on this objective?” and “How will that affect lead generation?”
It's important to show wins as soon as possible. When doubters see the results of new efforts, they will become believers.