![]()
Candlestick Charts with D3
In this short but nonetheless important chapter, you will look at candlestick charts. This type of chart is based on a particular data format (OHLC, or open-high-low-close). Thus, you will need to implement a parser to read OHLC data from an external file. Moreover, another nontrivial aspect that you need to solve is how to deal with date and time data.
Although this sounds complex, in this chapter you will discover how the D3 library provides you with tools which make things easy and immediate for you.
You will first begin with building a simple OHLC chart, in order to focus particularly on the reading of the OHLC data. Then you will look in detail at how D3 handles date and time data, and finally you will represent the OHLC chart using only scalar vector graphics (SVG) elements such as lines.
In the last part, you will convert your OHLC chart in a more complete candlestick chart by means of only a few modifications.
Because of the capability of D3 to build new graphical structures from small graphical components, you can also create candlestick charts such as those generated with jqPlot. You have already seen that a candlestick chart requires a well-defined data structure: a timeline of data which consists of a date and the four OHLC values. You copy the data from Listing 6-1 into a file and save it as data_08.csv.
Listing 6-1. data_08.csv
date,open,min,max,close,
08/08/2012,1.238485,1.2327,1.240245,1.2372,
08/09/2012,1.23721,1.22671,1.23873,1.229295,
08/10/2012,1.2293,1.22417,1.23168,1.228975,
08/12/2012,1.229075,1.22747,1.22921,1.22747,
08/13/2012,1.227505,1.22608,1.23737,1.23262,
08/14/2012,1.23262,1.23167,1.238555,1.232385,
08/15/2012,1.232385,1.22641,1.234355,1.228865,
08/16/2012,1.22887,1.225625,1.237305,1.23573,
08/17/2012,1.23574,1.22891,1.23824,1.2333,
08/19/2012,1.23522,1.23291,1.235275,1.23323,
08/20/2012,1.233215,1.22954,1.236885,1.2351,
08/21/2012,1.23513,1.23465,1.248785,1.247655,
08/22/2012,1.247655,1.24315,1.254415,1.25338,
08/23/2012,1.25339,1.252465,1.258965,1.255995,
08/24/2012,1.255995,1.248175,1.256665,1.2512,
08/26/2012,1.25133,1.25042,1.252415,1.25054,
08/27/2012,1.25058,1.249025,1.25356,1.25012,
08/28/2012,1.250115,1.24656,1.257695,1.2571,
08/29/2012,1.25709,1.251895,1.25736,1.253065,
08/30/2012,1.253075,1.248785,1.25639,1.25097,
08/31/2012,1.25096,1.249375,1.263785,1.25795,
09/02/2012,1.257195,1.256845,1.258705,1.257355,
09/03/2012,1.25734,1.25604,1.261095,1.258635,
09/04/2012,1.25865,1.25264,1.262795,1.25339,
09/05/2012,1.2534,1.250195,1.26245,1.26005,
09/06/2012,1.26006,1.256165,1.26513,1.26309,
09/07/2012,1.26309,1.262655,1.281765,1.281625,
09/09/2012,1.28096,1.27915,1.281295,1.279565,
09/10/2012,1.27957,1.27552,1.28036,1.27617,
09/11/2012,1.27617,1.2759,1.28712,1.28515,
09/12/2012,1.28516,1.281625,1.29368,1.290235,
In what by now has become almost a habit, you begin by writing the code which is common to almost all charts and does not require further explanations (see Listing 6-2).
Listing 6-2. Ch6_01.html
<!DOCTYPE html>
<html>
<head>
<meta charset="utf-8">
<script src="http://d3js.org/d3.v3.js"></script>
<style>
body {
    font: 16px sans-serif;
}
</style>
</head>
<body>
<script type="text/javascript">
var margin = {top: 70, right: 20, bottom: 30, left: 40},
    w = 500 - margin.left - margin.right,
    h = 400 - margin.top - margin.bottom;

var svg = d3.select("body").append("svg")
    .attr("width", w + margin.left + margin.right)
    .attr("height", h + margin.top + margin.bottom)
    .append("g")
    .attr("transform", "translate(" +margin.left+ ", " +margin.top+ ")");

var title = d3.select("svg").append("g")
    .attr("transform", "translate(" +margin.left+ ", " +margin.top+ ")")
    .attr("class", "title");

title.append("text")
     .attr("x", (w / 2))
     .attr("y", -30 )
     .attr("text-anchor", "middle")
     .style("font-size", "22px")
     .text("My candlestick chart");
</script>
</body>
</html>
Since in the first column of the file there are values of date type, you need to define a parser to set their format (see Listing 6-3).
Listing 6-3. Ch6_01.html
...
    w = 500 - margin.left - margin.right,
    h = 400 - margin.top - margin.bottom;

var parseDate = d3.time.format("%m/%d/%Y").parse;
...
A candlestick chart is a type of data representation which is generally temporal, i.e., the four OHLC data are related to a single time unit and their variations over time are visible along the x axis. You will therefore have an x axis on which you will have to handle time values, whereas on the y axis you will assign a linear scale. In defining the x axis, you make sure that the dates are reported showing only day and month, which will be indicated by the first three initial characters (see Listing 6-4).
Listing 6-4. Ch6_01.html
var parseDate = d3.time.format("%m/%d/%Y").parse;

var x = d3.time.scale()
    .range([0, w]);

var y = d3.scale.linear()
    .range([h, 0]);

var xAxis = d3.svg.axis()
    .scale(x)
    .orient("bottom")
    .tickFormat(d3.time.format("%d-%b"))
    .ticks(5);

var yAxis = d3.svg.axis()
    .scale(y)
    .orient("left");

...
Now observing what is inside the data file (Listing 6-1), you can see five columns of data, of which the last four are numbers. The first column contains dates which must be submitted to the parser, while the other four are to be interpreted as numeric values. Moreover, you need to figure out which are the maximum and minimum values among all of the OHLC data. Manage all these aspects within the iterative function forEach() as shown in Listing 6-5.
Listing 6-5. Ch6_01.html
...
var svg = d3.select("body").append("svg")
    .attr("width", w + margin.left + margin.right)
    .attr("height", h + margin.top + margin.bottom)
    .append("g")
    .attr("transform", "translate(" +margin.left+ ", " +margin.top+ ")");

d3.csv("data_08.csv", function(error, data) {
    var maxVal = -1000;
    var minVal = 1000;
    data.forEach(function(d) {
      d.date = parseDate(d.date);
      d.open = +d.open;
      d.close = +d.close;
      d.max = +d.max;
      d.min = +d.min;
      if (d.max > maxVal)
          maxVal = d.max;
      if (d.min < minVal)
          minVal = d.min;
    });
});
...
Next, in Listing 6-6, you create the domains of x and y. While on the x axis, the domain will handle dates, the y domain will have an extension which will cover all the values between the minimum and maximum values that have just been found (minVal and maxVal).
Listing 6-6. Ch6_01.html
d3.csv("data_08.csv", function(error, data) {

      data.forEach(function(d) {
    ...
    });

    x.domain(d3.extent(data, function(d) { return d.date; }));
    y.domain([minVal,maxVal]);
});
Once the domains are well defined you can draw the two axes x and y with the SVG elements along with their labels as shown in Listing 6-7.
Listing 6-7. Ch6_01.html
d3.csv("data_08.csv", function(error, data) {
    ...
    y.domain([minVal,maxVal]);

    svg.append("g")
      .attr("class", "x axis")
      .attr("transform", "translate(0, " + h + ")")
      .call(xAxis)
    svg.append("text")
      .attr("class", "label")
      .attr("x", w)
      .attr("y", -6)
      .style("text-anchor", "end");

  svg.append("g")
    .attr("class", "y axis")
    .call(yAxis);

    svg.append("text")
      .attr("class", "label")
      .attr("transform", "rotate(-90)")
      .attr("y", 6)
      .attr("dy", ".71em")
      .style("text-anchor", "end")
      .text("Dollar [$]");
});
And you use the SVG element <line> to plot the data on the OHLC chart (see Listing 6-8). The ext line is the vertical line which defines the range between the high and low values. The close and open lines are two horizontal lines corresponding to open and close values.
Listing 6-8. Ch6_01.html
d3.csv("data_08.csv", function(error, data) {
    ...
    svg.append("text")
       .attr("class", "label")
       .attr("transform", "rotate(-90)")
       .attr("y", 6)
       .attr("dy", ".71em")
       .style("text-anchor", "end")
       .text("Dollar [$]")
    svg.selectAll("line.ext")
      .data(data)
      .enter().append("svg:line")
      .attr("class", "ext")
      .attr("x1", function(d) { return x(d.date)})
      .attr("x2", function(d) { return x(d.date)})
      .attr("y1", function(d) { return y(d.min);})
      .attr("y2", function(d) { return y(d.max); });

    svg.selectAll("line.close")
      .data(data)
      .enter().append("svg:line")
      .attr("class", "close")
      .attr("x1", function(d) { return x(d.date)+5})
      .attr("x2", function(d) { return x(d.date)-1})
      .attr("y1", function(d) { return y(d.close);})
      .attr("y2", function(d) { return y(d.close); });

    svg.selectAll("line.open")
      .data(data)
      .enter().append("svg:line")
      .attr("class", "open")
      .attr("x1", function(d) { return x(d.date)+1})
      .attr("x2", function(d) { return x(d.date)-5})
      .attr("y1", function(d) { return y(d.open);})
      .attr("y2", function(d) { return y(d.open); });
});
Thanks to the way in which you have defined the classes of the newly generated elements, you can define attributes to the CSS styles for all of the three lines together, by using the line class, or defining them individually using the line.open, line.close, and line.ext classes (see Listing 6-9).
Listing 6-9. Ch6_01.html
<style>
body {
    font: 16px sans-serif;
}
.axis path,
.axis line {
    fill: none;
    stroke: #000;
    shape-rendering: crispEdges;
}
line.open, line.close, line.ext {
    stroke: blue;
    stroke-width: 2;
    shape-rendering: crispEdges;
}
</style>
At the end, you get the candlestick chart shown in Figure 6-1.
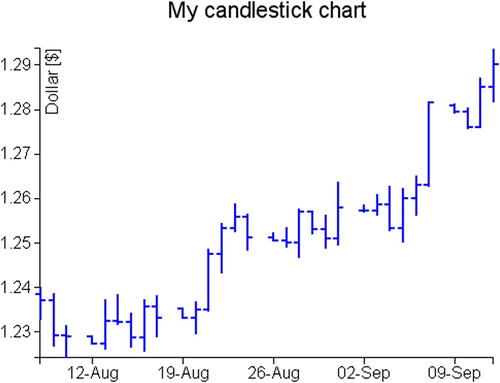
Figure 6-1. An OHLC chart
Date Format
Having to deal with this class of charts which makes use of OHLC data, you will always deal with time and date values along the x axis. Therefore taking a cue from this observation, analyze how the D3 library handles this type of data.
What would have happened if in the previous example you did not have the dates of the days and months zero-padded, or the year was reported with only two digits (e.g., “8/9/12”)? Inside the d3.csv() function, D3 would not have been able to read dates with this format, and consequently, the candlestick chart would not have appeared. Actually, what you need to do is very simple, i.e., guess the correct sequence of formatters to insert in the parser. By formatter, we mean a set of characters with the “%” sign before, which according to the specific (case-sensitive) character expresses a unit of time written in a certain way.
var parseDate = d3.time.format("%m/%e/%y").parse;
Even dates expressed literally can be handled in the same way. You have already seen this format of dates:
08-Aug-12,1.238485,1.2327,1.240245,1.2372,
It can be handled with this parser:
var parseDate = d3.time.format("%d-%b-%y").parse;
But there are much more complex cases, such as the following:
Monday 16 April 2012,1.238485,1.2327,1.240245,1.2372,
And it can be handled with this parser:
var parseDate = d3.time.format("%A %e %B %Y").parse;
All separation characters (including spaces) between the different values should be reported in the same position in the parser. Thus, if the dates are defined in this way...
'8 Aug-12',1.238485,1.2327,1.240245,1.2372,
You have to insert both the space and the quotes in the string defining the parser or the date would not be recognized.
var parseDate = d3.time.format("'%d %b-%y'").parse;
You must also keep in mind that the only separation character which can not be added in a csv file is “ , ”. If you must insert it, you have to use a TSV (tab-separated values) file.
Table 6-1 includes all the available formatters. Their combination should cover any input size.
Table 6-1. D3 Date and Time Formatters
|
Formatter |
Description |
|---|---|
|
%a |
Abbreviated weekday name |
|
%A |
Full weekday name |
|
%b |
Abbreviated month name |
|
%B |
Full month name |
|
%c |
Date and time, as “%a %b %e %H:%M:%S %Y” |
|
%d |
Zero-padded day of the month as a decimal number [01,31] |
|
%e |
Space-padded day of the month as a decimal number [ 1,31] |
|
%H |
Hour (24-hour clock) as a decimal number [00,23] |
|
%I |
Hour (12-hour clock) as a decimal number [01,12] |
|
%j |
Day of the year as a decimal number [001,366] |
|
%m |
Month as a decimal number [01,12] |
|
%M |
Minute as a decimal number [00,59] |
|
%p |
Either am or pm |
|
%S |
Second as a decimal number [00,61] |
|
%U |
Week number of the year (Sunday as the first day of the week) as a decimal number [00,53] |
|
%w |
Weekday as a decimal number [0(Sunday),6] |
|
%W |
Week number of the year (Monday as the first day of the week) as a decimal number [00,53] |
|
%x |
Date, as “%m/%d/%y” |
|
%X |
Time, as “%H:%M:%S” |
|
%y |
Year without century as a decimal number [00,99] |
|
%Y |
Year with century as a decimal number |
|
%Z |
Time zone offset, such as “–0700” |
|
%% |
A literal “%” character |
Box Representation in Candlestick Charts
With jqPlot, you also saw other ways to display OHLC data. For example, often such data are represented by a vertical line and a vertical box covering it for a certain length. The vertical line is the same representation as the previous candlestick, it lies between the high and low value of the OHLC. Instead, the box represents the range between the open and close values. Moreover, if the open value is greater than the close value, the box will be of a given color, but if the opposite happens, of another color.
You use the same data contained in the data_08.csv file, and starting from the code in the previous example, you will look at the changes to be made.
Replace the ext, open, and close lines with these three new lines: ext, ext1, and ext2 (see Listing 6-10). Then you have to add the rectangle representing the box. The lines should be black, whereas the boxes should be red when the open values are greater than close values, or else, in the opposite case, the boxes will be green.
Listing 6-10. Ch6_02.html
svg.selectAll("line.ext")
   .data(data)
   .enter().append("svg:line")
   .attr("class", "ext")
   .attr("x1", function(d) { return x(d.date)})
   .attr("x2", function(d) { return x(d.date)})
   .attr("y1", function(d) { return y(d.min);})
   .attr("y2", function(d) { return y(d.max);});

svg.selectAll("line.ext1")
  .data(data)
  .enter().append("svg:line")
  .attr("class", "ext")
  .attr("x1", function(d) { return x(d.date)+3})
  .attr("x2", function(d) { return x(d.date)-3})
  .attr("y1", function(d) { return y(d.min);})
  .attr("y2", function(d) { return y(d.min); });

svg.selectAll("line.ext2")
  .data(data)
  .enter().append("svg:line")
  .attr("class", "ext")
  .attr("x1", function(d) { return x(d.date)+3})
  .attr("x2", function(d) { return x(d.date)-3})
  .attr("y1", function(d) { return y(d.max);})
  .attr("y2", function(d) { return y(d.max); });

svg.selectAll("rect")
  .data(data)
  .enter().append("svg:rect")
  .attr("x", function(d) { return x(d.date)-3; })
  .attr("y", function(d) { return y(Math.max(d.open, d.close));})
  .attr("height", function(d) {
  return y(Math.min(d.open, d.close))-y(Math.max(d.open, d.close));})
  .attr("width", 6)
  .attr("fill", function(d) {
  return d.open > d.close ? "darkred" : "darkgreen" ;});
});
The last thing is to set the CSS style classes in Listing 6-11.
Listing 6-11. Ch6_02.html
<style>
body {
    font: 16px sans-serif;
}
.axis path,
.axis line {
    fill: none;
    stroke: #000;
    shape-rendering: crispEdges;
}
line.ext, line.ext1, line.ext2 {
    stroke: #000;
    stroke-width: 1;
    shape-rendering: crispEdges;
}
</style>
And the chart in Figure 6-2 is the result.
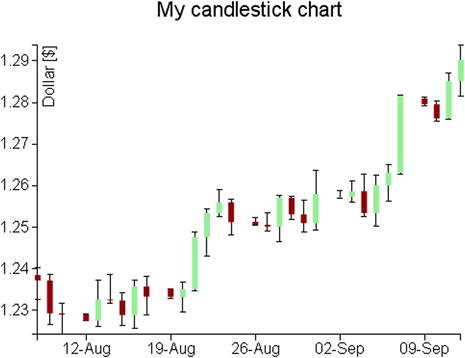
Figure 6-2. A candlestick chart
Summary
In this chapter, you have seen the types of candlestick chart already discussed in the first part of the book dedicated to the jqPlot library, but this time you used D3. You have seen how you can easily get similar results while keeping full control over every single graphic element. In addition, since this kind of chart uses time data, here you have delved deeper into how the D3 library manages this type of data and the various ways to manage format.
Continuing to follow the parallelism between the jqPlot library and the D3 library regarding the implementation of the various types of chart, in the next chapter you will learn about scatter plots and bubble charts and how to implement them with the D3 library.