
![]()
JSON and Layouts—Handling Structured Data
Once you have dealt with all the graphical aspects of a chart, it is time to analyze input data in more detail. In the previous chapters, you started assigning the values of input data to arrays. Then you made use of tabulated data contained within CSV or TSV files. This step has allowed you to be able to handle most of the data for the visualization, but in reality there are more complex data structures, in a hierarchical form, such as trees.
In actuality, it is often necessary to interface with other technologies in order to obtain such data, and to do so you need to find a way that is well suited to any source of data. The need to use a common text format that can be easily handled by different scripting languages (especially JavaScript) and that remains comprehensible to humans, led to the use of the JavaScript Object Notation (JSON) format. You have briefly read about this kind of format in Chapter 1, but now you’ll see how to use it concretely to handle input data from external sources.
This chapter studies in detail the JSON format. First of all, you will learn how there can be structured data in the JSON format, by analyzing some syntax diagrams. Then you will move on to practical examples.
The JSON Format
JSON (JavaScript Object Notation) is a data exchange format (see http://json.org for more details). Thanks to its tree structure, in which each element is referred as a name-value pair, it is easy for humans to read and write it and for machines to parse and generate it. This is the main reason for its increasingly prevalent use.
The JSON structure is built on the combination of two different structures: arrays and objects (see Figure 12-1). Within them you can define all of the classic primitive values commonly used, even in other languages: numbers, Booleans, strings, and null value. This allows values contained in it to be exchanged between various programming languages. (At www.json.org, you can find a list of all languages that handle the JSON format, along with a list of all the related technologies, such as libraries, modules, plug-ins, and so on.)
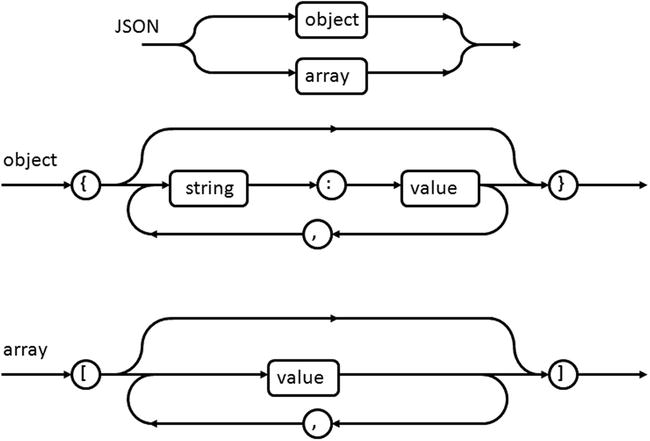
Figure 12-1. Syntax diagrams for JSON
Just to understand the syntax diagrams in Figure 12-1 better, you can analyze how a JSON format is structured. You must take into account two things. The first is that both the objects and the arrays contain a series of values identified by the value labels in the diagrams. value refers to any type of value, such as a string, a number, or a Boolean, and it can even be an object or an array.
In addition to this, you can easily guess that the JSON structure is a tree structure with different levels. The tree will have as nodes either arrays or objects; the leaves are the values contained in them.
Consider some examples. If you have a JSON structure with only one level, you will have only two possibilities:
- An array of values
- An object with values
If you extend the structure to two levels, the possibilities are four (assuming for simplicity that the tree is symmetrical):
- An array of arrays
- An array of objects
- An object with arrays
- An object with objects
And so on; the cases gradually become more complex. In this way you can generate all the possible data structures, such as trees (see Figure 12-2).
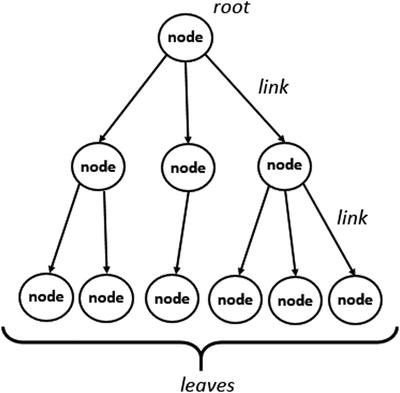
Figure 12-2. A tree data structure
Now, according to the directions on the JSON format described above, write the tree structure shown in Figure 12-2, then save the file as tree.json. As you can see in Listing 12-1, by alternating objects and arrays it is possible to describe any data structure, also much more complex.
Listing 12-1. Tree.json
{
  "name": "root",
  "children": [
    {
     "name": "parent A",
     "children": [
       {"name": "child A1"},
       {"name": "child A2"}
     ]
    },{
     "name": "parent B",
     "children": [
       {"name": "child B1"}
     ]
    },{
     "name": "parent C",
     "children": [
       {"name": "child C1"},
       {"name": "child C2"},
       {"name": "child C3"}     ]
    }
  ]
}
JSON IS NOT A JAVASCRIPT OBJECT LITERAL
This is a point that is good to discuss in more detail, because it is easy to get confused between JSON and JavaScript Object Literal.
When you have two different systems, probably making use of different programming languages and they need to communicate, they will use strings to exchange data. The data described in the strings, will follow a format, which in your case is JSON.
Even if the JSON string has the same format of a JavaScript structured object, it is only a string.
Instead, once the JSON file is interpreted by d3.json() function, it will be considered an actual structured Object, with data stored in variables, arrays, and objects, in the way JavaScript handles these instances.
The D3 Layouts
The library provides D3 modules, called layouts, which help the developer to structure to handle complex data. In addition, the D3 layouts, thanks to their internal implementations, present themselves as very useful tools in the management of the calculation of the coordinates of the elements that go to make up the chart then. In fact once loaded, the data structure in a layout, such as a tree, the layout will calculate the x and y coordinates for each node that will occupy in the drawing area.
Precisely because of the large number of possible data structures, the D3 library provides a set of built-in layouts. In particular, for the handling of hierarchical data structures, the D3 library provides the following layouts:
- partition
- tree
- cluster
- pack
- treemap
Starting with a Simple Tree
As a first example, you implement an HTML page that will display a tree. The data for the hierarchical structure are precisely those contained in the file tree.json (see Listing 12-1). So far you’ve seen how easy it is to read the data in a CSV or TSV file thanks to the d3.csv() and d3.tsv() functions. In a similar way, the library D3 provides a function called d3.json().
d3.json("path/to/file.json", function(error, root){
   ...
});
Among the various D3 layouts available specifically for hierarchical data structures, d3.layout.tree is the most suitable to the example chosen. As a point of reference, I chose a complex dendrogram representation, M. Bostock’s example #4063570 (http://bl.ocks.org/mbostock/4063570).
Listing 12-2. Ch12-1.html
<HTML>
<HEAD>
<meta charset="utf-8">
<script src="http://d3js.org/d3.v3.js"></script>
<STYLE>
.node circle {
    fill: #fff;
    stroke: steelblue;
    stroke-width: 1.5px;
}
.node {
    font: 20px sans-serif;
}
.link {
    fill: none;
    stroke: #ccc;
    stroke-width: 1.5px;
}
</STYLE>
</HEAD>
<body>
<script>
var width = 600;
var height = 500;
var tree = d3.layout.tree()
     .size([height, width-200]);
var diagonal = d3.svg.diagonal()
     .projection (function(d) {return [d.y, d.x];});
var svg = d3.select("body").append("svg")
     .attr("width",width)
     .attr("height",height)
     .append("g")
     .attr("transform", "translate(100, 0)");
d3.json("tree.json", function(error, root){
     var nodes = tree.nodes(root);
     var links = tree.links(nodes);
     var link = svg.selectAll(".link")
       .data(links)
       .enter().append("path")
       .attr("class", "link")
       .attr("d", diagonal);
     var node = svg.selectAll(".node")
       .data(nodes)
       .enter().append("g")
       .attr("class", "node")
       .attr("transform", function(d) { return "translate(" + d.y + ", " + d.x + ")"; });
     node.append("circle")
       .attr("r", 4.5);
     node.append("text")
      .attr("dx", function(d) { return d.children ? -8 : 8; })
      .attr("dy", 3)
      .style("text-anchor", function(d) { return d.children ? "end" : "start"; })
      .text( function(d){return d.name;});
});
</script>
</BODY>
</HTML>
In this way you get a tree (see Figure 12-3), which is very similar to the tree represented in Figure 12-2.

Figure 12-3. A tree dynamically generated from a JSON file
Analysis of the Tree Layout
If you look in detail at the tree in Figure 12-3, this is nothing more than the dynamic representation of the hierarchical structure described in JSON format in the file tree.js. The code you implemented in this example is capable of representing any tree structure, regardless of the number of levels, nodes, and leaves present.
One such efficient data management JSON and their correct visualization is due in large part to the role played by the D3 layout. In this example you used the d3.layout.tree. Now you will see in detail how it works and how it manipulates data internally read from JSON file.
By analyzing the code shown in Listing 12-2, you can see the declaration of the layout. The next step is to declare the size of the drawing area with the size() function (see Listing 12-3). This step is very important because one of the main purposes of the layout is to automatically calculate all the x and y coordinates of all the nodes of the tree. Then the x and y values calculated depend exclusively on two parameters passed to the size() function.
Listing 12-3. Ch12-1.html
var tree = d3.layout.tree()
    .size([height, width-200]);
The data read from the JSON file is stored in the root variable. Then, it is loaded into the layout through the nodes() function (see Listing 12-4). This operation generates an array containing all the nodes that make up the tree, which you’re going to store in the variable nodes. The next operation will be to generate an array links containing all the links connecting the nodes of the tree. You can create this using the links() function.
Listing 12-4. Ch12-1.html
d3.json("tree.json", function(error, root){
     var nodes = tree.nodes(root);
     var links = tree.links(nodes);
...
});
Taking a look at the contents of the two arrays just created, you can discover a series of nested data structures much more complex than what was described in the JSON file. The tree consists of 10 nodes and 9 links, as many objects are contained in two arrays nodes and links (see Figure 12-4). In addition you will also notice that each node is accompanied by two new fields, x and y, which are precisely the coordinates computed from the layout.
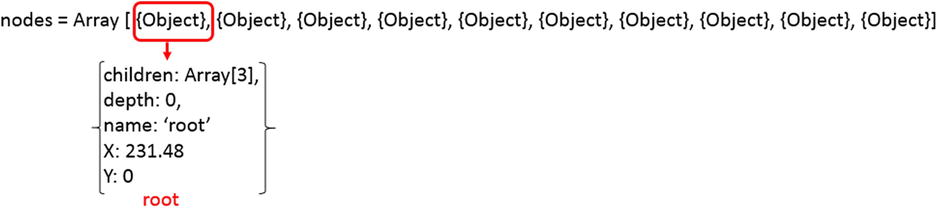
Figure 12-5 clearly shows how the x and y coordinates within the nodes of the layout match the drawing area that will be represented on the tree.
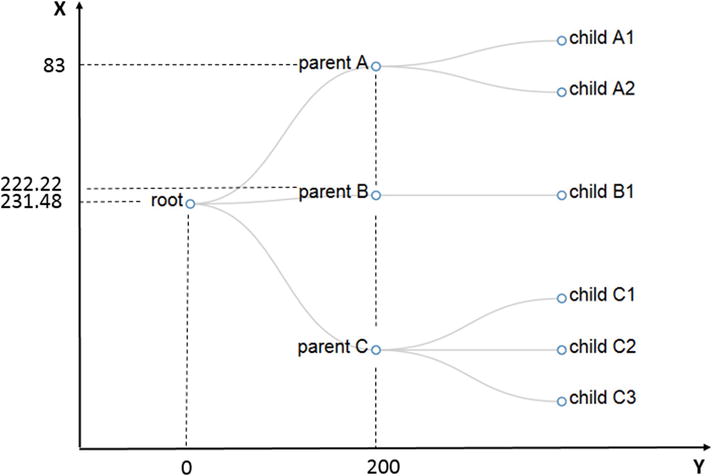
Figure 12-5. The d3.layout.tree automatically calculates the coordinates for each node depending on the size of the drawing area
Circular Tree Representation
The tree structure that you have seen in the previous example was a simple structure, gradually that the number of nodes and levels is growing the structure becomes increasingly complex. At this level, a general practice is to represent the tree in a circular shape.
First, increase the complexity of the tree, writing a new structure in JSON format (see Listing 12-5), then save it as tree2.json.
Listing 12-5. tree2.json
{
 "name": "root",
 "children": [
 {
     "name": "parent A",
     "children": [
       {"name": "child A1"},
       {"name": "child A2"},
       {"name": "child A3"},
       {"name": "child A4"},
       {"name": "child A5"},
       {"name": "child A6"}
     ]
 },{
     "name": "parent B",
     "children": [
       {"name": "child B1"},
       {"name": "child B2"},
       {"name": "child B3"},
       {"name": "child B4"},
       {"name": "child B5"},
       {"name": "child B6"},
       {"name": "child B7"},
       {"name": "child B8"}
     ]
 },{
    "name": "parent C",
    "children": [
       {"name": "child C1"},
       {"name": "child C2"},
       {"name": "child C3"},
       {"name": "child C4"}
     ]
  }]
}
Now type the code from the HTML page for the representation of circular trees (see Listing 12-6).
Listing 12-6. ch12-2.html
<HEAD>
<meta charset="utf-8">
<script src="http://d3js.org/d3.v3.js"></script>
<style type="text/css">
.node circle {
  fill: #fff;
  stroke: steelblue;
  stroke-width: 1.5px;
}
.node {
  font: 20px sans-serif;
}
.link {
  fill: none;
  stroke: #ccc;
  stroke-width: 1.5px;
}
</style>
</HEAD>
<body>
<script>
var radius = 350;
var margin = 120;
var angle = 360;
var tree = d3.layout.tree()
 .size([angle, radius-margin]);

var diagonal = d3.svg.diagonal.radial()
 .projection (function(d) {return [d.y, d.x / 180* Math.PI];});

var svg = d3.select("body").append("svg")
 .attr("width", 2*radius)
 .attr("height", 2*radius)
 .append("g")
 .attr("transform", "translate("+radius + ", " + radius + ")");

d3.json("tree2.json", function(error, root){
 var nodes = tree.nodes(root);
 var links = tree.links(nodes);
 var link = svg.selectAll(".link")
 .data(links)
 .enter().append("path")
 .attr("class", "link")
 .attr("d", diagonal);

 var node = svg.selectAll(".node")
 .data(nodes)
 .enter().append("g")
 .attr("class", "node")
 .attr("transform", function(d) { return "rotate(" + (d.x - 90) + ")translate(" + d.y + ")"; });

 node.append("circle")
 .attr("r", 4.5);

 node.append("text")
 .attr("dy", ".31em")
 .attr("text-anchor", function(d) { return d.x > 180 ? "start" : "end"; })
 .attr("transform", function(d) { return d.x > 180 ? "translate(8)" : "rotate(180)translate(-8)"; })
 .text(function(d) { return d.name; });
});
</script>
</body>
</HTML>
Figure 12-6 shows the circular representation of a tree read from a JSON file.
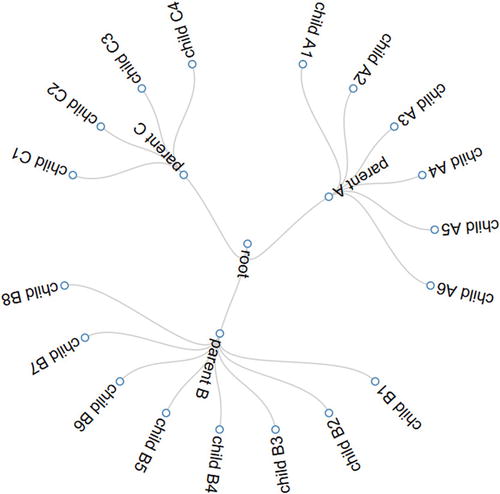
Figure 12-6. The circular representation of a tree
In the previous example you saw the circular representation of a tree. In this section you will see an alternative representation, much like the donuts chart (see Chapter 5, Figure 5-10). (see Figure 12-7). In general it will produce adjacency diagrams such as a space-filling variant of a node-link tree diagram. Rather than drawing a link between parent and child in the hierarchy, nodes are drawn as solid areas (either arcs or rectangles), and their placement relative to other nodes reveals their position in the hierarchy.
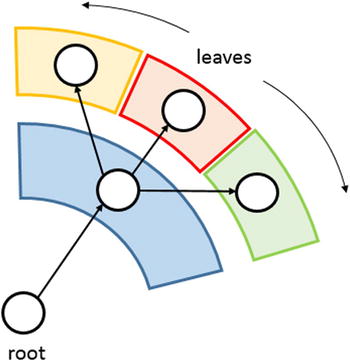
Figure 12-7. An alternative circular representation of a tree
So in this representation, the nodes are represented by circular sectors and links are implicitly described radially. The information on the hierarchy of a typical tree structure is preserved. But there is something more. The nodes represented in the form of circular sectors allows us to add a more information to our graph: we can represent as each leaf weights compared to the other. Indeed, we have the possibility of representing this quantity with the angle of extension of the circular sector.
Also in this case the library D3 provides us with the hierarchical layout suitable for this purpose: the d3.layout.partition. In the previous examples you saw that d3.layout.tree automatically calculated the x and y coordinates for each node. Well, the same way the d3.layout.partition calculates the angles of extension of each circular sector, that is, of each node.
First, change the data structure you used in the previous example adding a size value to each leaf. This value expresses the ‘weight’ of each leaf with respect to the other (see Listing 12-7).
Listing 12-7. tree4.json
 "name": "root",
 "children": [
 {
     "name": "parent A",
     "children": [
       {"name": "child A1", "size": 25},
       {"name": "child A2", "size": 31},
       {"name": "child A3", "size": 11},
       {"name": "child A4", "size": 21},
       {"name": "child A5", "size": 44},
       {"name": "child A6", "size": 22}
     ]
 },{
     "name": "parent B",
     "children": [
       {"name": "child B1", "size": 5},
       {"name": "child B2", "size": 11},
       {"name": "child B3", "size": 35},
       {"name": "child B4", "size": 36},
       {"name": "child B5", "size": 28},
       {"name": "child B6", "size": 22},
       {"name": "child B7", "size": 26},
       {"name": "child B8", "size": 41}
     ]
 },{
    "name": "parent C",
    "children": [
       {"name": "child C1", "size": 23},
       {"name": "child C2", "size": 51},
       {"name": "child C3", "size": 33},
       {"name": "child C4", "size": 4}
     ]
  }]
}
While Listing 12-8 shows the code of the HTML page to display a circular sectors of the tree. As a point of reference, I chose a “sunburst” representation, M. Bostock’s example #4063423 (http://bl.ocks.org/mbostock/4063423).
Listing 12-8. ch12_03.html
<HTML>
<HEAD>
<meta charset="utf-8">
<script src="http://d3js.org/d3.v3.js"></script>
</HEAD>
<body>
<script>
var radius = 250;
var angle = 360;
var color = d3.scale.category10();

var svg = d3.select("body").append("svg")
    .attr("width", 2*radius)
    .attr("height", 2* radius)
    .append("g")
    .attr("transform", "translate("+radius + ", " + radius + ")");

var partition = d3.layout.partition()
    .size([2 * Math.PI, radius]);

var arc = d3.svg.arc()
    .startAngle(function(d) { return d.x; })
    .endAngle(function(d) { return d.x + d.dx; })
    .innerRadius(function(d) { return d.y; })
    .outerRadius(function(d) { return d.y + d.dy; });

d3.json("tree3.json", function(error, root) {

  var size = function(d) { return d.size; };
  var nodes = partition.value(size).nodes(root);

  var path = svg.datum(root).selectAll("path")
      .data(nodes)
      .enter().append("path")
      .attr("display", function(d) { return d.depth ? null : "none"; })
      .attr("d", arc)
      .style("stroke", "#fff")
      .style("fill", function(d) { return color((d.children ? d : d.parent).name); })
      .style("fill-rule", "evenodd");

});
</script>
</body>
</HTML>
Figure 12-8 shows the result of the code.
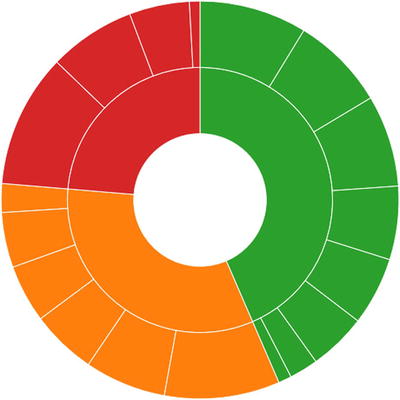
Figure 12-8. An alternative circular representation of a tree
Now let’s analyze in detail how the project works d3.layout.partition. The declaration of the partition layout is very similar to that of the tree layout (see Listing 12-9). With the two parameters passed to the size() function you can establish the extent circular as the first argument (in this case a round angle) and the radius as the second argument.
Listing 12-9. ch12_03.html
var partition = d3.layout.partition()
    .size([2 * Math.PI, radius]);
Inside the json() function, you can assign the structured data contained in the JSON file through the root variable to the partition layout. The size values of the leaves are passed through recursion to the value() function (see Listing 12-10).
Listing 12-10. ch12_03.html
d3.json("tree3.json", function(error, root) {

  var size = function(d) { return d.size; };
  var nodes = partition.value(size).nodes(root);
If you go to analyze in detail the internal structure of the partition layout you can see how it is structured in the Figure 12-9.
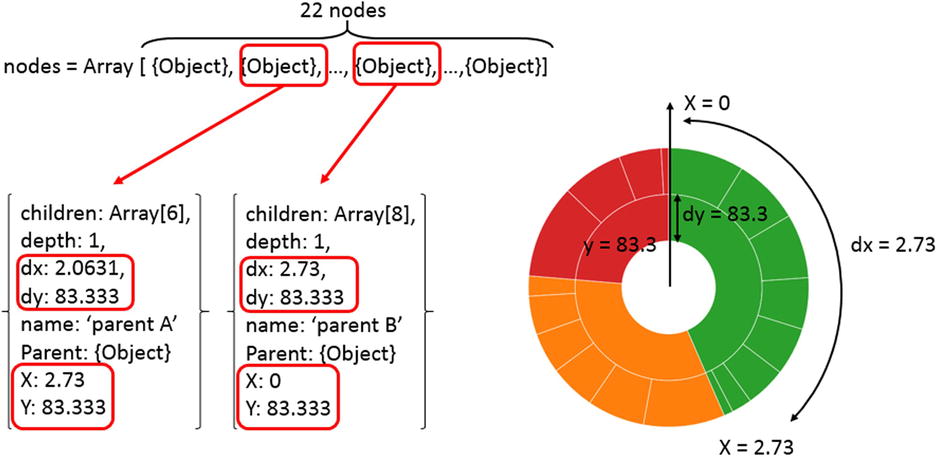
Figure 12-9. The partition layout structure in detail
Finally, the function d3.svg.arc () will convert the values x, y, dx, and dy in the circular sectors that will make up the chart in its entirety (see Listing 12-11).
Listing 12-11. ch12_03.html
var arc = d3.svg.arc()
    .startAngle(function(d) { return d.x; })
    .endAngle(function(d) { return d.x + d.dx; })
    .innerRadius(function(d) { return d.y; })
    .outerRadius(function(d) { return d.y + d.dy; });{
Endless Possibilities with JSON and Layouts
In the two previous examples you have seen first hand just the tip of the iceberg of the infinite possibilities that the library D3, integrated technology JSON for data input, can provide.
For anyone interested in further extending the topic I highly recommend going to https://github.com/mbostock/d3/wiki/Gallery. Within this page are a large number of examples developed with the library D3.
Summary
In this chapter you have seen how the D3 library can read structured data in JSON format. Moreover, you have seen the layouts and their role in the manipulation of data with complex structures such as trees.
Conclusion
With this chapter, you have come to the end of this book. Throughout the book many examples of charts were presented and discussed. At this point you should be familiar with all the most common types of charts. In addition, you should have developed a good practice in the implementation of the JavaScript code using the library D3 to create a series of SVG graphics with which to build all kinds of charts you need.
In addition, the sequence of the examples has been chosen in such a way that you could gradually learn all the concepts that underlie the D3 library (selectors, layout, domains, scales, chain methods, etc.)
I must say that despite the large number of topics covered, there are many others I would have liked to add. I hope that this book has made you better appreciate the world of data visualization and charts in particular. I also hope that the book has provided you with a good, basic knowledge of data visualization and that it proves to be a valuable aid for all the occasions in which you find yourself dealing with charts.