Appendix 1
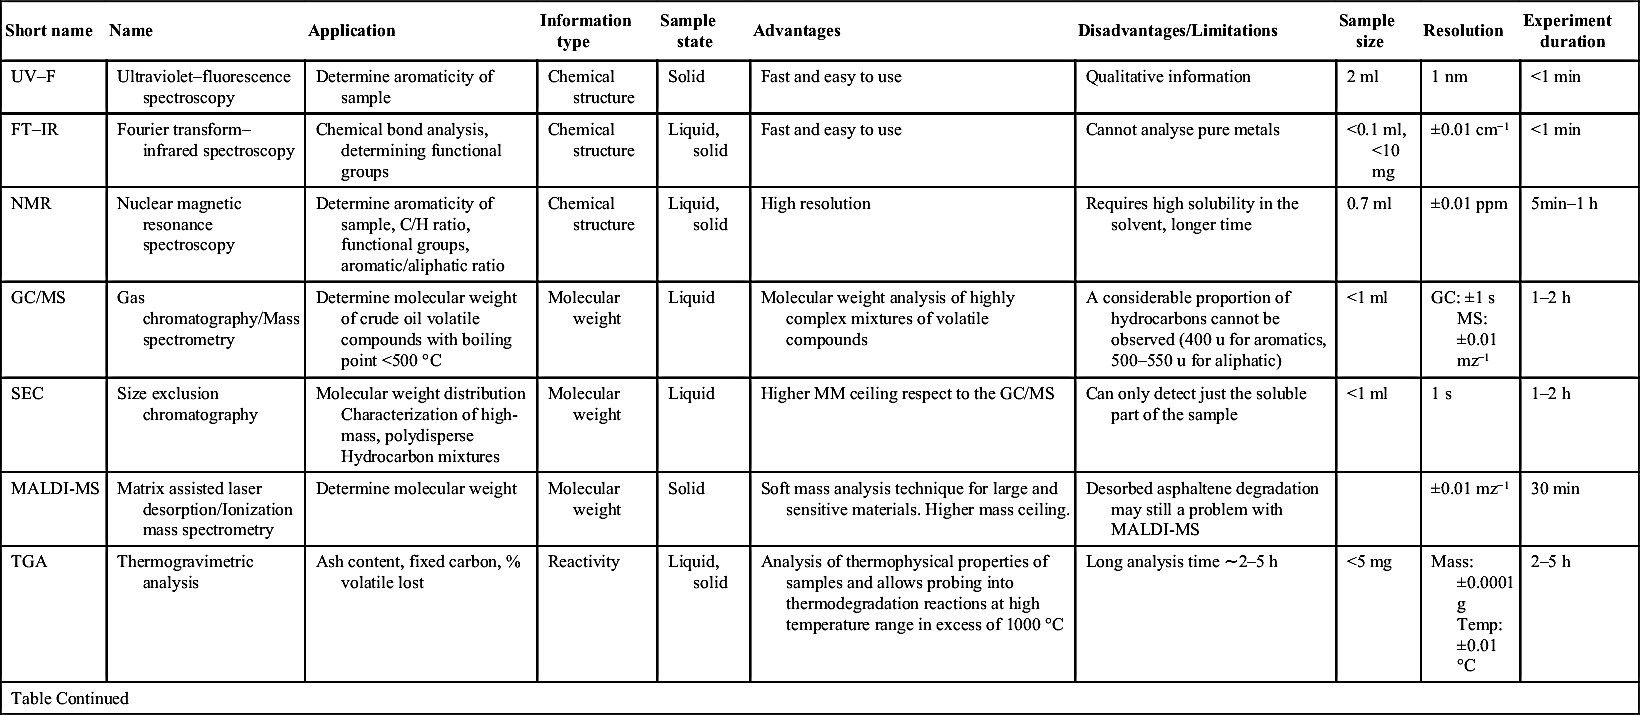
Table A.1
Summary of analytical techniques used in fouling studies
| Short name | Name | Application | Information type | Sample state | Advantages | Disadvantages/Limitations | Sample size | Resolution | Experiment duration |
| UV–F | Ultraviolet–fluorescence spectroscopy | Determine aromaticity of sample | Chemical structure | Solid | Fast and easy to use | Qualitative information | 2 ml | 1 nm | <1 min |
| FT–IR | Fourier transform–infrared spectroscopy | Chemical bond analysis, determining functional groups | Chemical structure | Liquid, solid | Fast and easy to use | Cannot analyse pure metals | <0.1 ml, <10 mg | ±0.01 cm−1 | <1 min |
| NMR | Nuclear magnetic resonance spectroscopy | Determine aromaticity of sample, C/H ratio, functional groups, aromatic/aliphatic ratio | Chemical structure | Liquid, solid | High resolution | Requires high solubility in the solvent, longer time | 0.7 ml | ±0.01 ppm | 5min–1 h |
| GC/MS | Gas chromatography/Mass spectrometry | Determine molecular weight of crude oil volatile compounds with boiling point <500 °C | Molecular weight | Liquid | Molecular weight analysis of highly complex mixtures of volatile compounds | A considerable proportion of hydrocarbons cannot be observed (400 u for aromatics, 500–550 u for aliphatic) | <1 ml | GC: ±1 s MS: ±0.01 mz−1 | 1–2 h |
| SEC | Size exclusion chromatography | Molecular weight distribution Characterization of high-mass, polydisperse Hydrocarbon mixtures | Molecular weight | Liquid | Higher MM ceiling respect to the GC/MS | Can only detect just the soluble part of the sample | <1 ml | 1 s | 1–2 h |
| MALDI-MS | Matrix assisted laser desorption/Ionization mass spectrometry | Determine molecular weight | Molecular weight | Solid | Soft mass analysis technique for large and sensitive materials. Higher mass ceiling. | Desorbed asphaltene degradation may still a problem with MALDI-MS | ±0.01 mz−1 | 30 min | |
| TGA | Thermogravimetric analysis | Ash content, fixed carbon, % volatile lost | Reactivity | Liquid, solid | Analysis of thermophysical properties of samples and allows probing into thermodegradation reactions at high temperature range in excess of 1000 °C | Long analysis time ∼2–5 h | <5 mg | Mass: ±0.0001 g Temp: ±0.01 °C | 2–5 h |
| Table Continued | |||||||||
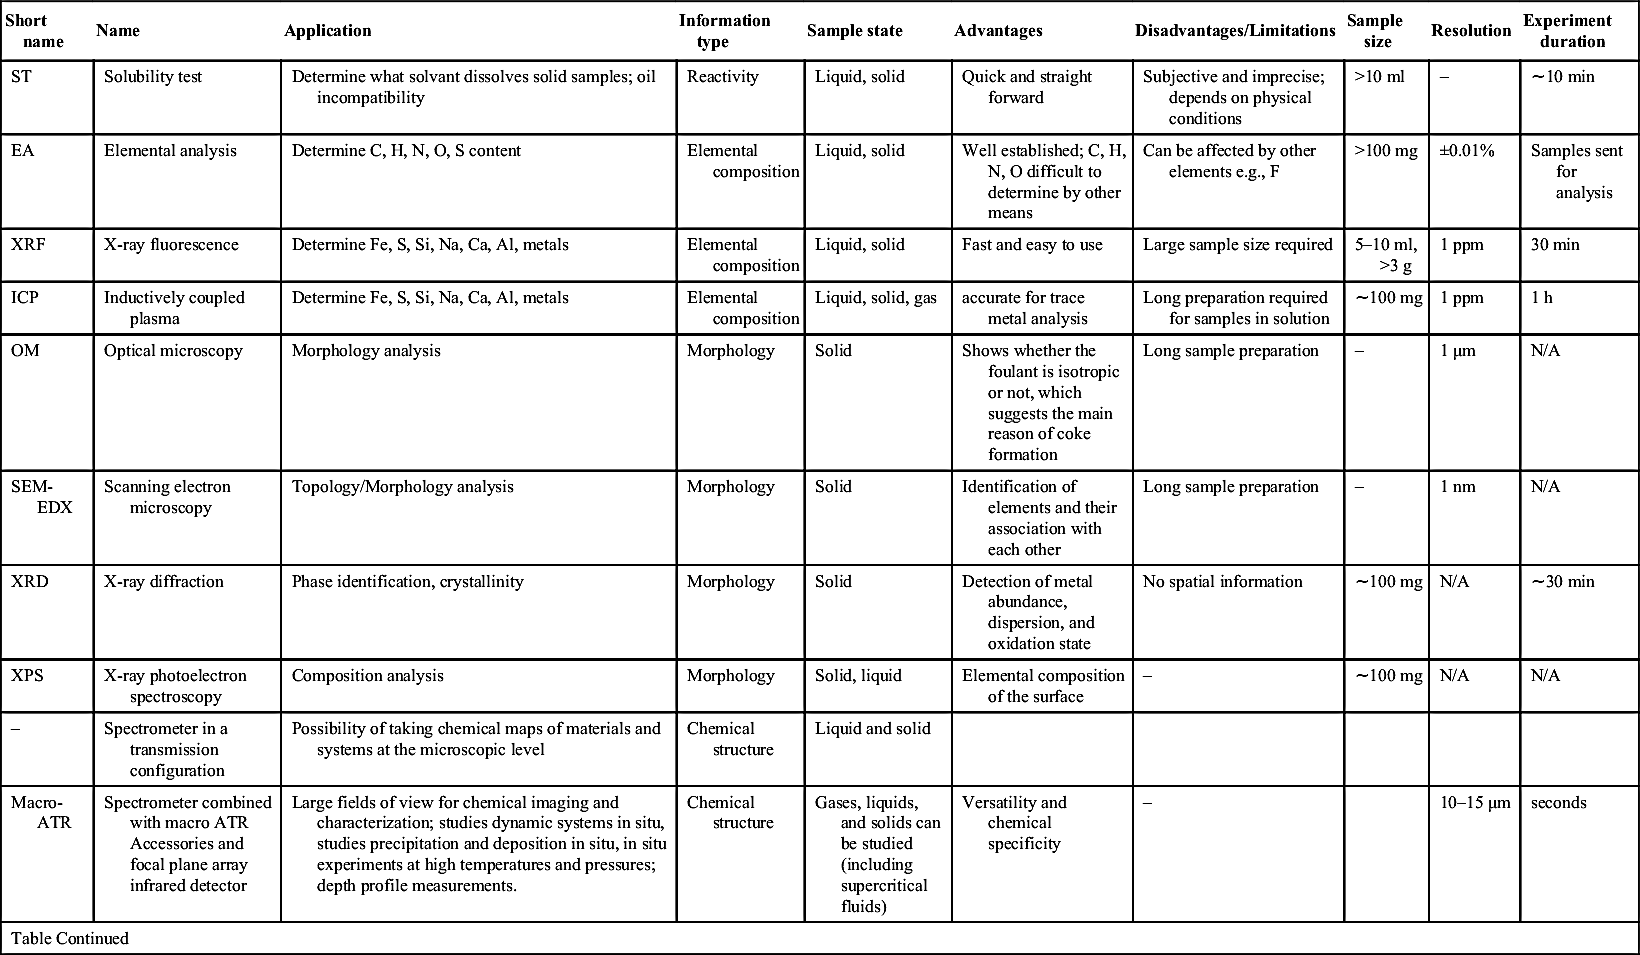
| Short name | Name | Application | Information type | Sample state | Advantages | Disadvantages/Limitations | Sample size | Resolution | Experiment duration |
| ST | Solubility test | Determine what solvant dissolves solid samples; oil incompatibility | Reactivity | Liquid, solid | Quick and straight forward | Subjective and imprecise; depends on physical conditions | >10 ml | – | ∼10 min |
| EA | Elemental analysis | Determine C, H, N, O, S content | Elemental composition | Liquid, solid | Well established; C, H, N, O difficult to determine by other means | Can be affected by other elements e.g., F | >100 mg | ±0.01% | Samples sent for analysis |
| XRF | X-ray fluorescence | Determine Fe, S, Si, Na, Ca, Al, metals | Elemental composition | Liquid, solid | Fast and easy to use | Large sample size required | 5–10 ml, >3 g | 1 ppm | 30 min |
| ICP | Inductively coupled plasma | Determine Fe, S, Si, Na, Ca, Al, metals | Elemental composition | Liquid, solid, gas | accurate for trace metal analysis | Long preparation required for samples in solution | ∼100 mg | 1 ppm | 1 h |
| OM | Optical microscopy | Morphology analysis | Morphology | Solid | Shows whether the foulant is isotropic or not, which suggests the main reason of coke formation | Long sample preparation | – | 1 μm | N/A |
| SEM-EDX | Scanning electron microscopy | Topology/Morphology analysis | Morphology | Solid | Identification of elements and their association with each other | Long sample preparation | – | 1 nm | N/A |
| XRD | X-ray diffraction | Phase identification, crystallinity | Morphology | Solid | Detection of metal abundance, dispersion, and oxidation state | No spatial information | ∼100 mg | N/A | ∼30 min |
| XPS | X-ray photoelectron spectroscopy | Composition analysis | Morphology | Solid, liquid | Elemental composition of the surface | – | ∼100 mg | N/A | N/A |
| – | Spectrometer in a transmission configuration | Possibility of taking chemical maps of materials and systems at the microscopic level | Chemical structure | Liquid and solid | |||||
| Macro-ATR | Spectrometer combined with macro ATR Accessories and focal plane array infrared detector | Large fields of view for chemical imaging and characterization; studies dynamic systems in situ, studies precipitation and deposition in situ, in situ experiments at high temperatures and pressures; depth profile measurements. | Chemical structure | Gases, liquids, and solids can be studied (including supercritical fluids) | Versatility and chemical specificity | – | 10–15 μm | seconds | |
| Table Continued | |||||||||
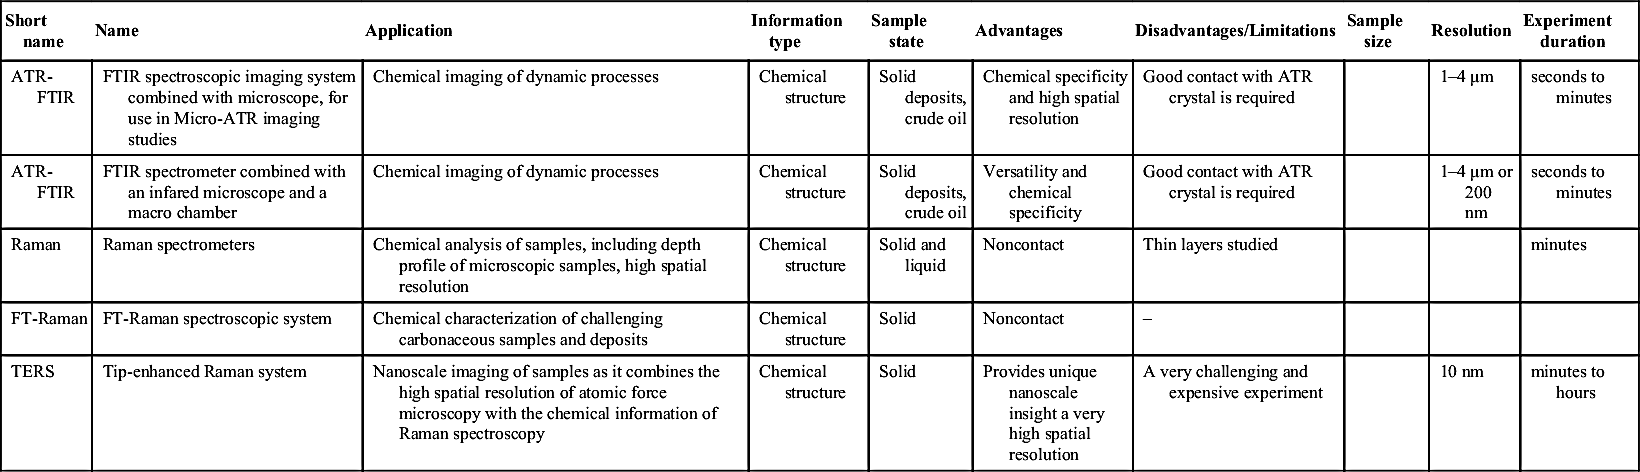
| Short name | Name | Application | Information type | Sample state | Advantages | Disadvantages/Limitations | Sample size | Resolution | Experiment duration |
| ATR-FTIR | FTIR spectroscopic imaging system combined with microscope, for use in Micro-ATR imaging studies | Chemical imaging of dynamic processes | Chemical structure | Solid deposits, crude oil | Chemical specificity and high spatial resolution | Good contact with ATR crystal is required | 1–4 μm | seconds to minutes | |
| ATR-FTIR | FTIR spectrometer combined with an infared microscope and a macro chamber | Chemical imaging of dynamic processes | Chemical structure | Solid deposits, crude oil | Versatility and chemical specificity | Good contact with ATR crystal is required | 1–4 μm or 200 nm | seconds to minutes | |
| Raman | Raman spectrometers | Chemical analysis of samples, including depth profile of microscopic samples, high spatial resolution | Chemical structure | Solid and liquid | Noncontact | Thin layers studied | minutes | ||
| FT-Raman | FT-Raman spectroscopic system | Chemical characterization of challenging carbonaceous samples and deposits | Chemical structure | Solid | Noncontact | – | |||
| TERS | Tip-enhanced Raman system | Nanoscale imaging of samples as it combines the high spatial resolution of atomic force microscopy with the chemical information of Raman spectroscopy | Chemical structure | Solid | Provides unique nanoscale insight a very high spatial resolution | A very challenging and expensive experiment | 10 nm | minutes to hours |
..................Content has been hidden....................
You can't read the all page of ebook, please click here login for view all page.