
Chapter One
Introduction
Abstract
Crude oil fouling is a long-standing problem in oil refineries that impacts operations, energy efficiency, and costs and has severe environmental and health and safety implications. Chapter 1 introduces the topic of crude oil fouling and starts with a description of fouling in a typical crude distillation unit. The chapter continues with a discussion of the impact of fouling on the operation of a crude oil distillation unit, both from an operational and economic point of view. Health and safety aspects are also discussed.
Keywords
Cost of fouling; Crude distillation unit; Crude oil fouling; Fouling economics; Fouling impact; Preheat train; RefineryStringent environmental policies and tightening refining margins in a highly competitive market are forcing oil companies worldwide to increase their focus on the efficient utilization of energy. Refinery efficiency is so critical that it has been reported to be capable of moving the share price of major oil and gas companies. In this perspective, the efficiency of heat exchange equipment and heat exchange networks is of paramount importance. Fouling, the deposition of unwanted material on heat transfer surfaces, is a major cause of inefficiencies with severe effects on refinery economics, operability, health and safety, and environmental impact.
Fouling is a long-standing problem in the process and energy industry. Taborek (1995) tracked the origin of the first industrial concern about fouling back in the 1880's USA power industry and the first mention of fouling in the open literature is in a paper by Orrok (1910). Fouling has been described both as “the major unresolved problem in heat transfer” (Taborek et al., 1972) and “a nearly universal problem in heat exchanger equipment design and operation” (Watkinson, 1988). Indeed fouling is ubiquitous in the oil industry.
In upstream operations, hydrate formation, asphaltene precipitation, and wax deposition from crude oil not only reduce the thermal efficiency of heat exchangers but also, more importantly, restrict flow, causing blockages that significantly impact operations. In some cases also oil pipelines are affected to the extent of becoming plugged. Wax deposition typically occurs when crude is cooled to a point at which the paraffins normally contained in solution start aggregating and eventually depositing on the surfaces.
In oil refineries, the feed/effluent heat exchangers in naphtha hydrotreaters, the slurry exchangers in fluid catalytic cracking units, and the furnace and exchangers in the visbreaker unit are all known to be affected by severe fouling problems. However, the largest share, about 50% (Van Nostrand et al., 1981), of the total fouling-related costs for the whole refinery originates in the preheat train (PHT) of the atmospheric distillation unit (here referred to as crude distillation unit or CDU).
The PHT is an extensive network of heat exchangers used to reduce energy requirements in the CDU, which is where primary fractionation of all the crude processed in the refinery is performed. If the PHT is not working efficiently, more fuel must be burnt at the downstream furnace that heats the crude to the required temperature for the distillation. The average energy involved with this process has been estimated to be over 192 TWh per year (6.94 × 10¹⁷ J per year) for refineries in the United States (DOE, 2006). This makes the CDU the largest energy utilizer in the refinery and one of the largest in the whole process industry. By comparison, the total primary energy consumed by Ireland in 2013 was 169 TWh.
Although there are only a few—largely outdated—studies that deal with the economic costs of fouling in oil refineries, there is little doubt that fouling has an enormous impact on the refinery’s bottom line. Van Nostrand et al. (1981) estimated that process-side fouling cost the United States refineries US$ 1.36bn per year, and US$ 861 MM of that in the crude PHT alone. Adjusting for inflation to 2014 this is equivalent to US$ 3.6bn and US$ 2.26bn, respectively.
The environmental impact is even more staggering with fouling in refineries estimated to be responsible for 88 MM t of CO2, or 2.5% of total worldwide anthropogenic emissions in 2009 (Müller-Steinhagen et al., 2009a).
How much of this inefficiency can be eliminated, and at what cost, is the key question. Fouling mitigation can provide increased capacity and reduced greenhouse gas emissions without significant capital expenditure. A study made in 2006 for the US Department of Energy (DOE) indicates that potential fuel savings up to 55% can be achieved in oil refineries by improving operating practices and capital equipment (DOE, 2006). Among the suggested improvements it was found that fouling mitigation in the PHT and fired heater in atmospheric distillation units could lead to a 15% fuel saving (1/3 from existing technology, 2/3 from technology in the R&D stage). As fuel consumption in the atmospheric furnace represents around 4% of the total refinery throughput (Yeap et al., 2004), a potential saving of 15% equates to a sizable 500,000 bbl per day potential savings worldwide, equivalent to the daily production of a large refinery, or (for oil at US$80 bbl−1) a value of US$14.6bn per year. However, much still needs to be done to tap into these savings, starting from the way heat exchangers are designed, crudes are blended, and operations are managed. To improve these aspects, it is widely recognized that a more fundamental understanding of the underlying fouling phenomena is needed.
Over the years, several projects have been coordinated to study the complex and interacting phenomena involved in different types of fouling (Pilavachi and Isdale, 1993; Pritchard, 1988a). For crude oil fouling, many experimental and theoretical studies have been produced by the University of British Columbia and the Argonne National Laboratory (Watkinson, 1988; Panchal and Watkinson, 1994; Kuru et al., 1997), the University of Bath (Crittenden et al., 1987a,b), the HTRI's Crude Oil Fouling Task Force (Bennett et al., 2006, 2009), IHS ESDU's Oil Industry Fouling Working Party (ESDU, 2000), and others. More recently, fouling research has moved from the isolated activities of an individual research group, specialized in a specific technique, to large multidisciplinary projects that coordinate the activities of multiple researchers, expert in different areas, into a multipronged attack to the fouling problem. These projects, such as the Crude Oil Fouling project (CROF) (Macchietto et al., 2009) and the UNIHEAT project (Imperial College London and Boreskov Institute of Catalysis), typically involve both experimental and modeling work examining the fouling problem across all scales, from the molecular to the process unit to the overall heat exchanger network.
Although chemical and physical phenomena underlying the fouling process are extremely complex and several details remain unknown, the overall understanding of the problem has improved significantly in the past few decades. For example, it is now known that fouling in the hot end of the PHT is originated by a series of chemical reactions triggered by the high operating temperatures. There is also experimental evidence that critical velocities exist above which fouling does not occur due to deposit removal by shear forces from the fluid flow (Ebert and Panchal, 1995). However, all this knowledge has so far not been fully exploited and translated into tangible benefits for refinery operators. It would ultimately be highly desirable to improve traditional design methodologies to find fouling-resilient arrangements that allow undisrupted operations with minimal loss of efficiency.
Traditional heat exchanger design methodologies largely rely on highly empirical, fixed, TEMA “fouling factors” (TEMA, 1941). These are basically “safety factors” that lead the designer to specify an oversized heat transfer area that, in theory, should compensate for reduced thermal efficiency caused by fouling. As will be seen in more detail in Section 5.1, several authors have highlighted how this approach ultimately turns out to exacerbate fouling rather than mitigate it. The fundamental limitations of the fouling factor approach are that it does not capture in any detail actual fouling dynamics and its strong dependence on exchanger design and process conditions. The ability to capture at the design stage the dependence of fouling on process conditions and time becomes therefore pivotal to achieve fouling-resilient designs and retrofits of heat exchangers and networks, and to better support operating decisions. Butterworth (2004), in his process heat transfer outlook for 2010, noted that:
The next major attack on fouling will be as a result of a better design process. For some key applications, such as crude-oil, preheat chain, we have equations which predict (though not very accurately) the way fouling develops and the effect of temperature and velocity on this. What we need therefore to do is to get these equations into our design software and to become skilled in using this to design for minimum fouling.
This book illustrates a multipronged attack to the crude oil fouling problem covering several scales of investigation (from micro to refinery scale), from both an experimental and a modeling approach. The focus is not only in presenting fundamental science underlying the fouling mechanisms and the most advanced technologies available for experimental characterization and mathematical modeling, but also in providing practical suggestions to refinery operators. Industrial case studies are used to show how the techniques described can be used to effectively mitigate fouling.
The present chapter of the book introduces the topic of crude oil fouling and starts with a description of fouling in typical crude distillation units. The chapter continues with a discussion of the impact of fouling on the operation of a crude oil distillation unit, from both an operational and an economic point of view. Health and safety aspects are also discussed.
Chapter 2 reviews the underlying science of the fouling process; basic fouling mechanisms are described as are the routes for chemical reaction fouling. The sequence of events occurring in fouling are discussed and the variables affecting these events are reviewed.
To understand key variables affecting fouling, it is necessary to be able to generate deposits at controlled conditions and accurately measure primary variables (i.e. temperature, pressure, etc.). Experimental work on generation of fouling deposit is described in Chapter 3. The first part of the chapter describes deposit formation on a very small scale in microbomb reactors. The second part of the chapter describes a novel experimental technique for studying fouling in which fouling layers are created in a rotating cell device under controlled conditions of temperature, heat flux, and shear stress. Finally, the chapter discusses the construction of a rig for studying fouling in large-scale geometries simulating those found in real heat exchangers.
If an attempt is to be made to understand the mechanisms behind the fouling process, it is important to determine the structure, chemistry and physical characteristics of the deposits generated in the lab or collected from industrial equipment. Chapter 4 begins with a review of industrial practice and findings in this context. The second part of Chapter 4 discusses the determination of the chemical structure and molecular weight of deposits and the third part introduces a novel (chemical imaging) technique by which the location of various chemical species in a surface layer can be established. Though the most important characteristic of a fouling layer is its thermal resistance, the thickness of the layer is also important because the restriction in channel size generated by the presence of the fouling layer can lead to increased pressure drop. The final part of Chapter 4 gives a description of a dynamic foulant thickness gauge.
The ability to model the fouling processes is clearly important if the results of the lessons from the experimental analysis are to be brought to bear on real problems. Work in Chapter 5 describes a multiscale approach to modeling of crude oil fouling focused on improving understanding from the molecular level to industrial scale systems. The molecular and small-scale modeling work allows the determination of key parameters, such as diffusion coefficients and fluid physical properties, which can be used in detailed fluid-dynamic models to predict fouling deposition in simple flows. On a large scale, advanced systems modeling has resulted in an ability to predict the future course of fouling in a heat exchanger. The last section of this chapter shows how these models can be used to accurately assess operational costs due to fouling, assisting in heat exchanger design and devising improved operating strategies that minimize costs.
The final chapter (Chapter 6) summarizes the current state of knowledge on crude oil fouling and attempts to predict how the subject will develop in the future.
1.1. Crude Distillation Units in Oil Refineries
The CDU is the first of several units the crude oil encounters in any refinery. A typical CDU (Figure 1.1) consists of a preheat train, a desalter, a preflash drum, a furnace, and an atmospheric distillation column.
A typical CDU capacity, which determines the total capacity of the refinery, ranges between 100,000 and 200,000 barrels per day (bbl per day). Large refineries that can process more than 500,000 bbl per day may have more than one crude distillation unit.
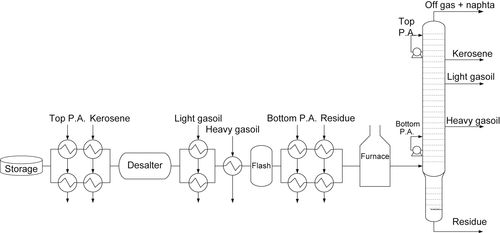
In the atmospheric distillation column, crude is fractionated into its primary products. Hot distillates (kerosene, light and heavy gasoil) are withdrawn from different sections of the column while naphtha and liquefied petroleum gases (LPG) are removed from the column head. The number of trays in the distillation column typically varies between 30 and 50 trays, depending on the degree of fractionation required and the number of side streams. The final products, characterized by their boiling ranges, are reported in Table 1.1.
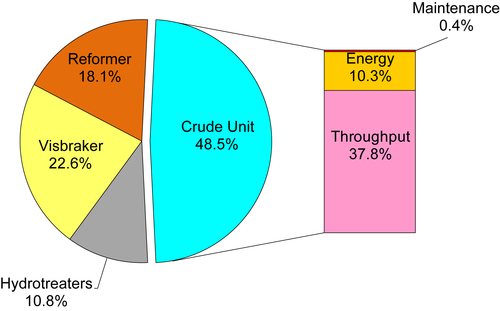
In United States refineries the average CDU's energy consumption has been estimated at 31.9 kWh (114.9 GJ) per barrel processed (DOE, 2006), roughly 98% of which is due to fuel consumption at the furnace and the remaining 2% due to electricity (including also the energy used for desalting). Although this is relatively low compared to other conversion processes downstream (Figure 1.2(a)), because it processes all incoming crude oil, with a United States average refinery consumption estimated in 190 TWh per year (6.86 × 10¹⁷J per year), the CDU is the largest energy user in the whole refinery (Figure 1.2(b)).
Table 1.1
Typical atmospheric distillation product boiling ranges, Jones (1995)
| Stream | Product name | Boiling range [°C] |
| Off gas | LPG | Up to 30 |
| Overhead distillate | Full-range naphtha | 30–190 |
| First side-stream | Kerosene | 190–250 |
| Second side-stream | Light gasoil | 250–320 |
| Third side-stream | Heavy gasoil | 320–365 |
| Residue | Fuel oil | 365–500 |
| Residue | Bitumen | >500 |
LPG, liquefied petroleum gases.
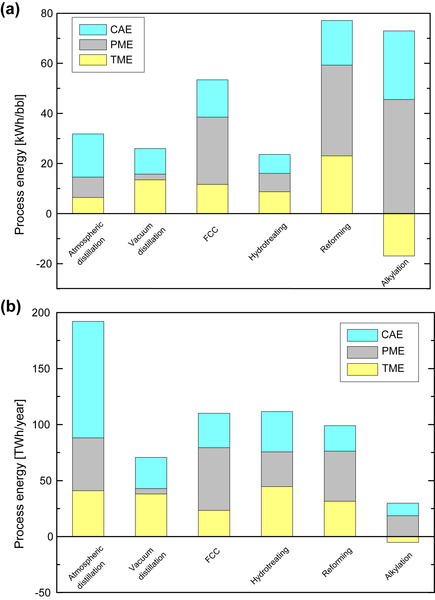
Figure 1.2 considers the theoretical minimum energy required under ideal conditions (TME), the practical minimum energy required under nonideal conditions (PME), and the current average energy consumed under actual plant conditions (CAE). The difference between PME and CAE is a measure of potential gains that may be achieved, according to the DOE (2006) study, by improving current technologies, process design, or operating practices.
Given the large quantity of energy involved, the design of crude distillation systems—and the potential saving associated—has attracted the interest of both industrial and academic communities. In late 1970s, early researchers focused on improving the distillation column design (e.g., internal geometries, use of pump arounds, etc.). When in the early 1980s the use of Pinch Technology became widespread, the focus shifted to improving heat integration. However, it was only through the mathematical methodologies and tools developed in the 1990s that researchers were finally able to design, retrofit, and optimize systematically and simultaneously both a distillation column and its associated heat exchanger network as a complex and integrated system (Liebmann and Dhole, 1995; Liebmann et al., 1998; Suphanit, 1999; Bagajewicz and Soto, 2000; Ji and Bagajewicz, 2002a,b; Basak et al., 2002; Gadalla et al., 2003, 2005).
The next sections provide a brief overview of the key elements of a typical CDU with focus on their design and operations with respect to fouling.
1.1.1. The Preheat Train
To reduce the energy requirements at the furnace, the crude oil pumped from storage is heated in a series of heat exchangers, the PHT, against overhead, product, and pump-around streams from which nearly 60–70% of the heat necessary for primary fractionation is recovered (Panchal and Huangfu, 2000). Although a few examples exist of refineries using a compact plate and frame design (Andersson et al., 2009), a typical preheat train is made up of as many as 60 shell-and-tube heat exchangers (Panchal and Huangfu, 2000) with the crude usually processed on the tube-side.
In the PHT the crude reaches the highest temperature possible for single phase flow at which it enters the furnace (coil inlet temperature or CIT). Typically CIT ranges between 240 and 270 °C, at a coil inlet pressure between 12 and 15 bar, whereas the typical coil outlet temperature (COT) is around 365 °C.
Following the changes in crude temperature, the PHT is usually divided into sections referred to as cold (upstream of the desalter), intermediate (between the desalter and the preflash), and hot (downstream of the preflash).
1.1.2. Desalter
Crude oil contains varying amounts of inorganic salts such as NaCl, CaCl2, and MgCl2 (Bai and Wang, 2007). The presence of such salts not only plays an important part in the fouling process it also increases corrosion in the heat exchangers and poisons the catalysts in processing units downstream of the CDU. Liu et al. (2003) discussed the importance of reducing the concentration of salts in the crude stream. This is typically done through a desalting process by diluting the salt content with fresh water added before entering a desalter at a temperature between 90 and 120 °C with a recommended addition rate of 3.0–4.5% of crude flow (Choi, 2005).
Different types of industrial desalters exist. In the most common desalters—which operate at a pressure around 5–10 bar and temperature in the range of 100–150 °C—the gravity settling of salt-containing water droplets is enhanced by electrostatic precipitation. The water phase is sent to a sour water stripper and disposed whereas the oil phase is redirected to the intermediate section of the PHT.
It is important to note that desalter performance is strictly interlocked with thermal efficiency of the heat exchangers. Desalters usually operate within a restricted optimum temperature range thus improved heat exchangers operation (i.e., ensuring stable temperature outlets and less downtime for cleaning) affects in a positive way desalter control, which in turn is important for avoiding fouling.
1.1.3. Preflash Drum
The preflash separates lighter components of the oil before it enters the furnace, thus reducing its load. The use of the preflash in CDUs was originally proposed by Brugma (1941) and discussed in a number of publications (Feintuch et al., 1985; Yahyaabadi, 2005; Errico et al., 2009). Nowadays many refineries use it as a convenient way of debottlenecking the CDU and reducing the risk of a two-phase flow in the hot section of the train. While the gas phase bypasses the furnace and enters the distillation column directly, the liquid phase is further preheated in the hot end of the PHT before entering the furnace.
1.1.4. Furnace
The furnace is a fired heater where the crude is brought at the desired inlet temperature of the distillation column. The furnace is divided in two distinct sections: a convective and a radiant section. The crude, preheated in the PHT, enters in single-phase flow the convective section of the furnace where it is further preheated before entering the radiant section where boiling and evaporation occur.
Fouling in furnaces is also a major issue for refineries (Atkins, 1962; Takatsuka et al., 1989; Jegla et al., 2011; Morales-Fuentes et al., 2014). Unlike in heat exchangers, losses in heat transfer due to fouling are compensated by the large driving force produced by the radiant heat provided by the burners. However, the buildup of low thermal conductivity material produces an increase in the furnace tubes skin temperature, which limits the amount of heat that can be transferred.
1.2. Impact of Fouling on Crude Distillation Units
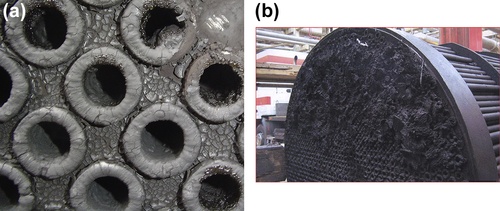
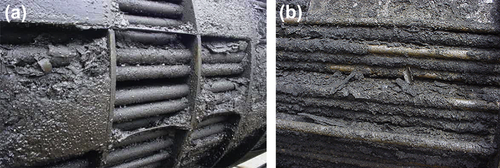
As a result of the change in temperature that the crude oil undergoes when processed in the PHT of an oil refinery, fouling material progressively deposits on the heat exchanger surfaces. This process can occur in both the tube-side (Figure 1.3) and the shell-side (Figure 1.4) of the heat exchangers.
Fouling on the shell-side is very often associated with low velocity zones close to the baffles (Figure 1.4(a)), but it also affects significantly the outside of the tubes in the bundle (Figure 1.4(b)). As a result, the shell-side heat transfer coefficient can also be significantly affected.
Refinery operators are constantly faced with the problems caused by the buildup of fouling in the PHT, including:
1. Operating difficulties
2. Economic penalties
3. Increased environmental impact
4. Health and safety hazards.
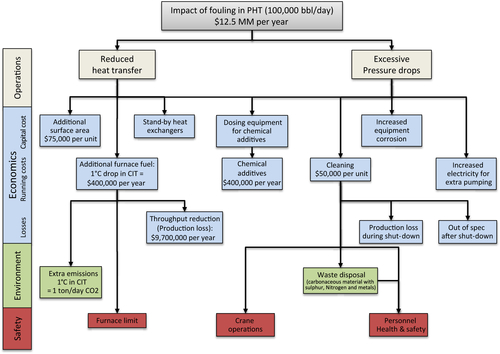
Figure 1.5 shows a schematic of the cascade of problems generated by fouling in a typical oil refinery processing 100,000 bbl per day and associated estimates of costs. The following sections review in detail each of the aspects above.
1.2.1. Operating Difficulties
Fouling material deposited on the heat transfer surfaces has a thermal conductivity—typically between 0.2 and 1 W m−1 K−1 (Watkinson, 1988)—up to two orders of magnitude lower than that of the tube metal wall (ca. 38 W m−1 K−1, depending on the metal used and temperature). As a consequence, heat transfer is impaired and the energy recovered reduced. This progressive decay in performance results in a typical loss of 8–11 °C per year in the CIT. To keep a steady temperature at the column inlet, the decline in CIT must be countered by burning additional fuel in the furnace downstream of the PHT. Not only is this an energy cost, but it also has an impact on the environment due to increased release of greenhouse gas emissions.
Moreover, when the furnace is operating at its firing limit, additional thermal inefficiency in the PHT cannot be countered any further by increasing the heat duty at the furnace. As a consequence, refineries are forced to reduce the throughput which, as will be shown later (Section 1.2.2.2), is the major cause of economic losses due to fouling.
There is little doubt that fouling affects greatly the CDU's energy efficiency. Estimations of the extra energy requirements caused by fouling deposition reported in the literature range from no less than 10% (Szklo and Schaeffer, 2007) to over 30% (Van Nostrand et al., 1981). Based on their experience Sikos and Klemes (2010) recently evaluated that refinery energy consumption was 10–20% higher because of fouling in CDUs. Thermal efficiency of the PHT is therefore a major concern and plants usually have targets for CIT. Refinery operators adopt different strategies to achieve such targets. For example, Zabiri et al., (2006) indicated that heat exchangers are cleaned when the overall heat transfer coefficient drops to a value below 30% of the clean value. Depending on a number of factors (e.g., refinery configuration, cost of fuel margins, etc.), some operators may decide to shutdown for cleaning when smaller drops of efficiency is reached. Often at 80–85% efficiency (taking into account the heat recovery in the entire PHT) the economic incentive is large enough to justify cleaning. Other operators monitor the fouling resistance as a means to decide when the right time for cleaning is. In this case when an excessive value of Rf is reached in one or more heat exchangers, these are taken out for cleaning.
Whereas it is more common for a PHT to be thermally limited, in some occasions, the hydraulic implications of fouling may be dominating. Usually refineries have a discrete hydraulic flexibility but problems can arise if the progressive reduction of the cross-sectional area available to the crude flow causes an excessive increase in pressure drops. If the throughput is to be kept constant, more pumping power must be spent until pump capacity is reached. In some extreme (but not rare) cases, plugging of tubes (Figure 1.3(b)) can occur, forcing a shutdown of the unit for cleaning.
When economic penalties become excessive, cleaning actions, which disrupt normal refining operations, are required. Refinery personnel give particular importance to the planning of cleaning actions. Dismantling units for cleaning is in fact a hazardous and costly operation (see Section 1.2.4) for which planning is paramount. Several authors dealt with different aspects of the cleaning scheduling of heat exchanger networks in general (Markowski and Urbaniec, 2005; Sanaye and Niroomand, 2007) and PHTs in particular (Wilson and Polley, 2001; Smaïli et al., 2001; Lavaja and Bagajewicz, 2004, 2005a,b; Rodriguez and Smith, 2007; Ishiyama et al., 2009a).
1.2.2. Economic Penalties: The Cost of Fouling
Estimating fouling costs is a complex activity, especially when antifoulants are used (Pritchard, 1988b), as estimates depend on many variable such as the current price of the crude barrel, market demand, the geographical region of the refinery, and the cost of applicable environmental policies.
As noted at the beginning of this chapter, there are only a few studies in the literature that report figures for fouling-related costs in oil refineries. To date, the most comprehensive one is the study by Van Nostrand et al. (1981) who collected information for crude distillation, hydrotreating, reforming, and visbreaking units and broke them down in three categories: extra energy consumption, throughput loss, and maintenance costs. The figures reported are staggering: process-side fouling in United States refineries was estimated US$ 1.36bn per year, US$ 861 MM of which is attributed to the crude PHT alone. Just adjusting for inflation1 to 2014 this is equivalent to US$ 3.6bn and US$ 2.26bn, respectively. From some even older data for the United Kingdom (Thackery, 1979) it is possible to estimate the overall cost of PHT fouling between £5 and 7 MM per year, which, in 2014 US$, would be equivalent to ca. 35–50 MM. For a single refinery processing 100,000 bbl per day, Van Nostrand et al. (1981) estimated fouling-related costs at US$ 25.7 MM per year (2014 basis) with almost 50% of it attributed to fouling in the PHT. The major loss was due to the reduction in throughput (ca. 40%), followed by the energy costs (ca. 10%), and only a small fraction (<1%) is due to maintenance (Figure 1.6).
Note that the estimations by Van Nostrand et al. were made at a time (1981) when environmental policies were not as strict as at present (e.g., the Emission Trading Scheme), the crude barrel was significantly cheaper (ca. US$30), and worldwide refinery throughput was considerably lower. Simply adjusting for inflation 30-year-old figures are not sufficient to capture fluctuations in market conditions (i.e., price of oil, demand) and improvement in technology and fouling management methodologies.
A recent life cycle cost analysis over 25 years in the hot end of the PHT of a 50,000 bbl day−1 refinery showed a US$25MM negative net present value (NPV). The analysis accounted for the cost of periodic cleanings and tube bundle replacements. It is estimated that if mitigation strategies are implemented and fouling is reduced by about 70%, the NPV can be improved to –US$4MM.
Table 1.2 summarizes the fouling-related costs in CDUs reported in the literature or collected as personal communications.
Table 1.2
Summary of typical economic losses associated to fouling in CDUs. Adapted from Coletti (2010).
| Loss type and fouling location | Refinery size (bbl per day) | Original figure (US$) | Source | Adjusted to 2014 US$ |
| Whole refinery | 100,000 | 9.87 MM per year | Van Nostrand et al. (1981) | 25.7 MM per year |
| PHT | 100,000 | 4.78 MM per year | Van Nostrand et al. (1981) | 12.5 MM per year |
| One branch of the PHT | 360,000 | 1.8 MM per year | Liporace and de Oliveira (2007) | 2 MM per year |
| Throughput reduction | 160,000 | 1.5 MM in 3 months | ESDU (2000) | 2 MM in 3 months |
| 100,000 | 3.73 MM per year | Van Nostrand et al. (1981) | 9.7 MM per year | |
| n.a. | 2 bbl−1(Texas) | Polley et al. (2009a) | 2.22 bbl−1 | |
| n.a. | 10 bbl−1(India) | Polley et al. (2009a) | 11 bbl−1 | |
| 50,000 | – | This workb | 1.1 MM yr−1 | |
| Extra fuel at furnace | 100,000 | 1.02 MM per yeara | Van Nostrand et al. (1981) | 2.7 MM per year |
| 400,000 per year | Panchal and Huangfu (2000) | 550,000 per year | ||
| Extra CO2 due to fouling | 100,000 | 750 tCO2 per year (=€22,500 per year)c | Yeap (2003) | 30,400 per year |
| Drop of 1 °C in CIT | 100,000 | 1 tCO2 per day = 100,000 per year | Baudelet and Krueger (1998) | 145,000 per year |
| 215,000 | £250,000 per year | Personal comm. (2009) | 400,000 per year | |
| Production loss due to HEX out of service | 100,000 | 20,000 per day = 80,000 per clean | Baudelet and Krueger (1998) | 30,000 per day = 120,000 per clean |
| Cleaning of a unit | n.a. | 30–50,000 per unit | Personal comm. (2009) | 30–50,000 per unit |
| Antifoulants | 100,000 | 155,000 per year | Van Nostrand et al. (1981) | 400,000 per year |
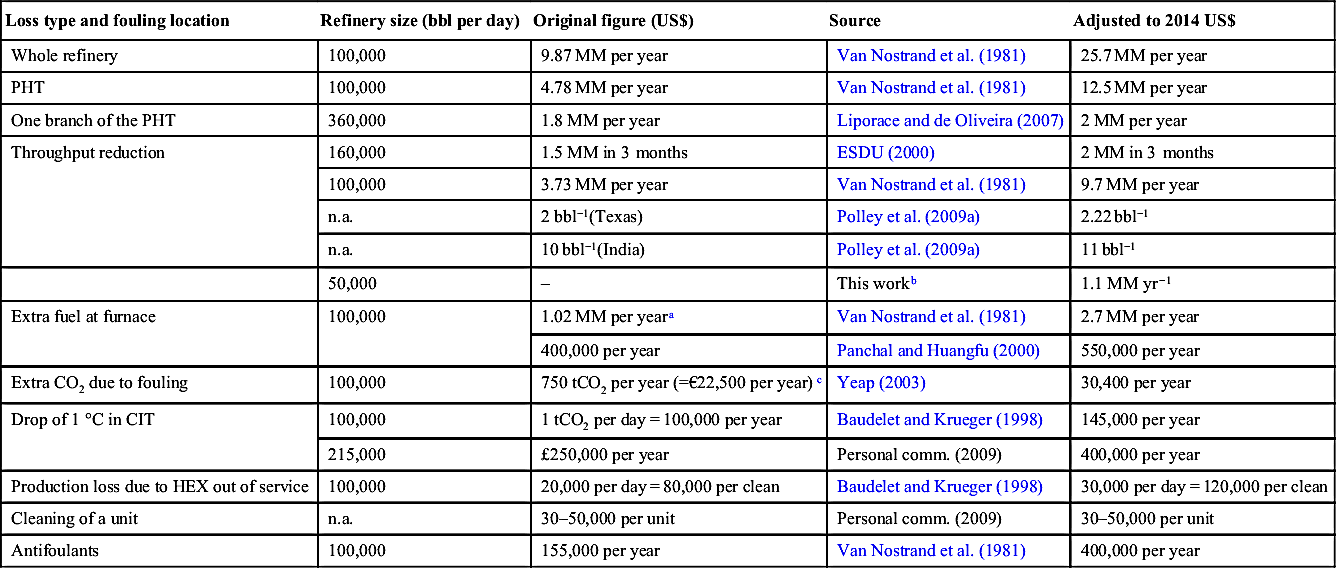
Note: Inflation calculated with the average Consumer Price Index for a given calendar year (data from US Bureau of Labor Statistics).
In the following sections a breakdown analysis highlights the individual contribution to the losses due to fouling in the CDU.
1.2.2.1. Fuel Costs
Van Nostrand et al. (1981) reported a typical decay rate in the coil inlet temperature due to fouling in the PHT of 4–10 °F per month (ca. 2–5 °C per month). In more recent discussions, experts from major oil companies were much more optimistic estimating this figure and reported a decay rate of 8–11 °C per year in heavy fouling trains.
The cost associated with the extra fuel burnt to counter the drop in CIT is very significant for the economics of the refinery. A 1 °C drop in CIT has been reported to cost to a United Kingdom refinery (215,000 bbl per day capacity) ca. £250,000 per year (ca. US$400,000 per year). Assuming an average 5 °C drop over a year, this would cost the refinery over US$2 MM. Other costs figures were reported in literature by Panchal and Huangfu (2000) who estimated for a smaller refinery, processing 100,000 bbl per day, an economic loss of about US$550,000 per year. Recently, Liporace and de Oliveira (2007) reported US$1.8 MM per year extra costs in fuel alone due to fouling in one branch of the PHT of a Brazilian refinery (360,000 bbl per day), which amounts to over US$2 MM in 2014.
A recent evaluation of operating data from ca. 15 heat exchangers in the hot end of the PHT in a 50,000 bbl day−1 CDU showed that the total heat duty loss due to the two worst fouling heat exchangers was 5.98 MW averaged over a 1 year period. This translates into an energy cost of US$1.1 MM per year, at US$22 MWh−1.
1.2.2.2. Pumping power
If the CDU is not hydraulically limited (i.e., case 1 described in the section below), the increase in pressure drop across the heat exchangers in the PHT can be compensated by increasing the pumping power required to overcome them. In this case, the control valve placed between the last exchanger of the preheat train and the furnace drop, can be adjusted to compensate for the pressure drops increase in the heat exchanger network. This of course comes at a price, paid in terms of the extra electricity spent at the pump. However, as shown in a later chapter (Section 5.4), pumping power costs are typically dwarfed by the costs related to thermal inefficiencies. As a result, unless fouling causes blockage of the entire exchanger, the increased pumping power associated with it is rarely a concern for the refinery.
1.2.2.3. Reduction in Throughput
Refinery operating strategy is normally that of maximum throughput. The reduction in thermal and hydraulic efficiency caused by fouling is paid not only at the furnace or at the pump as extra energy but, more importantly, as loss in production. Production loss due to fouling can occur for two reasons:
1. Hydraulic limitations of the PHT. The volumetric flowrate, provided by the pump is given by:
![]() (1.1)
(1.1)
where ηmech is the mechanical efficiency of the pump, W the pumping power and ΔP the differential pressure. As discussed in Section. As discussed in Section 1.2.2.2, the pumping power, required to maintain a constant flowrate as fouling builds up in the PHT, needs to increase over time. However, when the maximum capacity of the pump is reached, the system is not able to compensate for the extra pressure drops and the throughput is reduced.
2. Thermal limitations of the CDU. Any furnace used in refinery applications has a maximum heat duty achievable (often referred to as furnace firing limit), which is typically constrained by the maximum skin temperature possible in the tubes and by the temperature of the flue gases in the chimney:
![]() (1.2)
(1.2)
where  is the crude mass flow rate in the furnace and cp its specific heat capacity. Given that the COT must be kept constant while the CIT decreases because of fouling, the heat duty increases (i.e., extra fuel must be burnt). With a large decline in CIT due to fouling, the furnace hits its firing limit. At this point, the throughput must be reduced causing loss of production, which is responsible for the major share of the total costs related to fouling in the CDU.
Thackery (1979) suggested that loss in production is the most difficult cost to estimate because it depends on the current level of market products demand. Regional differences also affect the cost of loss in production: Polley et al. (2009a) reported that at the beginning of 2009, this cost was US$2 bbl−1 in some United States refineries, over US$5 bbl−1 in Asian refineries, and over US$10 bbl−1 in one Indian refinery. The importance of including throughput loss in scheduling and operability considerations has been highlighted by several authors (Lavaja and Bagajewicz, 2005a; Polley et al., 2009b). Overall, Van Nostrand et al. (1981) estimated the throughput loss in US$9.4 MM per year (2014 dollars) for the 100,000 bbl per day refinery they considered. Coletti and Macchietto (2010) used an advanced mathematical model of refinery preheat trains to quantify and predict the impact of fouling and broke this down into the different contributions given by fuel, pumping, and environmental and production loss costs. They have shown how the reduction in throughput is, in fact, the most significant cost for the refinery related to fouling.
1.2.2.4. Maintenance (cleaning)
If the throughput is reduced because of the fouling-related increase in pressure drops, or if the costs incurred for extra fuel burnt at the furnace to compensate the energy inefficiency caused by fouling are deemed too high by the operator, selected units are usually taken off-line and cleaned. Worrell and Galitsky (2005) reported the results of an audit of the Martinez refinery (California) where it was found that regular cleaning of heat exchangers and maintenance of insulation would result in estimated annual savings of over US$14 MM at a total expenditure of US$9.85 MM with a payback period of around 8 months (DOE, 2002). In this context, monitoring of fouling (see Section 5.1) is a key activity for identifying units that need maintenance.
Cleaning is usually performed via dismantling a chosen unit and using water jets—typically at 1000 bar although in some special cases 2000 bar is required—to mechanically remove deposits from the heat transfer surfaces. The cost to clean a single unit via this methodology is very much location dependent, but could be between US$10,000 and US$50,000. To this figure, the cost due to production loss and increased fuel consumption while the heat exchanger is out of service for cleaning must be added. This has been estimated in US$30,000 per day in a 100,000 bbl per day refinery (Baudelet and Krueger, 1998). Considering that to clean each tube bundle requires up to a week before it is in service again, the total cost due to maintenance of a single heat exchanger can add up to US$150,000–200,000.
An alternative to the expensive (in terms of time, safety, and money) mechanical cleaning is chemical cleaning, performed by flowing a chemical solvent through the exchanger without the need for disassembly. The chemical action of the solvent dissolves some or all of the constituents of the solid foulant deposit. However, Joshi and Brons (2003) reported that attempts to chemically clean heat exchange equipment have been successful only in a limited number of cases, and even then, with benefits sustained for only a relatively short period compared to mechanical cleaning.
The limited success mentioned above is a result of several factors; the most important of those being the flow rate of the circulating solvent, the time between cleanings, and the chemical used. First, high volume circulation is required for a successful cleaning, and the small piping connections that are typically used to provide the circulation are not adequate. Second, as a general rule of thumb, chemical cleaning for heavily fouling heat exchangers should be carried out at intervals of 12 months or shorter. Attempts to clean after 18 or 24 months of operation have most often proved unsuccessful possibly because of the hardening of the fouling deposits over time (i.e., the ageing process described in Section 2.3.5) makes the chemicals less effective. Lastly, if the cleaning chemical is selected without knowing (or just guessing) the composition of the foulant deposit, it is often the case that unsuitable chemicals are used.
1.2.2.5. Antifoulants
In the 100,000 bbl per day refinery monitored by Van Nostrand et al. (1981) the decline rate of the PHT heat duty was 1.5 MW per month when no chemicals were used whereas the decay rate was reduced to 0.56 MW per month when antifoulants were added to the crude stream. They estimated the cost of chemicals at around US$392,300 per year (2014 basis), which was paid back by the 65% reduction in fouling and associated decrease in the number of cleanings required per year.
Despite some success stories such as the one above and the optimism of Canapary (1961) who stated that “a complete antifouling program will solve process side fouling in oil refineries”, a chemical solution capable of eliminating fouling seems to be still lacking. The complexity of the crude compositions, their variability of the blends processed over time, and the fact that fouling mechanisms are not yet fully understood (see Chapter 2) force suppliers to provide ad hoc solutions for each refinery. As a result, plant experience indicates that very often chemical treatment does not work for extended periods of time and in many cases is just ineffective.
1.2.2.6. Capital Costs
Heat exchanger design methodologies deal with fouling by simply compensating for the reduced heat transfer efficiency with the addition of larger heat transfer surfaces (see Section 5.2). However, not only is this practice far from being optimal it also increases the total capital expenditure. Moreover, examining 600 downstream process projects, Jones (1995) showed how project completion time is also affected by overdesign. In his study, project completion time for heat exchangers designed for capacity can be reduced by 17% because of the smaller equipment being built, transported, and installed.
The cost of a PHT heat exchanger, typically sized between 300 and 900 m2, can be roughly estimated at US$74,000–166,000 using a cost per unit area in the range of US$188–249 m−2 (ESDU, 1994)2. Considering that most heat exchangers are 30–50% oversized at the design stage due to the fouling factors design approach,3 the capital costs associated with the extra area can be evaluated in the range of US$22,000–83,000 per unit. As already noted, a typical PHT can use 16 to 60 heat exchangers; therefore, the total extra capital cost ranges from US$354,000 to US$5 MM. If special material of construction is used to avoid corrosion, these figures may grow substantially.
An extra capital expense is incurred if antifoulants are used. In fact, the costs associated to antifoulants are not limited to the chemicals themselves but also include the capital cost of dosing equipment necessary to inject them at the correct point in the crude stream.
1.2.3. Environmental Impact
The environmental impact of fouling in refineries has been estimated as being responsible for 88M t of CO2, accounting for 2.5% of all worldwide anthropogenic emissions in 2009 (Müller-Steinhagen et al., 2009a). Cap-and-trade regulations such as the Emissions Trading Scheme (ETS) enforced in Europe give a tag value to each ton of CO2 emitted by the refinery, adding to the total cost of fouling. According to ETS regulations, each installation is allocated allowances for emission of carbon dioxide. If the refinery exceeds the allocated allowances, it must buy extra ones in the market. The reverse is also true: if the allocated allowance is not reached, the excess allowance can be sold. Table 1.2 reports calculations made with a carbon tax rate at €30 t−1 which is the peak value reached in April 2006. Phase two of ETS started in January 2008 with a price fixed at €25 t−1 which dropped to €10 t−1.
Ecological aspects involve also the disposal of the carbonaceous deposits formed on the heat transfer surfaces which can be substantial. To illustrate the quantity of deposits that must be removed from the PHT of a refinery, Murphy and Campbell (1992) considered a refinery processing 27,000 t per day (ca. 200,000 bbl per day) of crude that contains 0.05% of what they call “sediments” and 10 ppm of salts. The potential deposits each year are 5000 t of sediments and 100 t of salts. More optimistically, Watkinson (2005) assumed that only one part per million by weight of the oil would deposit producing 15 t per year of solid carbonaceous material in a 300,000 bbl per day refinery. These deposits can contain sulfur, nitrogen, and metals and must be disposed in an adequate way.
1.2.4. Health and Safety Hazards
Aspects often overlooked in the literature but very much present in the minds of refinery operators are the health and safety hazards involved in dismantling for cleaning a pressurized vessel processing hydrocarbons. During the cleaning process, refinery procedures require a safety observer in 100% attendance to supervise the following risky activities:
1. Opening of the units. Although units are flushed with steam, flammable atmospheres and pyrophoric material are often present.
2. Extraction of the bundle with cranes (typically units are 6.1 m long and up to 1.5 m diameter) in confined spaces. Electrical hazards are also involved.
3. Transportation on trucks to storage.
4. Cleaning with 1000 bar water jets (although ultrahigh pressure pumps can provide up to 2800 bar for heavily fouled tube-side surfaces) with associated noise and toxic material being thrown in the atmosphere.
5. Delivery and reinsertion of the bundle with crane and trucks movement.
Safety is the primary concern for the oil industry. It is therefore not surprising that safety considerations, let alone the large costs involved, make crude oil fouling one of the biggest and more important challenges the industry is facing today.
1.3. Concluding Remarks
Given the impact of crude oil fouling on refinery operations, economics, safety, and environmental impacts shown above, the relevance and importance of tackling this problem are evident. However, as it has been anticipated in the Introduction of this chapter and as will be seen in more detail in the following ones, crude oil fouling is an extremely difficult problem to solve as it involves complex chemical and physical phenomena interacting at different scales of investigation. The scientific community, both in industry and in academia, agrees that only via a better understating of the fundamental causes and mechanisms of fouling will it be possible to mitigate—if not completely solve—this challenging and long-standing problem, at least as old as the refining process.
The following chapter will provide the reader with the necessary background on the science of the fouling process, which will be instrumental when looking at the experimental and modeling techniques used in crude oil fouling research and applications.
..................Content has been hidden....................
You can't read the all page of ebook, please click here login for view all page.