
Chapter 5: Humidity and Temperature Measurement
This chapter describes how to practically measure humidity and temperature in an environment, as well as how to connect specialized sensors to a microcontroller board. You will find out how to use the commonly used sensors DHT11 and LM35. In this chapter, you will gain valuable information regarding gaining data acquisition from a temperature and humidity sensor and a sensor module and how to display it to a user.
In this chapter, we are going to cover the following main topics:
- Introducing the DHT11 humidity and temperature sensor module
- Connecting the DHT11 and LM35 sensors to the microcontroller boards
- Coding to get data from the sensor module
- Showing the humidity and temperature data results on the serial port monitor
By the end of this chapter, you will have learned how to properly connect a DHT11 humidity and temperature sensor and an LM35 temperature sensor to the Curiosity Nano and Blue Pill microcontroller boards. You will have also learned how to analyze and display the data obtained from these sensors.
Technical requirements
The software tools that you will be using in this chapter are the MPLAB X and Arduino IDEs, for editing and uploading your programs to the Curiosity Nano and the Blue Pill microcontroller boards, respectively.
The code that will be used in this chapter can be found in this book's GitHub repository: https://github.com/PacktPublishing/DIY-Microcontroller-Projects-for-Hobbyists/tree/master/Chapter05
The Code in Action video for this chapter can be found here: https://bit.ly/2UiRHVP
In this chapter, we will be using the following pieces of hardware:
- A solderless breadboard.
- The Blue Pill and Curiosity Nano microcontroller boards.
- A Micro USB cable for connecting your microcontroller boards to a computer.
- The ST-LINK/V2 electronic interface needed for uploading the compiled code to the Blue Pill. Bear in mind that the ST-LINK/V2 requires four female-to-female DuPont wires.
- Green and yellow LEDs.
- Two 220-ohm resistors rated at one-quarter watt. These resistors are for the LEDs.
- One 4.7 kilo-ohm resistor rated as one-quarter watt. It is for the DHT11 sensor.
- One 2.2 kilo-ohm resistor rated as one-quarter watt. It is for the Liquid Crystal Display (LCD).
- One DHT11 humidity and temperature sensor module.
- One LM35 temperature sensor.
- Three male-to-female DuPont wires for connecting the sensor module to the solderless breadboard.
- A dozen male-to-male DuPont wires.
- A 1602 16x2 LCD display.
The next section provides a brief introduction to the DHT11 sensor module, its electrical characteristics, and how this module is used in electronic projects.
Introducing the DHT11 humidity and temperature sensor module
In this section, we'll review the DHT11 sensor module. This section also describes what the sensor pins are, and how to connect them to a microcontroller board. The DHT11 is an easy-to-use, practical, and low-cost sensor module that measures temperature within a range of 0 to 50 degrees Celsius, with an error rate of +-2%. It also measures environmental relative humidity (RH) within a range of 20% to 90%, with an accuracy of +-5%. These values can change a bit, depending on the sensor module's manufacturers. The next section describes what RH is, an environmental value that is read by the DHT11 sensor.
What is relative humidity?
Relative humidity is based on a combination of water vapor and the temperature of the environment. It is a ratio of the amount of water vapor present in the air at a certain temperature, expressed as a percentage. Generally, the amount of water vapor has a higher RH in cool air than hot or warm air. A related parameter is the dew point, which is the temperature that air from a place or environment must be cooled down to for it to become saturated with water vapor.
Measuring RH is important because it is related to the degree of discomfort people feel in an environment, among other applications. RH measurements can have useful applications, such as in greenhouses, where some plants need a certain degree of RH to thrive.
The DHT11 pins and their values
The following is a Fritzing diagram of the DHT11 sensor module. Please note that the DHT11 module may have a fourth pin, depending on its manufacturer. The fourth pin is not connected to anything (sometimes, it is labeled not connected, or NC):
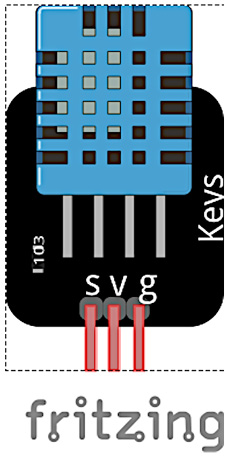
Figure 5.1 – The DHT11 sensor module
As we can see, the DHT11's v pin (it can also be labeled VCC or +, depending on the manufacturer) can be connected to a voltage supply of 3 to 5.5 V of direct current (DC). In this chapter, we will connect the DHT11 to a voltage of 3.3 volts, which can be supplied by both the Curiosity Nano and the Blue Pill boards. Pin s is the signal that provides the temperature and humidity data generated by the sensor. It can also be labeled as OUT or DATA, depending on the DHT11 manufacturer. Pin g (sometimes labeled as G, GND, or -) will be connected to the microcontroller board's ground. Most of the DHT11 modules' operating current is 0.3mA when measuring temperature and humidity, and 60 microamperes when in standby, making it a very low power sensor.
The following image shows two DHT11 sensor modules made by two different manufacturers:
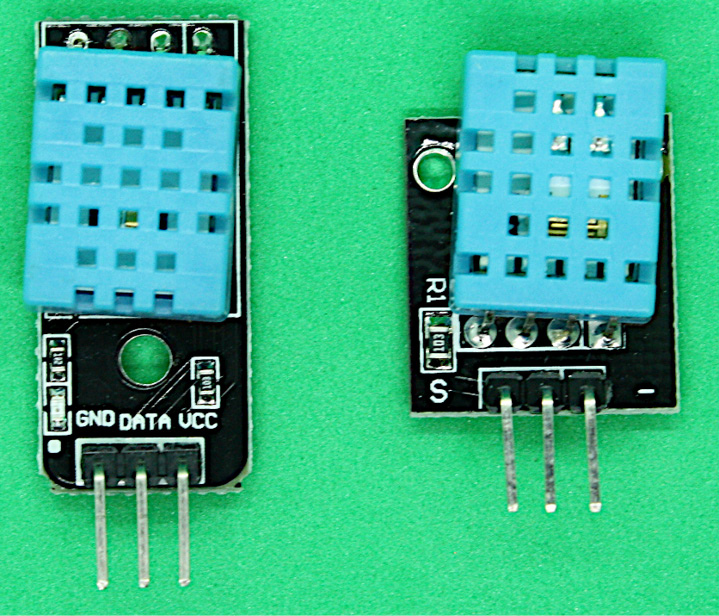
Figure 5.2 – DHT11 sensor modules
Please note that the DHT11 modules have slight differences. For example, both DHT11 modules have a different pin order. The one on the left has ground (labeled as GND), signal (labeled as data), and voltage (labeled as VCC) pins in that order, whereas the right one has signal (data), voltage, and ground pins in that order. Also, the pins have different labels. However, both DHT11 modules work the same and can be used in the circuits shown in this chapter. The sensor itself is encased in the plastic blue box with a grid. The DHT11 modules have extra electronic components that facilitate the connections to the sensor.
In this section, you learn about the DHT11 sensor module, its pins, and the similarities and differences among DHT11 sensors made by different manufacturers. You also reviewed what relative humidity is, an important environmental value that the DHT11 can read.
The next section will show you how to connect the DHT11 module to a Blue Pill's digital port so that you can read its values.
Connecting a DHT11 sensor module to the microcontroller boards
This section deals with all the hardware components in this chapter. We will begin by connecting the DHT11 to the Blue Pill board. Connecting the DHT11 to microcontroller boards is easy because it only requires three wires.
Connecting the DHT11 to the Blue Pill board
In this section, we will connect the DHT11 to the Blue Pill, as shown here:
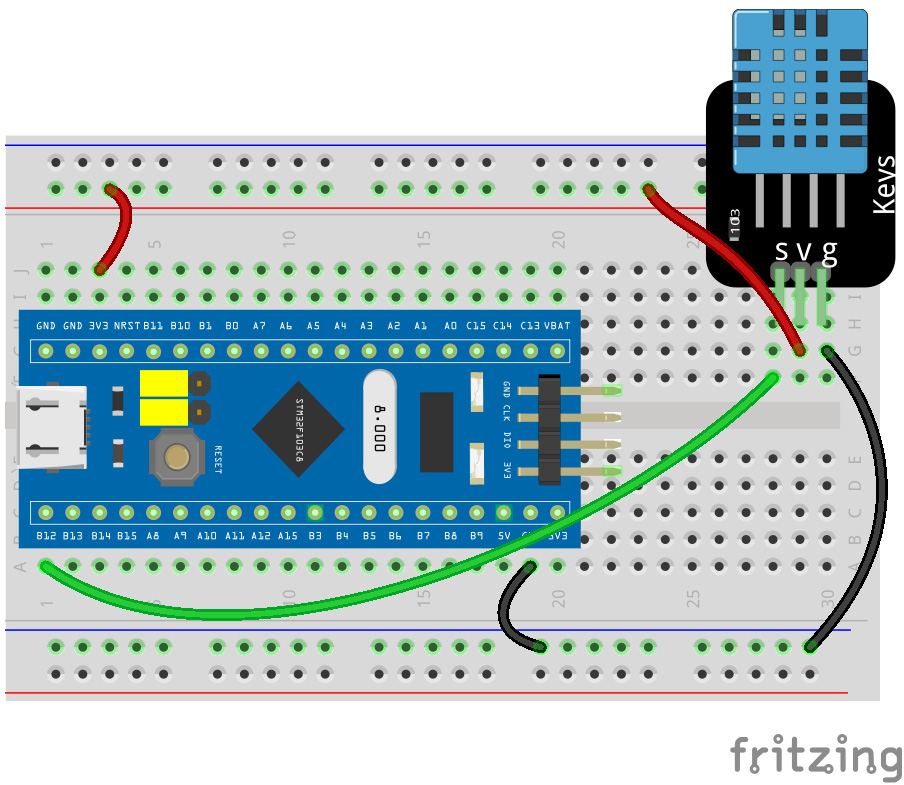
Figure 5.3 – The DHT11 connected to a Blue Pill microcontroller board
As we can see, the DHT11 connections are simple. In some DHT11 modules, their manufacturers recommend connecting a 5K-ohm pull-up resistor to the S (signal) pin. However, since 5K resistors are not commercially available, a resistor with a value of 4.7K-ohm is close enough to the recommended one. We did not need to connect a 4.7K-ohm to the DHT11 module that we used in our project because its electronic circuit already had a resistor like that.
Note
Depending on the manufacturer, many DHT11 modules already include a pull-up resistor, so the 4.7k-ohm pull up resistor is not necessary. It is worth checking it out. Just connect the DHT11 to the microcontroller board. If it gives erratic temperature measurements, or not getting measurements at all, you may need to connect the pull-up resistor to it.
Follow these steps to connect the DHT11 to the Blue Pill:
- Connect the Blue Pill's GND (also labeled as G) pin to the solderless breadboard rail.
- Connect the Blue Pill's 3.3 pin labeled (providing 3.3 volts) to the upper breadboard rail. Please note that in some Blue Pill boards, this pin is labeled as 3V3.
- Connect the DHT11's s pin to the Blue Pill's B12 pin.
- Connect the DHT11's v pin to the upper breadboard rail that was connected to the 3V3 pin.
- Connect the HDT11's g pin to the ground pin (the lower breadboard rail).
- Connect the USB cable to the Blue Pill and then to your computer.
The following image shows how everything should be connected:
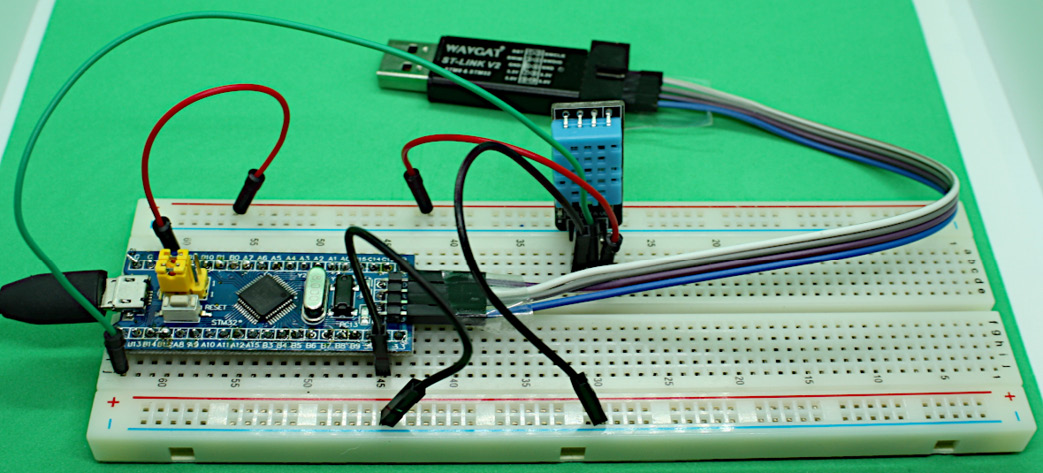
Figure 5.4 – The DHT11 connected to the Blue Pill
Here, we can see that we need just a few DuPont wires to connect the DHT11 to the Blue Pill board. You will need to connect the ST-LINK/V2 interface to your computer to upload its code, as explained in Chapter 1, Introduction to Microcontrollers and Microcontroller Boards. Don't forget to disconnect the USB cable first (shown on the left of the preceding image) before uploading a program to the Blue Pill. Please note that the order of the pins shown in the preceding image is GND, DATA, and VCC, which is different from the DHT11's pin order shown in Figure 5.3. Again, this is because some DHT11 manufacturers change the DHT11's pin order.
Note
All the Blue Pill's ground (GND) pins are the same; they are internally connected. This microcontroller board has more than one GND pin so that we can connect the electronic components to the board.
The temperature and humidity values will be shown on the computer's serial port monitor from the IDE. This will be explained in the Programming the DHT11 sensor for the Blue Pill board section.
The following image shows a Fritzing diagram with the DHT11 and a 4.7k-ohm pull-up resistor connected to the signal (S) pin. The DHT11 module used in this example does not have a built-in pull up resistor, so we need to connect one:
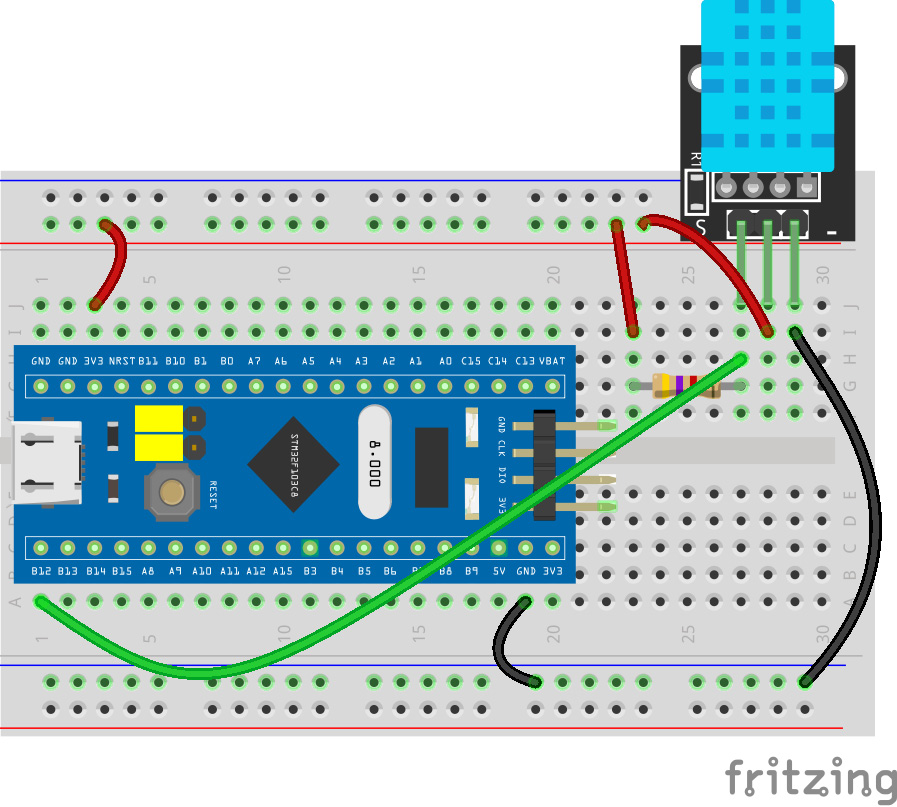
Figure 5.5 – A DHT11 with a pull-up resistor
The preceding image shows the 4.7 k-ohm resistor working as a pull-up resistor. The next section describes how to connect an LCD to show the temperature and humidity data obtained from the DHT11.
Connecting an LCD to the Blue Pill
This section shows an interesting and useful way of showing temperature and humidity data obtained from the DHT11 sensor, displaying it on a low-cost 1602 LCD. The following is a Fritzing diagram showing all the connections:
Figure 5.6 – A 1602 LCD connected to the Blue Pill board
The preceding image depicts the 1602 LCD, which can display 16 alphanumeric and special characters (for example, %, $, and so on) in two rows (16x2). Each character is formed with a 5x8 dot matrix. The LCD has 16 pins, labeled from left to right as VSS, VDD, V0, RS, RW, E, D0, D1, D2, D3, D4, D5, D6, D7, A, and K. This is a popular LCD that can also be used with Arduino microcontroller boards. The 2.2k-ohm resistor, which is connected to the V0 LCD pin, adjusts the LCD's contrast. Pins VSS and VDD are connected to a power supply. Pins D0 to D7 are used to send data to the LCD to form characters, but here, we're only using 4 bits (pins D4 to D7) to display the letters and numbers on the LCD. The 1602 LCD is connected to a 5-volt (+5V) power supply, which is supplied by the Blue Pill's 5V pin.
Bear in mind that the upper and lower breadboard voltage rails shown in the preceding image are connected to Blue Pill's 5V pin, providing 5 volts to the LCD. The DHT11 is connected to the Blue Pill's 3.3 pin because this sensor works with 3.3 volts. Its resulting data will be sent to the Blue Pill's input data pin, B12, using a digital voltage level with 3.3 volts.
Follow these steps to connect the DHT11 and the LCD to the Blue Pill while following the preceding image:
- Connect the Blue Pill's GND (also labeled as G) pins to the solderless breadboard rails.
- Connect the Blue Pill's 5V pin (providing 5 volts) to the breadboard rails.
- Connect the DHT11's s pin to the Blue Pill's B12 pin.
- Connect the DHT11's v pin to the Blue Pill's 3V3 pin.
- Connect the HDT11's g pin to the ground pin (the upper breadboard rail).
- Connect the USB cable to the Blue Pill and then to your computer or a USB power bank.
- Insert the LCD's 16 pins into the solderless breadboard.
- Connect the LCD's VSS pin to the ground pin (the lower breadboard rail).
- Connect the LCD's VDD pin to 5 volts (the lower breadboard rail).
- Connect the 2.2K-ohm resistor to the LCD's V0 pin and to the ground pin (the upper breadboard rail).
- Connect the LCD's RS pin to the Blue Pill's B11 pin.
- Connect the LCD's RW pin to the ground pin (lower breadboard rail).
- Connect the LCD's E pin to the Blue Pill's B10 pin.
- Connect the LCD's D4 pin to the Blue Pill's B0 pin.
- Connect the LCD's D5 pin to the Blue Pill's A7 pin.
- Connect the LCD's D6 pin to the Blue Pill's A6 pin.
- Connect the LCD's D7 pin to the Blue Pill's A5 pin.
- Connect the LCD's A pin to 5 volts (upper breadboard rail).
- Connect the LCD's K pin to the ground pin (upper breadboard rail).
- The LCD's D0, D1, D2, and D3 pins are not connected.
The following image shows how everything is connected:
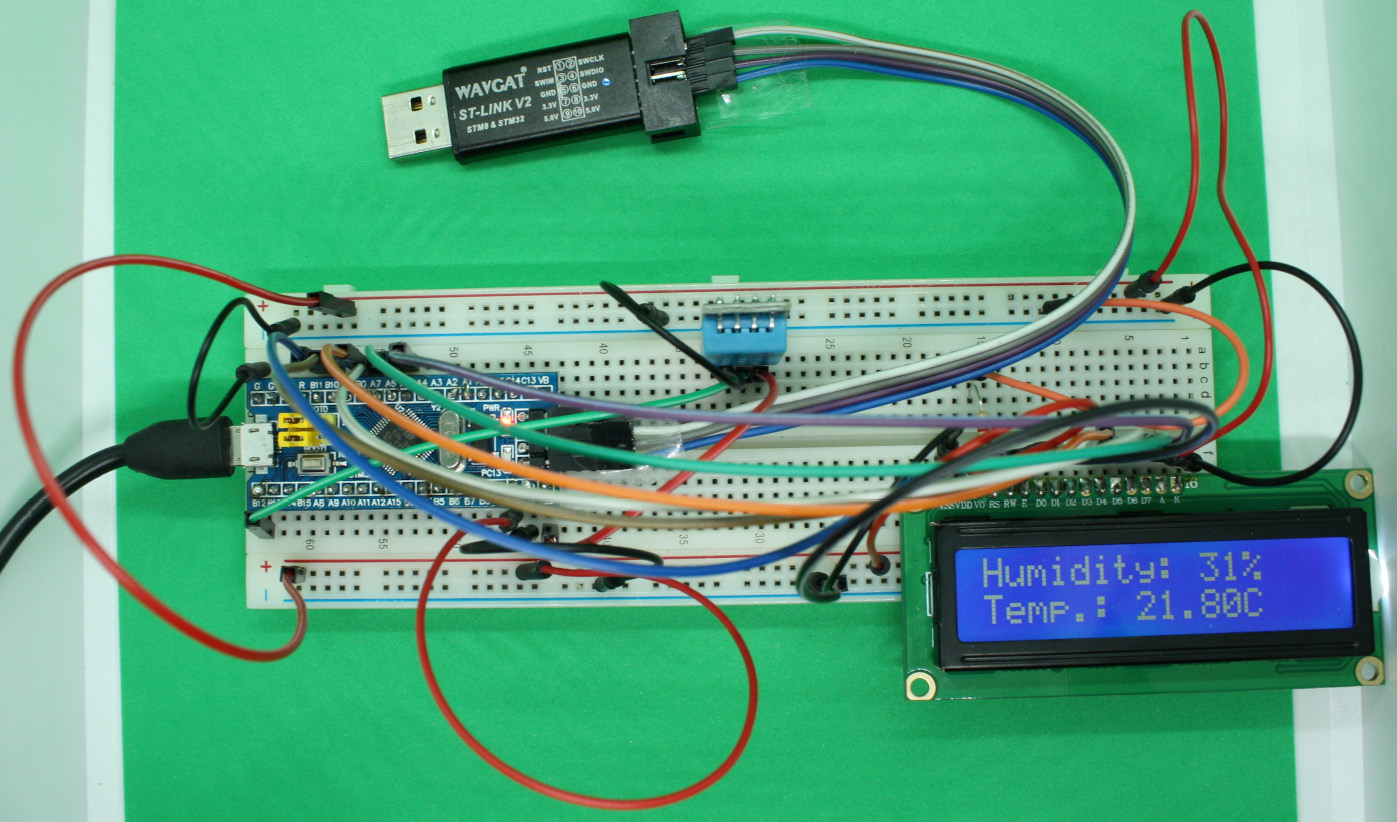
Figure 5.7 – The 1602 LCD connected to the Blue Pill microcontroller board
Here, you can see the LCD working because the Blue Pill is connected to a USB power bank (not shown in the preceding image). The LCD is displaying the local temperature in degrees Celsius, and the humidity is shown as a percentage. The code for programming the LCD and the DHT11 will be shown later in this chapter.
The next section will show you how to connect an LM35 temperature sensor to the Curiosity Nano board, demonstrating how to read temperature values from that sensor and sending them to an analog input port from the Curiosity Nano.
Connecting an LM35 temperature sensor to the Curiosity Nano board
In this section, we'll describe how to measure temperature values on a Curiosity Nano, obtained from an LM35 sensor. For demonstration purposes, the temperature will be analyzed when it falls within a thermal comfort zone of 23 to 26 degrees Celsius. The LM35 is a low-cost and easy-to-connect sensor that measures a wide temperature range, from -55 to 150 degrees Celsius. The following is a diagram of the LM35 sensor pinout:
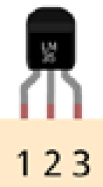
Figure 5.8 – The LM35 sensor showing pins 1, 2, and 3
As you can see, the LM35 has three pins: pin 1 (Vs), pin 2 (Vout), and pin 3 (GND). Pin 1 is the voltage coming from a power supply. The Curiosity Nano's VBUS pin provides 5 volts, so the LM35's pin 1 can be connected to it. Pin 2 is voltage out (Vout), providing the measured temperature value in terms of millivolts (mV) using a linear scale factor. This scale increases+10 mV for each degree Celsius (+10 mV/C). Pin 3 is connected to the microcontroller board's ground (GND).
The LM35 sensor signal pin (pin 2) provides the temperature values in mV, which will be converted into digital values by the Curiosity Nano. To do this, we need to connect the LM35's pin 2 to an input analog port from the Curiosity Nano. The temperature value is calculated as temperature=(5.0/1023)*millivolts_from_LM35, where 5.0 is the 5 volts connected to the LM35's pin 1 and 1023 is the 10-bit ADC from the Curiosity Nano, which means that its ADC can detect (2^10) discrete analog levels. The formula converts the LM35's output, in mV, into an equivalent value in degrees Celsius. The following image shows the LM35 sensor:
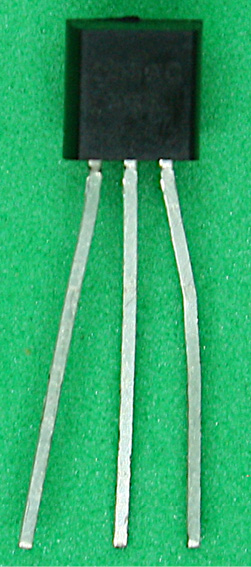
Figure 5.9 – The LM35 temperature sensor
The preceding image shows the LM35 temperature sensor with its three pins. It is the same size as a regular transistor since both have a TO-92 semiconductor package type. However, the LM35 is not a transistor – it's a temperature sensor.
We must connect two LEDs to its output ports to show the temperature and humidity ranges, as shown here:
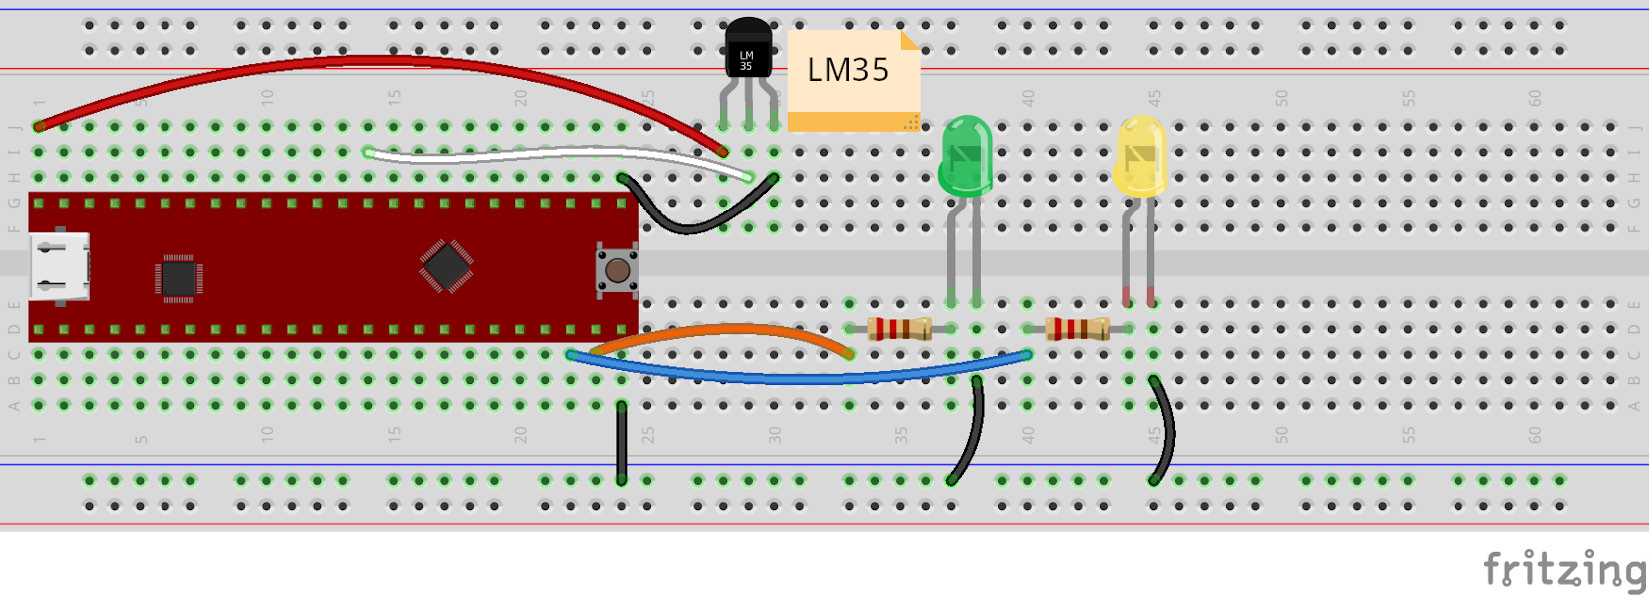
Figure 5.10 – Connecting the LM35 sensor and the LEDs to the Curiosity Nano board
As you can see, we must connect a green LED to show that the environment temperature being read by the LM35 sensor is within the thermal comfort zone for an office with a range of 23 to 26 degrees Celsius; and a yellow LED will be turned on if the temperature is outside that range. The temperature values from the thermal comfort zone used in this chapter are determined by the Canadian Standards Association, which are similar to the values defined by other agencies from other countries. The thermal comfort zone values can be found here: https://www.ccohs.ca/oshanswers/phys_agents/thermal_comfort.html.
Follow these steps to connect the LM35 and the LEDs to the Curiosity Nano board:
- Connect the Curiosity Nano's GND pin to the lower rail of the solderless breadboard rail.
- Connect the LM35's Vout (signal) pin (2) to the Curiosity Nano's RA0 pin. It will be used as an analog input port.
- Connect the LM35's Vs pin (1) to the Curiosity Nano's VBUS pin. This pin provides 5 volts.
- Connect the LM35's g pin (3) to the Curiosity Nano's GND pin from its upper pin row.
- Now, connect the two 220-ohm resistors to the Curiosity Nano's RD2 and RD3 ports and to the anodes of the two LEDs, respectively.
- Connect the LEDs' cathodes to the ground pin.
- Finally, connect the USB cable to the Curiosity Nano and then to your computer or a USB power bank.
The following image shows how everything should be connected:
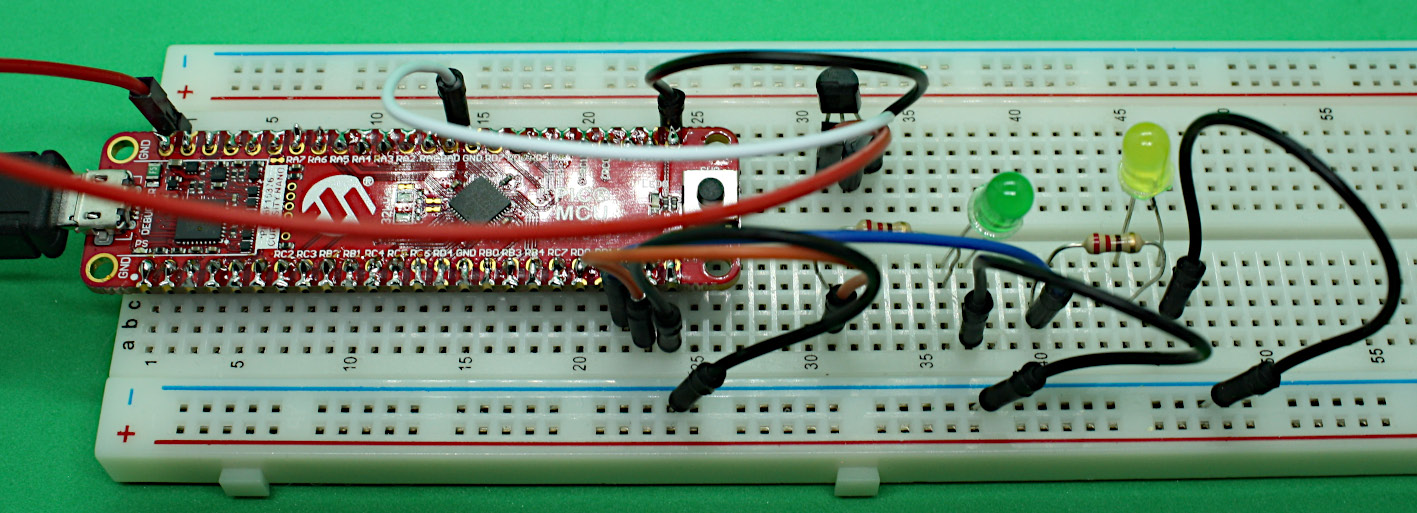
Figure 5.11 – The LM35 sensor connected to the Curiosity Nano board
The preceding image shows the LM35 connected to the Curiosity Nano's RA0 at the upper pins row.
Note
All the Curiosity Nano's GND pins are the same; they are internally connected. This microcontroller board has more than one GND pin so that we can connect electronic components to the board.
In this section, you learned about the LM35 temperature sensor, its pins, and how to connect it to a microcontroller board. You also learned how to show the temperature information with LEDs. The next section will show you how to write programs for reading humidity and temperature values from the DHT11 sensor.
Coding to get data from the sensor module
This section describes how to code a program for both the Blue Pill and the Curiosity Nano boards so that they can read values from the DHT11. You will also learn how to program the LM35 temperature sensor with the Blue Pill. Let's start by programming the DHT11 sensor for the Blue Pill board.
Programming the DHT11 sensor for the Blue Pill board
In this section, you will review the code that gets data from the DHT11 sensor using a special library. The code will also show you how to display the temperature and humidity data on the serial port, and thus on the Arduino IDE's serial monitor. The following code reads both the temperature and humidity from a DHT11 sensor module, which is connected to digital input port B12 of the Blue Pill:
#include <DHT.h>
#define DHT11_data_pin PB12
DHT dht(DHT11_data_pin, DHT11);
void setup() {
Serial.begin(9600);
while (!Serial);
Serial.println("Opening serial comm.");
dht.begin();
}
void loop() {
float humidity = dht.readHumidity();
float temperature=dht.readTemperature();
Serial.println("Humidity: "+String(humidity));
Serial.println("Temperature: "+String(temperature));
delay(1000);
}
In the preceding code, you can see that the first line includes a library called DHT.h. This is a very practical library for reading values from the DHT11. This code can be found in this book's GitHub repository, which contains useful comments explaining its main parts. To install the DHT.h library on the Arduino IDE, follow these steps:
- Click on Tools | Manage Libraries from the IDE's main menu.
- Type DHT11 in the Library Manager's search field.
- Several libraries will be listed. Select and install the highest version of the DHT sensor library, made by Adafruit.
- Wait until the library has been installed. Then, close the Library Manager. Now, the DHT11 library should be ready to use in your code.
Please note that the dht.readTemperature() function returns temperature values in degrees Celsius, while the dht.readHumidity() function returns values as a percentage of RH.
The following screenshot shows the Arduino IDE's Library Manager showing the library called DHT sensor library by Adafruit:
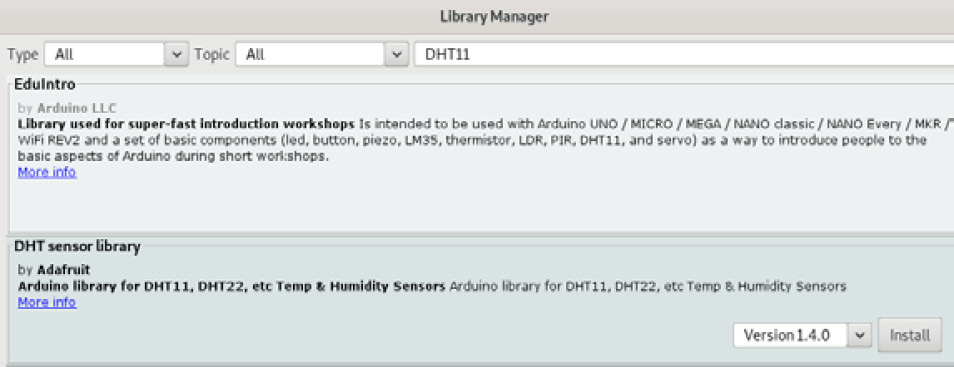
Figure 5.12 – The Arduino IDE's Library Manager
Here, you can see that by typing DHT11 in the search field, you can find the DHT sensor library by Adafruit. Click on the Install button.
Tip
You can also connect a DHT11 sensor to an Arduino Uno microcontroller board. Just connect the DHT11's s (signal) pin to any digital port from 2 to 13 from the Arduino Uno and change the pin number in the constant DHT11_data_pin shown in the preceding code. In addition, connect the DHT11's GND and VCC pins to the Arduino Uno's GND and 3V3 pins, respectively.
The next section will show you how to display the humidity and temperature data on a 1602 LCD.
Coding the sensor module and the 1602 LCD
The following code describes how to get the temperature and humidity data from the DHT11 sensor and how to display that data on the 1602 LCD:
#include <DHT.h>
#include <math.h>
#include <LiquidCrystal.h>
const int rs = PB11, en = PB10, d4 = PB0, d5 = PA7, d6 = PA6, d7 = PA5;
LiquidCrystal lcd(rs, en, d4, d5, d6, d7);
#define DHT11_data_pin PB12
DHT dht(DHT11_data_pin, DHT11);
void setup() {
dht.begin();
lcd.begin(16, 2);
}
void loop() {
float humidity = dht.readHumidity();
float temperature=dht.readTemperature();
lcd.setCursor(0, 0);
lcd.print("Humidity: "+String(round(humidity))+"% ");
lcd.setCursor(0,1);
lcd.print("Temp.: "+String(temperature)+"C ");
delay(1000);
}
Bear in mind that the code that's been uploaded to this book's GitHub repository contains many comments explaining the main parts of the preceding code. LiquidCrystal.h is the library that's used for controlling the 1602 LCD. The math.h library contains the round() function, which is used for rounding the humidity value. Both libraries belong to the Arduino IDE's original installation files, so we don't need to download or install them separately. DHT.h is a library for reading DHT11 values; its installation was explained previously in this chapter.
The next section describes how to code the LM35 temperature sensor to the Curiosity Nano microcontroller board.
Programming the LM35 sensor on the Curiosity Nano board
The following code reads the temperature from an LM35 sensor connected to analog input port RA0 of the Curiosity Nano:
#include "mcc_generated_files/mcc.h"
static uint16_t LM35read=0;
float temp=0.0;
void main(void)
{
// initialize the device
SYSTEM_Initialize();
ADC_Initialize();
while (1)
{
IO_RD2_SetLow();
IO_RD3_SetLow();
LM35read=ADC_GetConversion(channel_ANA0);
temp=(5.0/1023)*LM35read;
if (temp>=23.0 && temp<=26.0)
{
IO_RD3_SetHigh();
} else {
IO_RD2_SetHigh();
}
__delay_ms(500);
}
}
As you can see, the Curiosity Nano performs an analog to digital conversion for the value that is read from the LM35 sensor using the ADC_GetConversion() function. We also used the formula for calculating the degrees Celsius according to the mV read from the LM35; that is, temp=(5.0/1023)*LM35read;.
With that, you have learned how to get data from the DHT11 sensor module and the LM35 sensor by coding the Blue Pill and Curiosoty Nano. The next section will show you how to display the DHT11 data on the Arduino IDE's serial monitor.
Showing the humidity and temperature data results on the serial port monitor
This section describes how the DHT11 data is displayed with the Blue Pill on the serial port monitor and the Curiosity Nano microcontroller boards, and also discusses what to do next with the data that's obtained from the DHT11 sensor module.
Open and run the code for the Blue Pill on the Arduino IDE. You can read the data that was obtained from the DHT11 by clicking on Tools | Serial Monitor from the Arduino IDE's main menu. This can be seen in the following screenshot:

Figure 5.13 – Screenshot of the Arduino IDE's serial monitor
Here, you can see that the humidity and temperature values that were obtained from the DHT11 are shown with decimal points, thus showing a more accurate temperature. Remember that the variables storing these values were declared with the float type.
Tip
If you can't open the IDE's serial monitor and if the IDE shows a message telling you that the USB port cannot be found, it may be that the USB cable that you connected to the Blue Pill and to your computer is faulty. In addition, some USB cables are not capable of transmitting data because those cables are only used for charging devices, which you should not use with the Blue Pill.
Please note that the temperature shown in the preceding screenshot is in degrees Celsius and that the RH is displayed as a percentage.
Plotting the data
The Arduino IDE's serial port monitor has an interesting option for plotting the values that are read from the DHT11 and sent to the serial port graphically. Those values are plotted in real time.
Click on Tools | Serial Plotter from the Arduino IDE's main menu and see how the data is displayed graphically, as shown here:
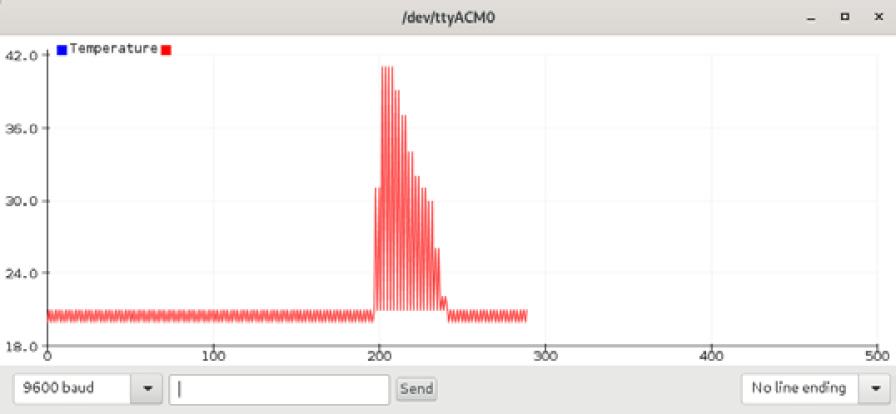
Figure 5.14 – Screenshot of the HDT11 serial plotter
Here, you can see how the DHT11 data is plotted graphically. The y axis represents the amount of humidity, while the x axis represents the time in seconds. The graph shows a peak because the environmental humidity changed at that time. To test how the DHT11 sensor's humidity measures change, just blow on the sensor.
In this section, you learned how to open the Arduino IDE's serial monitor and how the DHT11 sensor module data is displayed on it, including how to plot that data graphically.
Summary
In this chapter, we learned the basics of the DHT11 humidity and temperature sensor and the LM35 temperature sensor, including their operating ranges and how these sensors send data to a microcontroller board. These are practical and low-cost sensors that the Blue Pill and the Curiosity Nano can easily handle. This chapter showed two ways of showing humidity and temperature results. The Blue Pill showed the humidity and temperature values directly on the computer monitor and on an LCD, while the Curiosity Nano showed temperature and humidity ranges with LEDs. This chapter was beneficial because you learned how to get environmental data from sensors using microcontroller boards and how to display it effectively, using the microcontroller boards' input and output ports. This chapter also highlighted the use of an LCD to show the temperature and humidity data.
Chapter 6, Morse Code SOS Visual Alarm with a Bright LED, will review how to create a practical visual alarm.
Further reading
- Horowitz, P., Hill, W. (2015). The art of electronics. [3rd ed.] Cambridge University Press: New York, NY.
- LM35 (2017). LM35 Precision Centigrade Temperature Sensor datasheet. Texas Instruments. Available from: https://www.ti.com/lit/ds/symlink/lm35.pdf
- Microchip (2019). PIC16F15376 Curiosity Nano hardware user guide. Microchip Technology, Inc. Available from: http://ww1.microchip.com/downloads/en/DeviceDoc/50002900B.pdf
- Mouser (2020). DHT11 humidity and temperature sensor datasheet. Mouser, Inc. Available from: https://www.mouser.com/datasheet/2/758/DHT11-Technical-Data-Sheet-Translated-Version-1143054.pdf