Our second app will be a simple music visualizer using the Audio API, File Drag and Drop API, and Canvas. We'll split it into two parts: first, the drop area for a music file, which will load its content using readAsDataUrl(), and place its content into the src attribute of the audio element. Then, we connect various filters to the audio stream and read its raw output from the audio analyzer.
Note
Dartium doesn't support some common audio/video formats, such as *.mp3 (http://www.chromium.org/audio-video). Although you can enable it manually, try using *.mp4, *.webm, or *.m4a instead.
We can start with a short HTML snippet:
<!-- web/index.html -->
<body>
  <h1>Chapter 03 music visualizer</h1>

  <audio autoplay loop controls="true">
    Your browser does not support the audio element.
  </audio>

  <div id="fileDrop">drop music file here</div>
  <canvas width="300" height="50" id="canvas"></canvas>
</body>
Now, add the Drag and Drop event listeners to the #fileDrop element:
// web/main.dart
import 'dart:html';
import 'dart:math';

class MusicVisualizer {
  AudioElement _audio;

  MusicVisualizer() {
    Element dropZone = document.querySelector('#fileDrop'),
    _audio = document.querySelector('audio'),

    // This is the event that we need.
    dropZone.onDrop.listen((MouseEvent event) {
      event.preventDefault();
      event.stopPropagation();
      // Although, user can drop multiple files we're interested
      // only in the first one.
      File file = event.dataTransfer.files.first;
      var reader = new FileReader();

      document.querySelector('h1').text = file.name;

      // When the file is loaded we want to add our filters.
      reader.onLoad.listen(audioLoaded);
      reader.readAsDataUrl(file);
    });

    // Prevent default browser behavior because by default
    // browser would open the file and we wouldn't be
    // able to read its content.
    dropZone.onDragOver.listen((MouseEvent event) {
      event.preventDefault();
      event.stopPropagation();
    });
  }

  void audioLoaded(ProgressEvent event) { }
}

void main() {
  var music = new MusicVisualizer();
}
In total, there are seven events related to Drag and Drop: onDragStart, onDragEnd, onDrag, onDragEnter, onDragLeave, onDragOver, and onDrop.
We only care about onDrop and onDragOver, so we can leave the rest unused.
Now, we're going to add three filters (in the context of the Audio API, they call it audio nodes). Two frequency filters, lowpass and highpass, can cut off frequencies lower or higher than the specified threshold. We'll use them to cut off frequencies that aren't audible to the human ear because it doesn't make sense to visualize sounds that we can't hear. The last filter is the audio analyzer, which we can use to access raw audio data.
We'll chain all three filters from the audio source to the destination where the destination is the default audio output.
source => filter1 => filter2 => analyzer => destination
In other words, we're going to add three nodes between the source and the destination and hook up the analyzer node to access raw audio data.
Note
There are other types of filters in addition to these three (https://developer.mozilla.org/en-US/docs/Web/API/BiquadFilterNode.type). We're not including all of them here because their usage is very similar.
Actually, if we just want to visualize the audio stream, we don't even need to use filters but we're including them here to make the example a little more complex:
// web/main.dart
import 'dart:web_audio';
import 'dart:typed_data';
/* … */

class MusicVisualizer {
  AnalyserNode _analyser;
  /* … */

  void audioLoaded(ProgressEvent event) {
    // Access audio file as Base64 encoded string.
    _audio.src = (event.target as FileReader).result;

    AudioContext audioCtx = new AudioContext();
    MediaElementAudioSourceNode source =
        audioCtx.createMediaElementSource(_audio);

    // Object that we'll use to access raw audio data.
    _analyser = audioCtx.createAnalyser();

    BiquadFilterNode filter1 = audioCtx.createBiquadFilter();
    filter1.type = 'lowpass';
    // Cut off all frequencies above this threshold.
    filter1.frequency.value = 20000;

    BiquadFilterNode filter2 = audioCtx.createBiquadFilter();
    filter2.type = 'highpass';
    // Cut off all frequencies below this threshold.
    filter2.frequency.value = 80;

    // The actual filter chaining.
    source.connectNode(filter1);
    filter1.connectNode(filter2);
    filter2.connectNode(_analyser);
    _analyser.connectNode(audioCtx.destination);

    // Play the audio file when it's loaded.
    _audio.play();

    this.run();
  }

  void run() { /* We'll write it in a moment */ }
}
Note that we're also including two more packages:
- The
dart:web_audiopackage has classes that work with the Audio API. - The
dart:typed_datapackage has low-level, type-specific structures. You usually don't need to work with such data structures unless you need really high performance code or when you're working with raw data, as with the Audio API or with WebGL and matrices.
Now we can group frequencies in the audio into N groups and draw them in a loop.
For timing, we could just use setTimeout() but with HTML5, we have a better method called requestAnimationFrame(). This delays the function call until the browser thinks it's the time to redraw the screen (usually trying to keep stable 60 fps):
int _bars = 300;

void run() {
  _canvas = document.querySelector('#canvas'),
  _ctx = _canvas.getContext('2d'),

  window.requestAnimationFrame(draw);
}

void draw(double time) {
  // Create and instance of [Uint8List] with fixed length.
  var arr = new Uint8List(_analyser.frequencyBinCount);
  // Flush current audio data into the array.
  _analyser.getByteFrequencyData(arr);

  // Divide all frequencies into _bars groups and sum them.
  List<int> barChart = new List.filled(_bars, 0);
  for (int i = 0; i < arr.length; i++) {
    int index = (i / (arr.length / _bars)).floor();
    barChart[index] += arr[i];
  }

  // max/min method are defined in [dart:math]
  double chartMax = barChart.reduce(max).toDouble();
  double chartMin = barChart.reduce(min).toDouble();

  // Clear canvas; this is a small hack that clears canvas
  // faster than calling [fillRect()] or [clearRect()].
  _canvas.width = _canvas.width;
  int barWidth = (_canvas.width / _bars).round();

  // Draw green rectangle for each bar.
  _ctx.fillStyle = "#00ff00";

  for (int i = 0; i < _bars; i++) {
    // Height of a bar is relative to the size of the highest bar.
    double height = _canvas.height *
        ((barChart[i] - chartMin) / chartMax);
    // Coordinates 0x0 are at the top left corner.
    // [fillRect()] takes top left and bottom right corner of the
    // rectangle you want to draw and fills it with color
    // set with [fillStyle].
    _ctx.fillRect(barWidth * i, _canvas.height – height,
        barWidth * (i + 1), _canvas.height);
  }

  // Draw again when the browser is ready.
  window.requestAnimationFrame(draw);
}
Instead of drawing bars with rectangles, we could also use lineStyle, lineWidth, moveTo(), lineTo(), and stroke(). At the end, it would probably be more complicated because with moveTo() and lineTo(), you are setting the center of the line that you're going to draw. With 1 px line width, this means a 0.5 px overlap on each side, which would create blurred lines (unless, you add 0.5 px to each coordinate in moveTo() and lineTo()).
If you look at the code, you will notice that there are quite a lot of operations. Depending on the music file that you drop to #dropZone, getByteFrequencyData() fills arr with, for example, 1,024 items that you iterate right after that and then calls fillRect() 300 times. This all is processed in 60 fps.
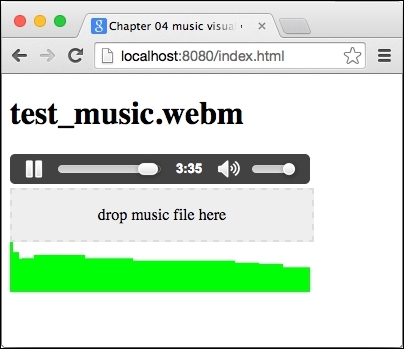
The final app could look like this with a little CSS: