
The Dart SDK comes with a profiling tool since version 1.4. It's still in development, so we're going to look at just the basic things. Observatory has a comfortable browser GUI that makes it easy to use for everyone. You're probably not going to spend much time profiling your apps unless you're working with large amounts of data or in a field where performance matters a lot (such as games). However, it's good to know that there's such tool and it's built right inside Dart's VM.
You can run the profiler for both the standalone Dart VM and web apps, but we'll take a look only at the standalone Dart VM, because we can easily run it from Dart Editor.
For this example, we'll reuse the fuzzy search code from Chapter 2, Practical Dart, and create a test CLI app that runs a few search queries:
import 'dart:io';
import 'dart:convert';
import '../../Chapter_02_doc_search/lib/FuzzySearch.dart';

main() {
  FuzzySearch fuzzy;

  void testSearch() {
    List testTerms = ['strpl','myslcom','imsz','png2w','arrdf'];
    testTerms.forEach((String term) {
      List results = fuzzy.search(term);
    });

    print(testTerms); // PLACE A BREAKPOINT HERE
  }

  // Load json file with our dictionary.
  var f = new File('../../Chapter_02_doc_search/web/dict.json'),
  f.readAsString().then((text) {
    Map<String, dynamic> dict = JSON.decode(text);
    fuzzy = new FuzzySearch(dict.keys.toList());
    testSearch();
  });
}
This code runs our fuzzy search algorithm for five test terms. We're not interested in what it returns; we'll just use this code to see the Observatory profiler. Of course, we can profile apps on the run (like the WebSocket server that we made in the previous chapter), but it's probably more common to analyze just a small part of your app or maybe a single algorithm. Note that Observatory is part of the Dart VM and therefore, if you want to access it in the browser, the Dart VM has to be running. You can't run the profiler and analyze results later (which is the most common usage of profilers in languages such as PHP or Python).
Place a breakpoint at line 14 to make the Dart VM pause there. Now, run the app and watch the console window in Dart Editor. You should see something like this:
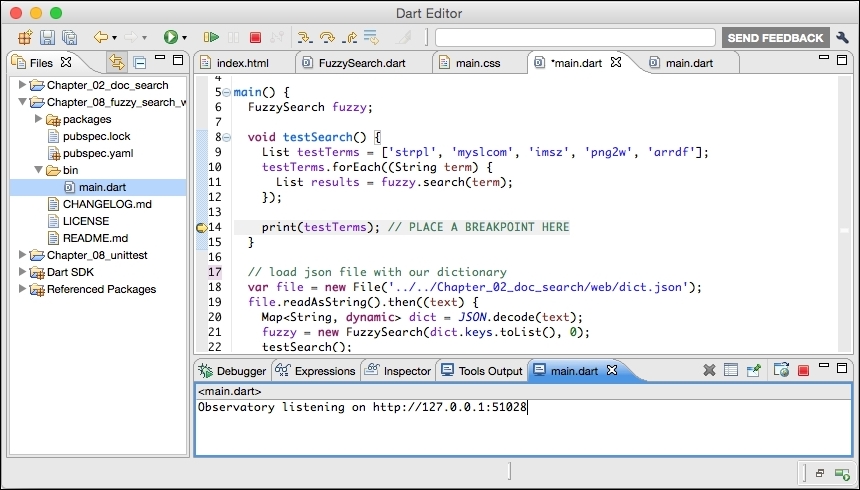
It says that the Observatory is running on port 51028. The port number is not fixed, so you'll probably have a different one. Open this URL in a browser, and you'll see the GUI (it can be any browser, not just Dartium):
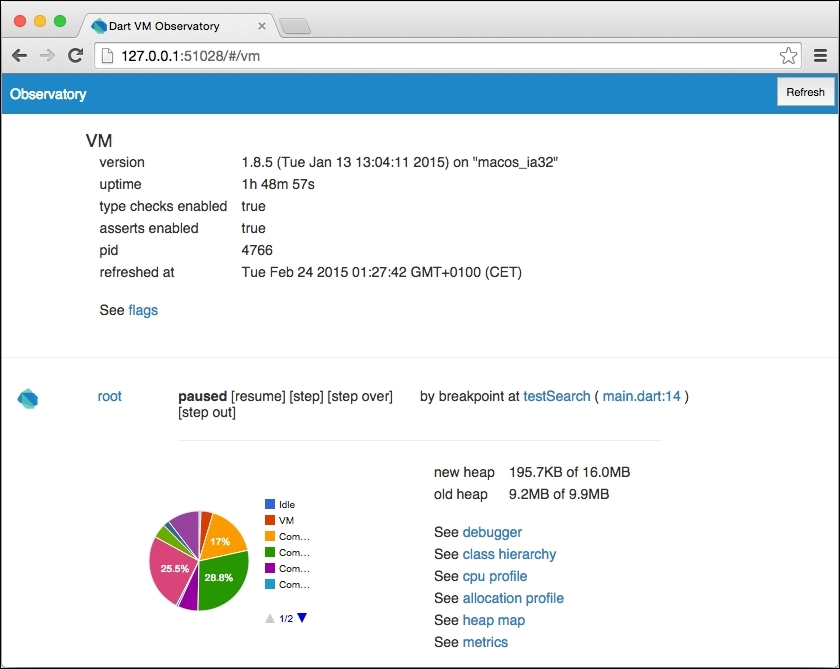
This is a lot of information; don't worry if you don't understand what it means. Just out of curiosity, click on cpu profile in the bottom-right list. Then, select User in Tag Order select box, and try to find out how much time our FuzzySearch.search() method took. It'll probably be very little—about 3 percent of the total VM's running time.
This was just a sneak peak of what Observatory is, and as we said previously, it's not stable yet and it'll change in the future. As you can see, the information that our method took 3 percent isn't very helpful because we would like to know what exactly took the most time in order to optimize it, so this is probably one of those things where Observatory will improve in newer versions.
One of the already useful features of Observatory is code coverage, which you can access from the main screen by clicking the filename. You can see code coverage for each file used by the Dart VM.
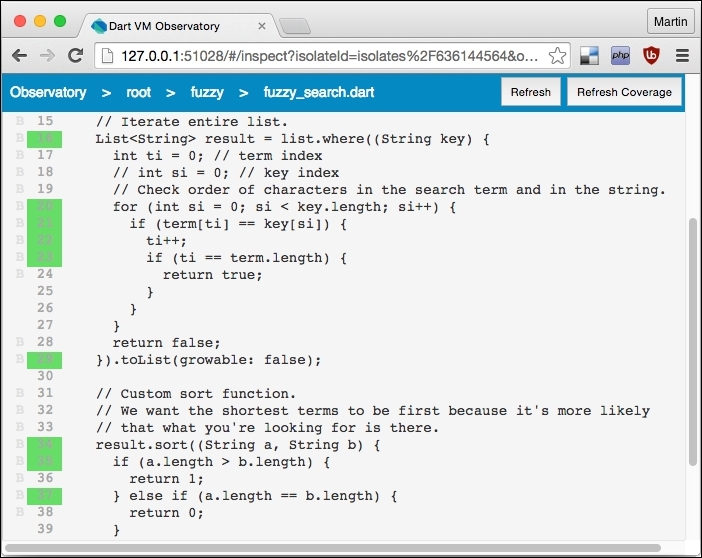
All the line numbers in the green background were already executed until now.