
Monitoring servers is always a controversial subject. It usually falls under system administration, and software engineers don't even go near it, but we are losing one of the huge benefits of monitoring: the ability to react quickly to failures. By monitoring our system very closely, we can be aware of problems almost immediately so that the actions to correct the problem may even save us from impacting the customers. Along with monitoring, there is the concept of performance. By knowing how our system behaves during load periods, we will be able to anticipate the necessity of scaling the system. In this chapter, we will discuss how to monitor servers, and specifically microservices, in order to maintain the stability of our system.
In this chapter, we will cover the following topics:
- Monitoring services
- Monitoring using PM2 and Keymetrics
- Monitoring metrics
- Simian Army – the active monitoring from Spotify
- Throughput and performance degradation
When monitoring a microservice, we are interested in a few different types of metrics. The first big group of metrics is the hardware resources, which are described as follows:
The second big group is the application metrics, as follows:
- Number of errors per time unit
- Number of calls per time unit
- Response time
Even though both groups are connected and a problem in the hardware will impact the application performance (and the other way around), knowing all of them is a must.
Hardware metrics are easy to query if our server is a Linux machine. On Linux, all the magic of hardware resources happens in the /proc folder. This folder is maintained by the kernel of the system and contains files about how the system behaves regarding a number of aspects in the system.
Software metrics are harder to collect and we are going to use Keymetrics from the creators of PM2 to monitor our Node.js applications.
PM2, as we've seen before, is a very powerful instrument to run Node applications, but it is also very good at monitoring standalone applications in production servers. However, depending on your business case, it is not always easy to get access to the production.
The creators of PM2 have solved this problem by creating Keymetrics. Keymetrics is a Software as a service (SaaS) component that allows PM2 to send monitoring data across the network to its website, as shown in the following image (as found at https://keymetrics.io/):

Even though Keymetrics is not free, it provides a free tier to demonstrate how it works. We are going to use it in this chapter.
The very first thing that we need to do is register a user. Once we get access to our account, we should see something similar to the following screen:

This screen is asking us to create a bucket. Keymetrics uses the bucket concept to define a context. For example, if our organization has different areas (payments, customer service, and so on) with different servers on each area, we could monitor all the servers in one bucket. There are no restrictions on how many servers you can have in one bucket. It is even possible to have all the organization in the same bucket so that everything is easy to access.
Let's create a bucket called Monitoring Test, as shown in the following image:

Easy, once we tap on Create Bucket, Keymetrics will show us a screen with the information needed to start monitoring our app, as shown in the following image:

As you can see, the screen displays information about the private key used by Keymetrics. Usually, it is a very bad idea to share this key with anyone.
As shown on the screen, the next step is to configure PM2 to push data into Keymetrics. There is also useful information about the networking needed to make Keymetrics work:
- PM2 will be pushing data to the port 80 on Keymetrics
- Keymetrics will be pushing data back to us on the port 43554
Usually, in large organizations, there are restrictions about the networking, but if you are testing this from home, everything should work straightaway.
In order to make PM2 able to send metrics to Keymetrics, we need to install one PM2 module called pm2-server-monit. This is a fairly easy task:
pm2 install pm2-server-monit
This will result in an output similar to the following:

Let's run the advised command:
pm2 link fan7p32fnysuuw8 znlz25frrcwakg6 my-server
In this case, I have replaced [server name] with my-server. There are no restrictions on the server name; however, when rolling out Keymetrics into a real system, it is recommended to choose a descriptive name in order to easily identify the server in the dashboard.
The preceding command will produce an output similar to the following image:

This is an indication that everything went well and our application is ready to be monitored from Keymetrics that can be checked on https://app.keymetrics.io/, as follows:

Now, our server is showing up in the interface. As we previously stated, this bucket could monitor different servers. A simple virtual machine is created, and as you can see at the bottom of the screen, Keymetrics provides us with the command to be executed in order to add another server. In this case, as we are using the free access to Keymetrics, so we can only monitor one server.
Let's see what Keymetrics can offer us. At first sight, we can see interesting metrics such as CPU usage, memory available, disk available, and so on.
All these are hardware metrics that indicate how our system is behaving. Under pressure, they are the perfect indicator to point out the need for more hardware resources.
Usually, the hardware resources are the main indicator of failure in an application. Now, we are going to see how to use Keymetrics to diagnose the problem.
A memory leak is usually a difficult problem to solve due to the nature of the flaw. Take a look at the following code.
Let's run the program using a simple seneca.act() action:
var seneca = require('seneca')();

var names = [];

seneca.add({cmd: 'memory-leak'}, function(args, done){
  names.push(args.name);
  greetings = "Hello " + args.name;
  done(null ,{result: greetings});
});

seneca.act({cmd: 'memory-leak', name: 'David'}, function(err, response) {
  console.log(response);
});
This program has a very obvious memory leak, and by obvious, I mean that it is written to be obvious. The names array will keep growing indefinitely. In the preceding example, it is not a big deal due to the fact that our application is a script that will start and finish without keeping the state in memory.
The problem comes when someone else reutilizes our code in a different part of the application.
Let's assume that our system grows to a point that we need a microservice to greet new customers (or deliver the initial payload of personal information such as name, preferences, configuration, and so on). The following code could be a good example on how to build it:
var seneca = require('seneca')();

var names = [];

seneca.add({cmd: 'memory-leak'}, function(args, done){
  names.push(args.name);
  greetings = "Hello " + args.name;
  done(null ,{result: greetings});
});

seneca.listen(null, {port: 8080});
In this example, Seneca will be listening over HTTP for requests from Seneca clients or other types of systems such as curl. When we run the application:
node index.js
2016-02-14T13:30:26.748Z szwj2mazorea/1455456626740/40489/- INFO hello Seneca/1.1.0/szwj2mazorea/1455456626740/40489/-
2016-02-14T13:30:27.003Z szwj2mazorea/1455456626740/40489/- INFO listen {port:8080}
Then from another terminal, we use curl to act as a client of our microservice, everything will work smoothly and our memory leak will go unnoticed:
curl -d '{"cmd": "memory-leak", "name":"David"}' http://127.0.0.1:8080/act
{"result":"Hello David"}%
However, we are going to use Keymetrics to find the problem. The first thing we need to do is run our program using PM2. In order to do it so, we run the following command:
pm2 start index.js
This command will produce the following output:

Let's explain the output in the following:
- The first line gives us information about the integration with Keymetrics. Data such as public key, server name, and the URL to access Keymetrics.
- In the first table, we can see the name of the application running, as well as few statistics on memory, uptime, CPU, and so on.
- In the second table, we can see the information relevant to the
pm2-server-monitPM2 module.
Now, let's go to Keymetrics and see what has happened:

The application is now registered in Keymetrics as it can be seen in the control panel
As you can see, now our application is showing up in Keymetrics.
Straightaway, we can see the very useful things about our app. One of these is the memory used. This is the metric that will indicate a memory leak, as it will keep growing.
Now, we are going to force the memory leak to cause a problem in our application. In this case, the only thing that we need to do is start our server (the small application that we wrote before) and issue a significant number of requests:
for i in {0..100000}
do
  curl -d '{"cmd": "memory-leak", "name":"David"}' http://127.0.0.1:8080/act
done
As simple as the small bash script, this is all it takes to open Pandora's Box in our application:
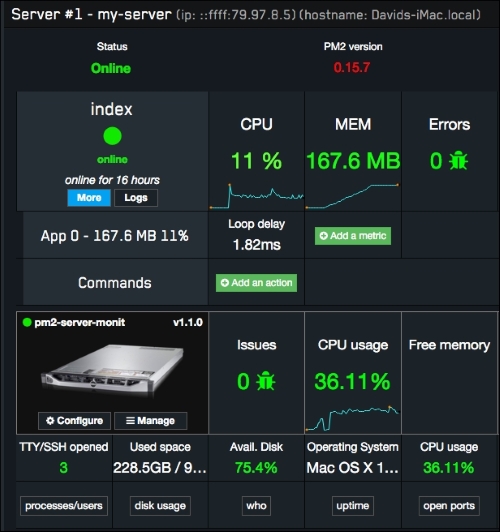
The application is now showing a high load (36% of CPU and an increased use of memory up to 167 MB)
The preceding image shows the impact of running the loop of requests in our system. Let's explain it in the following:
- The CPU in our application has gone to 11% with an average loop delay of 1.82 milliseconds. Regarding our system, the overall CPU utilization has gone up to 36.11% due to the fact that both the application and bash script use a significant amount of resources.
- The memory consumption has soared from 81.9 MB to 167.6 MB. As you can see, the line on the graph of memory allocation is not going straight up, and that is due to garbage collections. A garbage collection is an activity within the Node.js framework where unreferenced objects are freed from the memory, allowing our system to reuse the hardware resources.
- Regarding the errors, our application has been stable with 0 errors (we'll come back to this section later).
Now, once our bash script is finished (I stopped it manually, as it can take a significant amount of resources and time to finish), we can again see what happened to our system in the following screenshot:

We can see that the CPU has gone back to normal, but what about the memory? The memory consumed by our application hasn't been freed due to the fact that our program has a memory leak, and as long as our variable is referencing the memory consumed (remember the names array is accumulating more and more names), it won't be freed.
In this case, we have a very simple example that clearly shows where the memory leak is, but in complex applications, it is not always obvious. This error, in particular, could never show up as a problem due to the fact that we probably deploy new versions of our app often enough to not realize it.
Application errors are events that occur when our application can't handle an unexpected situation. Things such as dividing a number by zero or trying to access an undefined property of our application usually leads to these type of problems.
When working on a multithreaded framework (language) such as Tomcat, the fact that one of our threads dies due to an exception usually only affects to one customer (the one holding the thread). However, in Node.js, a bubbled exception could be a significant problem as our application dies.
PM2 and Seneca do a very good job at keeping it alive as PM2 will restart our app if something makes it stop, and Seneca won't let the application die if an exception occurs in one of the actions.
Keymetrics has developed a module called pmx that we can use to programmatically get alerts on errors:
var seneca = require('seneca')();

var pmx = require('pmx');

var names = [];

seneca.add({cmd: 'exception'}, function(args, done){
  pmx.notify(new Error("Unexpected Exception!"));

  done(null ,{result: 100/args.number});
});

seneca.listen({port: 8085});
It is easy and self-descriptive: an action that sends an exception to Keymetrics if the number sent as a parameter is zero. If we run it, we will get the following output:

Now we need to hit the server in order to cause the error. As we did earlier, we will do this using curl:
curl -d '{"cmd": "exception", "number": "0"}' http://localhost:8085/act
{"result":null}%
Now, when we go to Keymetrics, we can see that there is an error logged, as shown in the following image:

Another interesting point of Keymetrics is the configuration of alerts. As PM2 sends data about pretty much every metric in our system, we have the ability to configure Keymetrics on the thresholds that we consider healthy for our application.
This is very handy as we could get the notifications integrated in our corporate chat (something similar to Slack) and be alerted real time when something is not going correctly in our application.
Keymetrics also allows us to use probes. A probe is a custom metric that is sent programmatically by the application to Keymetrics.
There are different types of values that the native library from Keymetrics allows us to push directly. We are going to see the most useful ones.
A simple metric is, as its name indicates, a very basic metric where the developer can set the value to the data sent to Keymetrics:
var seneca = require('seneca')();
var pmx = require("pmx").init({
  http: true,
  errors: true,
  custom_probes: true,
  network: true,
  ports: true
});
var names = [];
var probe = pmx.probe();

var meter = probe.metric({
  name      : 'Last call'
});

seneca.add({cmd: 'last-call'}, function(args, done){
  console.log(meter);
  meter.set(new Date().toISOString());
  done(null, {result: "done!"});
});

seneca.listen({port: 8085});
In this case, the metric will send the time when the action was called for the last time to the Keymetrics:

The configuration for this metric is non-existent:
var probe = pmx.probe();

var meter = probe.metric({
  name      : 'Last call'
});
There is no complexity in this metric.
This metric is very useful to count how many times an event occurred:
var seneca = require('seneca')();
var pmx = require("pmx").init({
  http: true,
  errors: true,
  custom_probes: true,
  network: true,
  ports: true
});
var names = [];
var probe = pmx.probe();

var counter = probe.counter({
  name : 'Number of calls'
});

seneca.add({cmd: 'counter'}, function(args, done){
  counter.inc();
  done(null, {result: "done!"});
});

seneca.listen({port: 8085});
In the preceding code, we can see how the counter is incremented for every single call to the action counter.
This metric will also allow us to decrement the value calling the dec() method on the counter:
counter.dec();
This metric allows us to record when an event occurs, and it will automatically calculate the number of events per time unit. It is quite useful to calculate averages and is a good tool to measure the load in the system. Let's see a simple example, as follows:
var seneca = require('seneca')();
var pmx = require("pmx").init({
  http: true,
  errors: true,
  custom_probes: true,
  network: true,
  ports: true
});
var names = [];
var probe = pmx.probe();

var meter = probe.meter({
  name      : 'Calls per minute',
  samples   : 60,
  timeframe : 3600
});

seneca.add({cmd: 'calls-minute'}, function(args, done){
  meter.mark();
  done(null, {result: "done!"});
});

seneca.listen({port: 8085});
The preceding code creates a probe and sends a new metric called Calls per minute to Keymetrics.
Now, if we run the application and the following command a few times, the metric is shown in the following Keymetrics interface:
curl -d '{"cmd": "calls-minute"}' http://localhost:8085/act

As you can see, there is a new metric called Calls per minute in the UI. The key to configure this metric is in the following initialization:
var meter = probe.meter({
  name      : 'Calls per minute',
  samples   : 60,
  timeframe : 3600
});
As you can see, the name of the metric is in the configuration dictionary as well as in two parameters: samples and timeframe.
The samples parameter correspond to the interval where we want to rate the metric; in this case, it is the number of calls per minute so that rate is 60 seconds.
The timeframe parameter, on the other hand, is for how long we want Keymetrics to hold the data for, or to express in simpler words, it is the timeframe over which the metric will be analyzed.