Long-time radio commentator Paul Harvey is credited with saying, "In times like these, it helps to recall that there have always been times like these." Although a little on the folksy side, Mr. Harvey does a pretty good job of hitting the nail on the head. Business, the economy, and the markets move in cycles, not in straight lines.
Investor sentiment is subject to cycles as well. When all is well in the financial world, no amount of bad news can drag the markets down. When sentiment falls, no amount of good news can move the markets higher. Intellectually, experienced investors should understand this. Emotional extremes are part of the natural order and thus are necessary, but they are also short-lived.
Cycles have a rhythm and a pattern, much like the seasons: Winter follows fall and spring follows winter, and so forth. In similar fashion, recessions follow boom times and bull markets lead into bear markets. Through it all, the world keeps spinning on its axis.
According to the Dividend-Yield Theory, just as dividend-yield extremes represent historically repetitive areas of undervalue and overvalue in individual stocks, so, too, are there dividend-yield extremes that represent historically repetitive areas of undervalue and overvalue in the stock market.
Indeed, both the Dow Jones Industrial and Utility Averages have long established Profiles of Value, which can provide investors with invaluable information about the level of value that is present or absent in these widely followed proxies for the broad markets at any given time.
Investors who understand these cyclical patterns of dividend yield and know how to measure whether the cycle is in the early stage and offers good current value, or if the cycle is in the later stages where most of the value has been realized, have a greater probability for maximizing their real total return and minimizing their potential downside risk.
Maximizing return and minimizing risk are key for the investor whose primary investment goal is to build a pool of capital and growing income stream from that capital sufficient to fund their or someone else's cash needs.
Volumes of books can be written about cycles because they can be observed in infinite ways. Time and space prohibit a lengthy recitation of the myriad examples, but most readers will be familiar with cyclical patterns we observe without a second thought: in agriculture, the weather, the seasons, history, politics, sports, and, of course, in human life. Some cycles are hard-wired by nature. Others are the result of the collective thoughts and actions of billions of people.
One of the central postulates of the Dividend-Yield Theory is that there is a cyclical aspect to dividend-yield patterns. Indeed, decades of stock market research has produced strong evidence that high quality stocks with long histories of dividends and rising dividend trends generally fluctuate between repetitive extremes of high dividend yield and low dividend yield. The nexus for these fluctuations is the cyclical ebb and flow of the stock market, which is the result of market participants anticipating or reacting to news and information from the worlds of economics and politics.
Fundamental to the dividend-value strategy is that these recurring themes of yield can be used to establish envelopes of undervalued (low) and overvalued (high) price levels.
These lows and highs, which represent the bottoms and tops of cycles, are identified by simply charting the dividend yield over a sufficient period of time for the dividend-yield pattern to emerge. By calculating the repetitive dividend-yield areas where a stock or index turns down, or reverses a slide and turns up, the future behavior of that stock or index can be anticipated.
Once a dividend-yield pattern is established, the pattern tends to remain constant unless an exogenous event compels market participants to establish new parameters of undervalue and overvalue of dividend yield.
When a dividend is raised, undervalue and overvalue price limits will automatically adjust higher to maintain the historically established yield percentages. In general, the stock price will adjust accordingly to reflect the increased value as the result of the dividend increase.
The dividend-yield cycles are established by the market, which can be explained by the most basic of economic principles of the supply-and-demand theory as taught in Economics 101. When a high-quality, dividend-paying stock declines in price to the point where the dividend-yield is historically high, experienced investors with substantial amounts of capital earmarked for opportunities that represent good value begin to accumulate a position. This accumulative buying halts the decline, stabilizes the price, and begins to reverse the trend. When a price reversal in a stock becomes apparent, other investors initiate purchases and the price begins to rise.
Once a rising trend has been established and appears to have legs, less disciplined investors will begin to take positions in the stock. Almost simultaneously, investors who purchased the stock at undervalued prices become increasingly inclined to secure their profits by selling. By the time the price reaches its historic level of overvalue, the yield is no longer attractive enough to compel sufficient numbers of new buyers to take positions in the stock.
As soon as the early buyers become sellers and new buying interest evaporates, the price will begin to decline. Once a declining price trend becomes evident, the remaining stockholders will move to salvage what they can of any profits and their original principal. This wave of selling will continue until a historically high dividend yield again attracts enough new investors to halt the decline. There, at undervalue, the long-term investment cycle appears all over again.
To summarize this point before we move ahead: It can be observed that dividend-paying stocks fluctuate over time within a range of low dividend yield—establishing a peak of overvalue—and high dividend yield—establishing a valley of undervalue. The peaks and valleys identify areas in which stocks should be bought or sold.
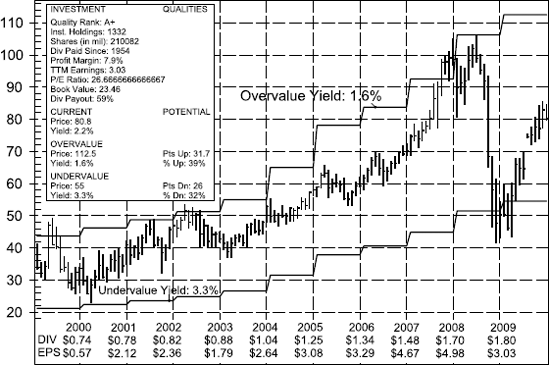
Each stock has a unique profile of undervalue and overvalue; that is, distinctive high- and low-yield characteristics, as shown in Figure 6.1. Because no two profiles are identical, each stock must be studied on an individual basis, so in addition to producing income, dividend yield can also be used as a tool to identify value in the stock market.
Depending on the primary trend of the market and economy, the average length of time for a stock to rise from undervalue to overvalue has fluctuated between three years and five and three quarters years. Some stocks cycle at a faster pace. Other stocks, especially those with frequent dividend increases, have a long upward climb and may be held longer before a sale at overvalue is necessary. In general, the amount of time required to cycle down from overvalue, through the declining trend and back to undervalue, is two years.
There are moments in every market cycle when investors question whether it is a bull market, a bear market, or a sideways trading range. A 200-point drop could just as easily be a correction in a bull market, the first break in a bear market, or the low point of the range in a sideways market. In hindsight we all have 20-20 vision, which provides little comfort at the moment clarity is most critical.
Although no one likes uncertainty, this is particularly true for investors. Benjamin Grahamhas said, "Individuals who cannot master their emotions are ill-suited to profit from the investment process." This is especially poignant during periods of extreme market volatility when emotions are running high, because investors will often make decisions that can undermine their ability to build long-term wealth.
Throughout investment history, pearls of wisdom about the proper course of action for investors during times of market uncertainty have come from figures such as John D. Rockefeller and his now famous exhortation to "buy when the blood is running in the streets." Even the Oracle of Omaha, Warren Buffett, has weighed in with, "Be fearful when others are greedy. Be greedy when others are fearful."
The quotes from Rockefeller and Buffett may represent sound contrarian philosophy and appear simple enough, but what qualified as "blood in the streets" to John D. and "fearful and greedy" to Brother Buffett may be subject to interpretation.
When your goal is to maximize real total return and minimize risk, it may prove more prudent to leave subjective measures of analysis to the more intrepid. Instead focus on objective measures of analysis that have provided clear indications of value over significant periods of time. For this we look again to the Dividend-Yield Theory, which, when applied to the Dow Jones Industrial Average (DJIA), has provided strong and reliable signals over the last 80-plus years.
Just as repetitive areas of good value can be established by dividend yield for individual stocks, optimum buying and selling areas have also been established for the DJIA based on its composite dividend. In Figure 6.2 there are seven charts (a–g) that provide a technical portrait of fundamental value as expressed by dividend yield extending back to 1949.
For readers who are not proficient in using charts, here are some useful tips to help you understand the information that is displayed: The vertical axis on the far left edge of the chart displays price; the horizontal axis along the bottom of the chart displays time. Because this is a monthly chart, each of the vertical lines within the chart area represents one month. The top of the line is the high price for the period, the bottom of the line is the low price for the period, and the hash mark to the right is the closing price of the period.
As discussed previously, every stock has a unique profile of undervalue and overvalue dividend yield. In the case of the DJIA, there are four distinct areas: one that represents overvalue and three that represent undervalue. Unique to the Investment Quality Trends charts are horizontal lines that represent the price levels at which specific areas of dividend yield are reached. When the dividend is increased, the line will move up to display the price for that specific level of dividend yield.
When the dividend is decreased, the line will move down to reflect the price for that specific level of dividend yield. What these charts illustrate is that four specific areas of dividend yield have a repetitive pattern: 3.0 percent at overvalue; 4.0 percent, 5.0 percent, and 6.0 percent at undervalue. Historically, the DJIA has offered good value whenever the dividend yield has risen to 6.0 percent, as it did in 1949–1953, 1974, and in 1978–1982. Strong price support also has been evidenced at the 4.0 percent yield level, which halted and reversed declines in 1960, 1962, 1966, 1971, and, most notably, on October 19, 1987.
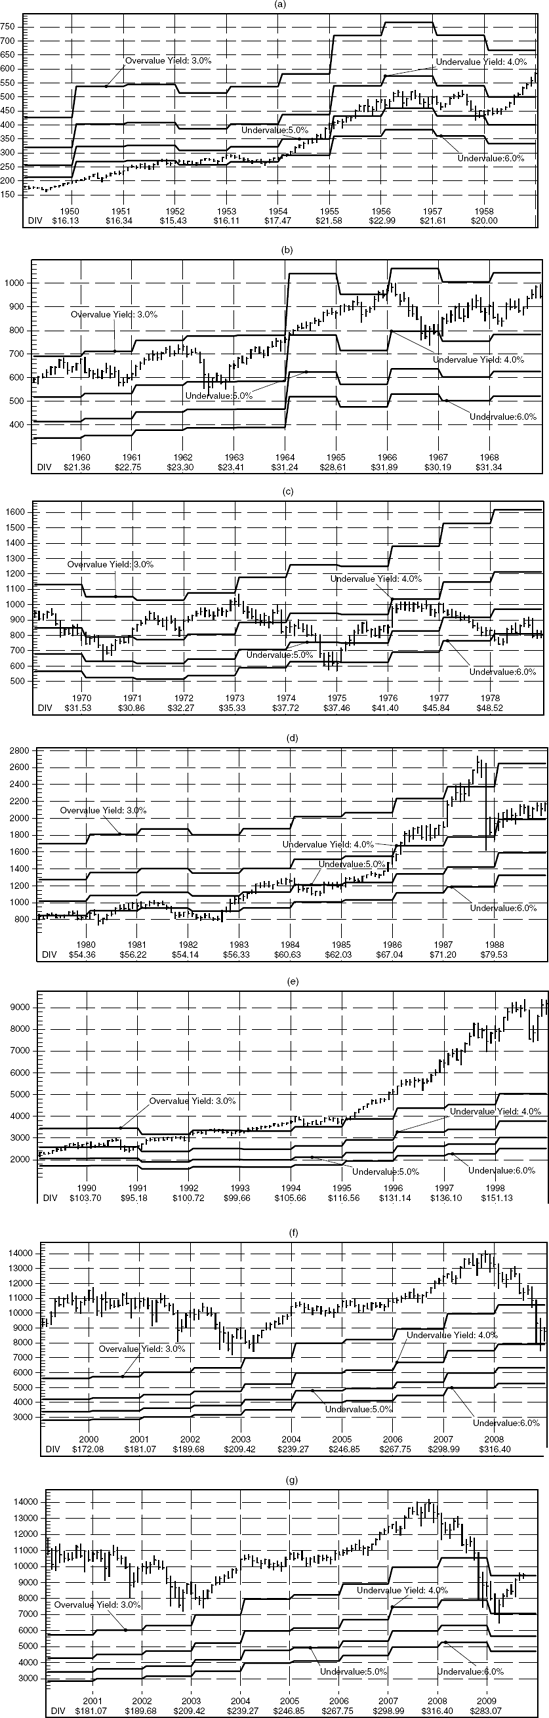
A 5.0 percent yield halted and reversed a major decline in 1970. More recently, the DJIA came within 10 basis points (10 one hundredths of 1 percent) of the 5.0 percent yield level on an intraday basis on March 9, 2009. Note that in the last chart (g), the line representing the month of March, 2009 does not accurately display just how close the dividend yield came to the 5.0 percent level. The reason for this is that the dividend for the DJIA has declined since March, which has lowered the price at which a 5.0 percent dividend yield would be realized.
With the exception of the period between 1995 and 2007 (which we will examine separately in Chapter 8), when the Dow reaches a 3.0 percent yield a Rising Trend has been reversed. This occurred in 1950, 1961, 1966, 1968, 1973, 1987, and 1990. If we were to produce a chart beginning in 1929, it would also illustrate that the dividend yield declined to just beneath the 3.0 percent level prior to the Great Crash.
So we see that all four yield areas have a significant history. With the exception of the period between 1995 and 2007, which we believe former Fed Chairman Alan Greenspan accurately identified as a time of "Irrational Exuberance," did a 3.0 percent yield fail to signal the approach of a serious market decline. When the DJIA was priced to yield 6.0 percent or more, the market offered a profitable buying opportunity.
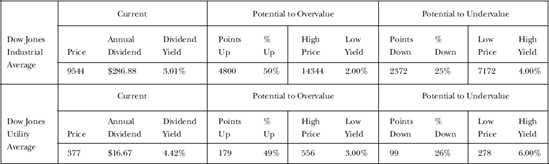
Just as undervalue and overvalue levels can be established for the DJIA, so, too, can they be set for the Dow Jones Utility Average (DJUA). Figure 6.3 shows the measures of the market, a feature on the front cover of every issue of Investment Quality Trends that tracks the undervalue and overvalue parameters for the DJIA and the DJUA. Note that the profile for the DJUA follows that of the DJIA closely: overvalue at a 3.0 percent dividend yield and undervalue at a 6.0 percent dividend yield.[1] More on these dividends and these industry groups can be found in Chapter 8.
Since the dawn of stock-market analysis, investors have searched for the one indicator that is perfect in its predictive capabilities. Although it is titillating to entertain such a notion, if such an indicator were to exist, it would eventually destroy the markets because all risk would be removed for practitioners and they would eventually own everything.
Even when investors are successful at identifying the primary trend of the market, there are stocks that rise during bear markets as well as stocks that decline during bull markets. All things being equal, I would rather know the direction of the primary trend at not, but market indicators can only tell you what the current temperature of the market is, not where to find good current value. The truth of the matter is there is the stock market and there is the market of stocks, which are two entirely different things.
We have reached that understanding after having observed our market of stocks, the Select Blue Chips, over the course of the last 40-plus years. As a result of these observations, we have developed another cyclical indicator, which measures what is always most important—values.
Our universe of Select Blue Chips is grouped into four distinct categories: Undervalued, Rising Trends, Overvalued, and, Declining Trends as shown in Figure 6.4.
The Undervalued category consists of stocks that represent historically repetitive extremes of low-price and high dividend-yield.

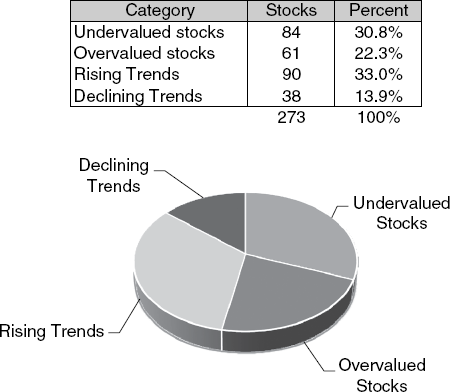
The Rising-Trend category consists of stocks whose stock price have risen at least 10 percent from its Undervalued base. The Overvalued category consists of stocks that have reached historically repetitive extremes of high price and low dividend yield. The Declining-Trend category consists of stocks whose stock price has declined at least 10 percent from its overvalued peak.
Twice each month, we calculate how many stocks are in each category and what percent that number is of the total. For over 40 years, we have tracked each category in the Investment Quality Trends "Blue-Chip Trend Verifier" as shown in Figure 6.5.
By tracking the movements between categories and comparing those movements against the highs and lows on the DJIA, we have established that whenever the percentage of stocks in the Undervalued category rises between 70 percent and 80 percent of the total, it has been coincident with a low cycle in the DJIA and many good buying opportunities. In contrast, when the percentage of stocks in the Undervalued category declines to 17 percent or less, it has been coincident with a high cycle in the DJIA, which indicates the market is Overvalued and susceptible to a major market decline.
By example, in early 1973 the DJIA eclipsed the high price established in 1966 and 1969, which many investors believed signaled the beginning of a new bull market. What many failed to take into consideration however, was that the new high was reached at the 3.0 percent dividend-yield level, which you now know represents the historically repetitive area of overvalue dividend-yield. At the same time the "Blue-Chip Trend Verifier" in the first January 1973 edition indicated there were just 17 percent of the Select Blue Chips in the Undervalued category. Shortly thereafter, the rally failed and the market declined until the bear market bottom was recorded in December 1974.
Now contrast the statistics just mentioned to January 1975. In the First-January 1975 issue, the measures of the market indicate that the dividend yield for the DJIA was 6.1 percent and the percentage of Select Blue Chips in the Undervalued category reached 80 percent. Obviously, this was a spectacular buying opportunity.
In the spring of 1987, stocks in the Undervalued category represented only 12 percent of our total universe. The dividend yield? You guessed it. Not only did it reach the 3.0 percent, overvalue area but shot through it to boot. At that juncture it was obvious the market was extremely overvalued on an historical basis. This situation was corrected thoroughly on October 19, when the DJIA registered its largest percentage drop ever in a single day.
A more contemporary example can be found in January 2000, when the DJIA peaked just below the 12,000 level. In the First- January 2000 issue, we find that only 13 percent of our Select Blue Chips were in the Undervalued category. The market slide that ensued did not end until October, 2002. Interestingly, even though the market decline was halted, in the First-November 2002 issue we find that only 16 percent of our stocks were in the Undervalued category, a clear indication that the bear market was far from over and a harbinger of what was to come five years later.
In Chapter 8, we address cycles, indicators, and value in the market further because there are some important issues between 1995 and 2007 that must be addressed. At this juncture, however, we have learned the value of being able to identify both dividend-yield cycles and undervalue/overvalue cycles.
Knowing these cycles exist and having the means to measure them will be a tremendous help in achieving your long-term investment goals. A word of caution before we close, however; don't lose sight of the forest because of the trees. That is, don't get so caught up in following the stock market that you lose focus of the market of stocks.