In this chapter, you will:
Discover what’s new and improved for working with graphics in Word
Learn how to determine when Word is the best program for the graphic task
Understand differences for working with pictures and objects
Simplify graphic layout
Get tips for working with Publishing Layout view in Word for Mac 2011
If you’ve read my earlier books or other content I’ve written about working with graphics in Microsoft Word, some recommendations in this chapter might come as a surprise. For years, I consistently recommended creating all graphics in other programs and pasting them into your Word documents as pictures for ease of use and ease of editing. Well, there might still be cases when you want to do that (such as when you don’t want recipients of the document to be able to edit graphics or access chart data). But Microsoft Word 2010 and Word for Mac 2011 have fully embraced the impressive graphics engine that was new in Office 2007 and Office 2008 for Mac, so best practice rules are finally changing (well, a few of them anyway).
Need a diagram? SmartArt graphics in Word have almost the same functionality that they have in PowerPoint. Need a chart? Excel charts created directly in Word have virtually the same functionality as they do in Excel. Need a simple graphic made out of shapes? Word now has the same shapes and most of the same shape formatting capabilities as in PowerPoint (and Excel).
Whether you need pictures, charts, diagrams, or text boxes, graphics are an important part of most complex documents you create in Word. So if you now can create many of the graphics you need directly in Word, why isn’t this chapter about creating graphics? Creating charts, SmartArt graphics, working with shapes, and formatting pictures are covered in other chapters, so the space in this chapter is best spent on Word-specific topics, such as understanding picture types and simplifying layout.
Meanwhile, this chapter will give you everything you need to know to easily and effectively manage graphic objects in Word 2010 and Word 2011—including recommendations on when your best bet is still to create that art in another program. Getting exactly the graphic you need, exactly where you need it, can be much easier than you might think.
Note
See Also For help creating SmartArt diagrams, working with shapes, and formatting pictures, see Chapter 14. For help creating Excel charts, see Chapter 20.
When the current Microsoft Office graphics engine (also known as Office Art) was first introduced in Office 2007 and Office 2008 for Mac, you saw SmartArt graphics and Excel charts natively available in Word. You also saw new picture styles with formatting such as high-quality bevels and reflections. But the graphic capabilities in Word lagged behind PowerPoint and Excel in other ways—including working with shapes, drawing tools, and WordArt.
Word 2010 and Word 2011 now incorporate the full graphics engine. So, many features that were new in the previous version for PowerPoint and Excel are now new in Word. For example, you can now select a shape and just start typing to add text, or edit points on it to create your own custom shape. Additionally, you get the more advanced formatting effects for shapes that you might know from working with pictures in the previous version. Entries in the Shape Styles gallery now coordinate with theme effects similar to the way SmartArt styles and chart styles do. So, you get a wider array of shapes, more flexible drawing tools, and consistent graphic formatting tools across your Word, PowerPoint, and Excel content.
In addition, Word incorporates a number of graphics features that are new and improved across Word, PowerPoint, and Excel in this version.
Picture formatting tools are greatly improved. In fact, one of the best improvements in any area of content creation is the picture cropping functionality, which now enables you to see your entire image in shadow while you crop (among other benefits). You also have a range of advanced picture formatting tools, including improved correction and color management, a flexible set of artistic effects, and a new Remove Background feature.
SmartArt graphics are improved as well. Not all of these improvements are available to Word (such as the ability to convert SmartArt graphics to shapes, which was actually introduced to PowerPoint and Excel in a service pack release for Office 2007), but it does offer some nice new benefits for this feature. For example, you can convert selected images in a document to a SmartArt diagram. You’ll also find several more layouts for organization charts and picture diagrams, among others.
The WordArt capabilities that were new to PowerPoint and Excel in the previous version are now available in Word. That means more flexible and realistic formatting effects for text—consistent with the formatting effects available to shapes and images—and no more embedded objects for WordArt. So, you can now even include WordArt formatting (also called text effects in Word 2010 and Word 2011) in paragraph and character styles.
Another great new Word feature is exclusive to Office 2010. You can now use the slide background styles from the active theme as the fill for shapes. This feature was new to PowerPoint and Excel in Office 2007 but has now come to Word. So, for example, you can use a shape as a background for your document and fill it with a slide background style to coordinate it more completely with your own branding or with the look of other documents and presentations for a given project.
It’s also worth noting for Word 2011 users that much of your work with graphics is likely to be easier with the new Ribbon. Word 2010 users had this new experience in the previous version, when you first had the Ribbon and automatically saw contextual tabs for working with whatever type of object you selected. Now Mac users have a similar experience with the introduction of the Ribbon in Office for Mac 2011. The contextual tabs that appear when you select a graphic—as well as the standard tabs for SmartArt and charts in Word 2011—give you quick access to virtually everything you need for working with graphics.
Additionally, advanced users of both Word 2010 and Word 2011 may want to consider taking advantage of the file formats that were first introduced in the previous versions of Microsoft Office. You might be amazed at how easy it is to use the Office Open XML underlying your documents to get even more graphic formatting flexibility and to save time (for example, for direct access to the image files of pictures that appear in your documents).
Note
See Also To learn about how to work with the different types of graphics and tools discussed here, see the following:
To learn about the new, uniquely Mac Ribbon interface available across Office 2011 as well as improvements to the Ribbon across Office 2010, see Chapter 1.
To learn about the new text effects (WordArt), see Chapter 7.
For help creating SmartArt graphics as well as working with shapes and the Microsoft Office drawing tools, see Chapter 14.
For help creating Excel charts, see Chapter 20.
To learn how to fill a shape with a slide background style from the active theme, see the sidebar Use Shapes As Page Backgrounds, later in this chapter.
Note
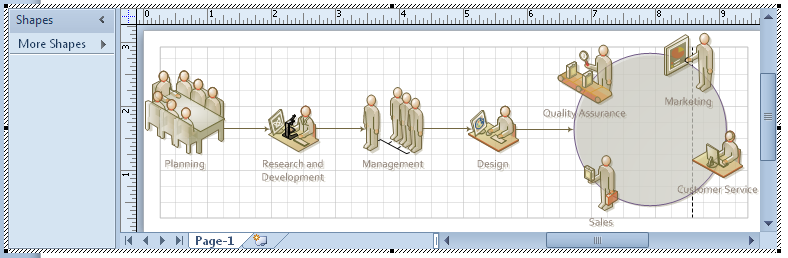
Companion Content To learn about key basics for working with Microsoft Visio 2010 and using Excel and Visio together to create dynamic, data-based diagrams, see “Visualizing Data with Excel and Visio”, in the Bonus Content folder available as part of the companion content for this book, at http://oreilly.com/catalog/9780735651999.
To learn the basics of how to interact with Office Open XML and to get resources for taking those basics further with the graphics in your documents, see Chapter 24.
To learn everything else you need to know for managing graphics in Word, read on.
Yes, you can go ahead and create an Excel chart, SmartArt diagram, or simple shape drawing directly in your Word document. Don’t be afraid. Although Word is still not the best choice for creating the graphics in your document in every case, most of that is not a reflection on Word—it’s a matter of how and what you choose to share.
Depending upon what graphics you have in your document, pasting them into Word as pictures can help to minimize file size, make the document easier to manage, and help ensure that they appear correctly on recipients’ computers. You’re more likely to help simplify documents in this way if your graphics would otherwise be embedded objects (such as for Microsoft Visio diagrams), or complex drawings rather than Office Art graphics like SmartArt diagrams and charts.
The original, live graphic isn’t editable when pasted as a picture. So, when you paste your graphic into Word as a picture, you can be confident that your chart or diagram content will remain intact, regardless of where your document goes.
If you’re concerned about other editors damaging the graphics in the shared copy of your documents and not whether they would share an altered version, collaborating on the document using Office Web Apps is an excellent solution for this, as well as for potential issues that can arise when sharing documents with users of earlier versions.
Note
See Also For more information about sharing documents with users of earlier versions and how Office Web Apps can help you simplify that task, see the sidebar that follows this list, What Happens If I Use Word 2010 or Word 2011 Graphics in Legacy File Format Documents?
Pasting as a picture can also help protect sensitive information. For example, just because you want to share a certain chart with recipients of your document doesn’t mean you want them to have access to the source data.
Sharing on the web would not be an alternate solution in this case because, even though recipients could not access the source data for graphics such as Excel charts in Word Web App, they could download the document from the Microsoft SharePoint 2010 or Windows Live SkyDrive site where you host it.
Some graphics—such as complex drawings—can be difficult for Word to handle and can negatively affect document performance. This doesn’t apply to SmartArt graphics, charts, or pictures. But the reason this book repeatedly specifies simple drawings when you’re using shapes and the drawing tools in Word is that complex drawings can weigh down your documents. Just because Word now has most of the same drawing tools as PowerPoint doesn’t mean it’s always as good a choice as PowerPoint (or, for that matter, graphics applications such as Adobe Illustrator or Adobe Photoshop when you really need complex graphic design elements). Word 2010 and Print Layout view in Word 2011 don’t provide a layout environment that enables you to easily create and manage complex drawings. What’s more, PowerPoint has additional tools that make it easier to work with drawing objects, so why do more work than you have to do?
One of the best examples of this that I can share involved a stunning background design for a Word document that a designer had drawn by hand using the drawing tools in Word 2010. It was one of the most beautiful pieces of art I’ve seen created for a document in any program, and I was amazed that it was even possible to do in Word (this is one talented artist). But just the drawing itself was approximately 9 megabytes (MB) in Word and selecting or editing any part of it was an incredibly slow process.
When adding graphics to documents or templates, you might be tempted to say that it doesn’t matter if editing the graphic is slow because you don’t want users to do that—they shouldn’t have to edit the graphic. But poor performance in a document is poor performance, period, and it can lead to other complications. What’s more, as every brand manager and template developer out there knows, you can’t completely control how people will use documents that you provide—no matter how you create them.
With this particular example, after the entire drawing was copied into PowerPoint, it was just 4 MB—less than half the size it was in Word. Although it was still pretty complex for PowerPoint, it was definitely usable, and the performance in PowerPoint was hardly slowed down at all.
So, what do you do if you want to use complex art as a design for a Word document, regardless of where you create that art? You might be able to place that graphic in Word as an image (or group of images) and use the improved Recolor feature available in Office 2010 and Office 2011 to still have it respond to theme color changes.
Note
See Also To learn about additional drawing tools (such as the new custom shape actions) that are exclusively available when you’re working with drawing objects in PowerPoint, see Chapter 14. In that chapter, you’ll also find help for using the improved Recolor feature with art that you paste as pictures into Word (or PowerPoint or Excel) to retain the ability to change colors with themes.
Note
The term objects as used here refers to graphic objects created directly in your document as well as to those embedded as objects from other programs.
The difference between an object and a picture is similar to the difference between your computer and a picture of your computer. A picture is an image of an object. Just as you can’t type or search the web using a picture of a computer, you can’t edit data in a picture of a chart—the picture has no attached source data.
The most common reason for creating graphics directly in Word, or pasting graphics from other programs (such as Visio 2010 for Windows users) as embedded objects, is to be able to edit those graphics right in your document. When it comes to the Office Art graphics that you can create directly in Word, those live objects also coordinate automatically with your active document theme.
Linking objects can also be useful—for example, when you want a chart to be linked to the source data in a separate Excel workbook that contains other data as well, or when you want to be able to edit that Visio object directly but don’t want to add the file size required by an embedded object.
But whether you are working with pictures or linked and embedded objects, there are important considerations and best practices to keep in mind.
When you paste most graphics from other Microsoft Office programs into Word using the default paste method, they remain editable graphics by default. You also get a paste SmartTag at the bottom-right corner of the pasted graphic (called Paste Live Preview options in Office 2010), providing different paste options that vary based on the type of content.
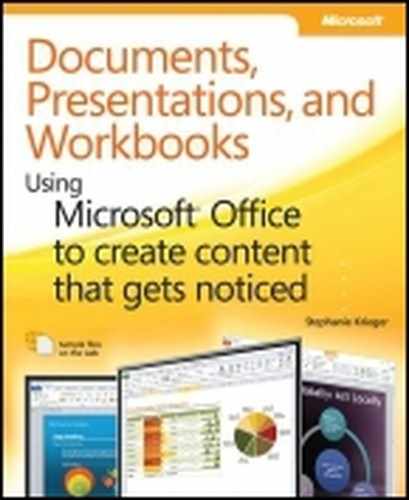
Paste SmartTags and Paste Live Preview options make it easy to change the paste option after pasting when needed. For example, Figure 10-1 shows the options given after you paste an Excel chart from Excel into Word. Or you can use the Paste Special dialog box to see all available paste options (including available picture format types in Word 2010), which can sometimes help better control how content is placed in your document.
For Word 2010, notice in Figure 10-1 that you need to point to the paste options for a ScreenTip that describes the selected option. When you do, you see a preview of how the object will look with the selected format.
Note
The default paste method is to use the Paste command on the Home tab in Word 2010 or the Standard toolbar in Word 2011, or the keyboard shortcuts Ctrl+V (Word 2010) or Command+V (Word 2011).
To access Paste Special in Word 2010, press Ctrl+Alt+V or, on the Home tab, click to expand Paste options, and then click Paste Special. In Word 2011, press Command+Ctrl+V or, on the Edit menu, click Paste Special.
Note
See Also The difference between the new Paste Live Preview options in Office 2010 and Paste SmartTag options is that you see a preview of what your content will look like when you point to a given Paste Live Preview option, before you select it. To learn about Paste Live Preview in Office 2010, see Chapter 1.
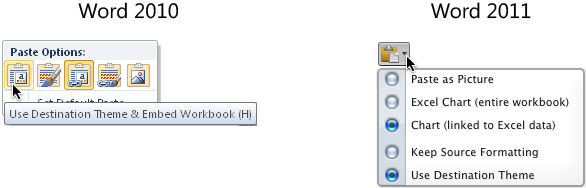
Figure 10-1. Paste Live Preview options in Word 2010 (left) and Paste SmartTag options in Word 2011 (right), both for a chart copied from Excel.
Regardless of the method you choose, it’s good to know what the default paste types are as well as which paste types you might prefer to use in some situations. The list that follows provides a summary of this information along with steps to ensure that you don’t accidentally share unwanted information in your document graphics.
Caution
If you use the default paste method, keep in mind that the paste SmartTag or Paste Live Preview options disappear after you make any edit to the pasted graphic.
An Excel chart created in Excel pastes into Word as a live chart, linked to the source workbook. If you paste an Excel chart into Word from PowerPoint, it pastes by default as a live chart but with the data embedded. The Paste Live Preview and Paste SmartTag options include embedding the source workbook in the chart or pasting the chart as a picture. When the chart originates in PowerPoint, linking the data is not an option.
In Word, when a live Excel chart is pasted as a linked or embedded object, the chart is editable in Word as if it had been created in that program. You see Chart Tools contextual tabs on the Ribbon when you select any portion of the chart, and chart formatting responds to changes in your Word document theme.
If you leave the data linked to the source workbook, that workbook must remain accessible on your system, and in the same location as when it was linked, for the linked data to continue to be editable from Word. If you move the source file, you can update the link to find the new file. However, the source file must remain accessible from your system for you to edit linked data or update links.
If, however, you choose to embed that data, be careful about what other data resides in the workbook from which you copied the chart. When you embed the data for an Excel chart, the entire source workbook is embedded. So, if the source workbook contains data other than for this particular chart, you might not want to embed that data in your Word document both for file size and privacy reasons when sharing the document.
For example, if you have a workbook containing PivotTable reports for your top five clients and you embed a chart related to one client in a Word document going to that client, the data in the source workbook relating to your other four top clients will be equally accessible to anyone who receives that Word document. So, before embedding any Excel content in your Word documents (or PowerPoint presentations), be sure that you are sharing only information you want to share.
Note
See Also If the source data workbook for a linked chart becomes unavailable, the chart will still seem to be a live, dynamic chart, but the ability to access or edit the data will be lost. If this happens, you can copy the chart back to an Excel worksheet and use an Excel macro to retrieve the lost data. For help doing this, see the sidebar How Can I Retrieve Lost Chart Data? in Chapter 20. For information on how to update or edit links, see the section Editing Linked and Embedded Objects, later in this chapter.
A SmartArt graphic pastes as a live, editable graphic. SmartArt behavior is essentially the same in Word, PowerPoint, and Excel, so there is typically no reason to paste it as anything other than a live, editable graphic. If, however, you don’t want the graphic to be editable by recipients of the document, you can create it in PowerPoint or even another Word document, and then use Paste Special in Word to paste the graphic as a picture.
Note
If you want the graphic to be a picture and you don’t need to save a live, editable copy of it for yourself, you can even create the graphic in the Word document in which you’re working, cut it, and then use Paste Special to paste it back into the document as a picture.
Whether you create the SmartArt graphic in Word or paste it from another program, there is one potential privacy risk to watch out for. Before sharing a live SmartArt graphic, select the graphic and look at the text pane that appears. If you changed the layout of the SmartArt graphic to one that has different constraints for the amount of text the graphic can display, you might see text in that pane labeled with a red X.
This is text that can’t be displayed in the active diagram but was typed into the pane or the diagram at some point. It does not display in your graphic but is still visible to any users who open your document if they view the SmartArt text pane. So, for example, if you copied the document from one originally created for another client and then changed the SmartArt layout, it’s worth taking a moment to check the SmartArt text pane to ensure that no text related to the other client still resides in that graphic.
Drawings created with shapes paste as live drawings. As mentioned earlier, if the drawing is complex to the extent that it could have a detrimental effect on your document’s performance, it’s a good idea to paste it as a picture. Otherwise, because you now have most of the same Office Art capabilities in Word as you have in PowerPoint—including the same available shapes and most of the same shape formatting tools—there is no harm in leaving the drawing live.
However, when working with shapes in your Word documents, keep in mind that even a shape formatted using the In Line With Text layout isn’t truly an inline object and might be more complicated to manage than where an inline object (such as a table) is an alternative solution.
Note
See Also To learn more about working with shapes in Word, see the section Simplifying Graphic Layout, later in this chapter.
A Visio diagram pastes as an embedded Visio object in Word 2010, with no paste SmartTag options. To paste a Visio diagram as a picture, you must use Paste Special.
When most object types are linked or embedded in a Word document, they’re stored in the Word document as fields. This is good news, because it makes the objects easy to convert to pictures. However, Excel charts are an exception. Because Excel charts can be created directly from Word, linking or embedding the chart (when using the default paste or the Paste Live Preview and SmartTag options) only links or embeds the data, leaving the chart as a live chart rather than a chart object. You can, however, break the link to the data in cases where you want the data to be accessible to you but not to users with whom you share the file.
Note
See Also For help with these tasks as well as information on how to break the link to data in a live Excel chart, see the next section of this chapter, Converting Embedded or Linked Objects to Pictures.
By embedding objects in your documents, you can edit the object directly from your document, provided the source program is available. So, if you share a document containing an embedded object, anyone who opens the document can potentially edit your graphic. Keep in mind that embedded objects are not limited to graphics and may be other object types, such as entire documents.
Linking objects (which can also be object types other than graphics, such as tables) requires not just the source program, but access to the source file. If you share a document containing a linked object, recipients of your document can see the image of the object but will get an error message if their computer doesn’t have access to the source file location.
Clearly, it’s not a good idea to share documents outside your organization that contain links to other files, both because of the inconvenience of error messages and because of the potential loss of information once the document is no longer in your control. However, when you intentionally want the data to be available to you and not to those with whom you share the document, you can break the links in a copy of the document before sharing it. That way, recipients see the object but cannot access the source data. If you do this, however, be sure to do it in a copy of the file so that you don’t lose access to the source data. Once you break the link to the data, it cannot be easily restored without replacing the source content in the document.
Note
It’s easy to check whether your document contains links without checking each individual object. To do this in Word 2010, click the File menu and then click Info. If your document has been saved and it contains links, the command Edit Links To Files appears at the bottom of the Properties pane on the Info tab. In Word 2011, if the document contains links, the Links option is available at the bottom of the Edit menu.
To paste an object with a link to its source file, use Paste Special (Ctrl+Alt+V or Ctrl+Command+V). In the Paste Special dialog box, shown in Figure 10-2 in Word 2010 after a Visio object was copied, click Paste Link to see the paste options. Paste As options often change after you select Paste Link, because linking is not available for all options. Note also that linking is not an available option in the Paste Special dialog box for pasting some graphic types that can be created in Word, such as SmartArt diagrams.
Tip
It’s important to mention that Visio has an idiosyncrasy when you’re copying content. To copy a drawing from Visio, make sure nothing on the page is selected. Then, press Ctrl+C or, on the Home tab, click Copy. If you select the drawing before you copy, some Paste Special options (such as the ability to paste a link) will not be available. This means that you must copy everything on the page when you want to link a Visio object that you paste into a Microsoft Office document.
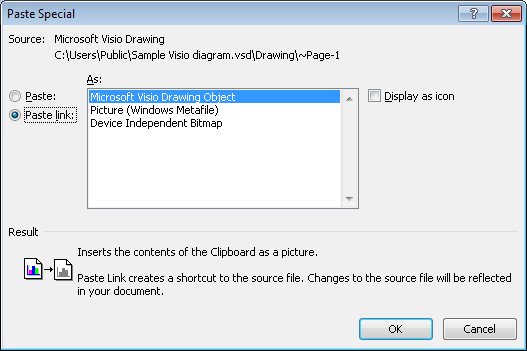
Figure 10-2. The Paste Special dialog box, shown in Word 2010, with one example of the options you might see when pasting a graphic.
As always, the Paste As options in the Paste Special dialog box differ based on the type of content that you’ve copied to the clipboard.
With the exception of Excel charts that are pasted into your document as live charts with linked or embedded data, embedded or linked objects are stored in Word as fields. For this reason, you can simply remove the field code to leave just the image of the linked or embedded object—that is, to convert the object to a picture. To do this, select the object and press Ctrl+Shift+F9 (or Command+Shift+F9 in Word 2011). This keyboard shortcut removes any field code, leaving only its result.
Note
On Mac laptops, add the fn key to keyboard shortcuts for working with field codes, such as Command+fn+F9 to convert text to a field code and Command+fn+Shift+F9 to convert a linked or embedded object to a picture (that is, to convert a field code to its static result).
Caution
After you convert a linked or embedded object to a picture, the original object is no longer editable and any dynamic data is lost. For this reason, before converting any object to a picture that might require editing later, first save a copy of the source object in its originating program.
Note
See Also Find instructions for how to save a copy of the source object in the next section, Editing Linked and Embedded Objects.
For most types of fields, including embed fields, the keyboard shortcut is the only way to remove the field code. However, in the case of linked objects, links can also be broken or edited through the Links dialog box, shown in Figure 10-3. As mentioned earlier, you can access this dialog box only if links to other files exist in a previously saved document.
To access this dialog box in Word 2010, click the File tab and then click Info. Find the command Edit Links To Files on the bottom of the Document Properties pane on the Info tab.
To access this dialog box in Word 2011, on the Edit menu, click Links.
Even though you can’t break the link for a live Excel chart using the keyboard shortcut to disconnect a field result from the field code, it’s important to note that the links for charts pasted from Excel into Word using the default paste method are available and can be broken through the dialog box shown in Figure 10-3. If you break the link to chart data this way, you can still select and edit formatting of chart elements (such as changing the color or effects applied to data series), but access to source data will be lost.
Caution
If you don’t want recipients of your document to be able to access data for a live chart, it might not be sufficient to break the link through the dialog box. If you can see the data in a live chart, the chart still knows its data, which means that data can be recovered. Recovering it requires the use of VBA, but the Microsoft Knowledge Base contains instructions for getting this done. So, to ensure that recipients can’t recover chart data, paste charts as pictures.
Note
See Also For more information about recovering lost data from an Excel chart, see Chapter 20.
Note
Hyperlinks, even to other files, are not the same as linked objects, and are not accessible through the Links dialog box. A hyperlink is a field type in Word, but is not related to the Link field.
Caution
If you use Paste Special to paste an Excel chart as a linked or embedded object, it will paste as a traditional embedded or linked object (that is, it will be stored in a field code so that it’s editable through the Chart Object options when you right-click the object, and can be converted to a picture using the Ctrl+Shift+F9 shortcut). However, this option provides unnecessary complications beyond those discussed in this chapter for embedded objects, such as possible sizing distortion if the chart is on its own sheet in the source workbook. For best results with a chart that is editable and has its data stored in the document, create your chart in Word. For a chart that is not editable in your document, create the chart in Excel and then use Paste Special to paste it as a picture.
For any linked or embedded object that can’t be edited directly on the Word document page (this includes all embedded objects other than Word tables linked to Excel data and live Excel charts), the steps for editing the object are very similar.
Right-click the object and then point to <Type> Object. Notice that the options provided include Edit and Open.
Note
The Convert option that you see on the same menu as Edit and Open might not do what you expect. It may offer options to convert to other object types, but it does not convert the object to a picture. For example, an embedded Excel worksheet object will offer Convert options to change the object to a different type of Excel object (such as a legacy workbook or a macro-enabled workbook, as you see if you select the Convert option in Word 2010). For many types of objects, Convert doesn’t really offer any options at all. In the case of Visio objects, for example, the only “option” for an embedded Visio drawing is to convert it to an embedded Visio drawing. Similarly, in Word 2011, the only option for converting an Excel worksheet object is to convert it to an Excel worksheet object.
For easiest and best results when you need to remove the editable source content from an object, break the link to convert the object to a picture (or to strip the data, in the case of a live, linked Excel chart), or copy the object and paste it using Paste Special as the picture type of your choice.
In Word 2010, if you need to change the dimensions of the pasted object itself (for example, if part of your graphic is cut off in the object), select Edit. Otherwise, for any changes to the object itself, select Open.
In Word 2011, the Edit and Open options provide largely the same result in most cases—select either option to edit the object.
When you select Edit in Word 2010, the object window opens only as large as the space allotted to the embedded object. The Ribbon (or menu and toolbars, as applicable) from the source program becomes available. However, because you’re working within the space of the object, it’s a bit more difficult to manage. Additionally, the File tab in the source Office 2010 program isn’t available when you’re editing an object in Edit mode. When you select Open, the object is opened in a separate window in the source program, so that you can edit it as you would any object in that program.
In Word 2010, follow these steps (depending upon the option you select):
If you select the Edit option, drag the black, thatched edge (shown in Figure 10-4 in the cross-section of an embedded Visio object) to resize the object boundaries.
When you’ve finished working in Edit mode, just click in the Word document, outside the object, to close the object.
If you select the Open option, when you finish making changes, you can simply click the X in the top-right corner of the source program window to close the object and return to the document (you might need to manually switch your window back to the document if you use this method).
In Word 2011, when you open an embedded object for editing, the size of the object may change to match the source program window. If this happens, or if you need to change the size of the embedded object, just drag to resize the source program window until the object in your document looks correct.
When you choose to paste a graphic into your Word 2010 document as a picture, you often have several options and usually a best choice among them. In Word 2011, you typically have only one picture option in the Paste Special dialog box (which is the same as the picture option that may appear on a Paste SmartTag), and Word automatically determines the best picture type for you.
In Word 2010, getting the best picture quality for the smallest file size is easy when you use Paste Special to paste graphics into Word as pictures. But the best picture type to select in the Paste Special dialog box varies based on the source program or original file type for the particular graphic. Table 10-1 summarizes common picture types that might be available when you use Paste Special to paste a graphic into Word 2010, along with the best practices for using each.
For Word 2011 users, see Table 10-1 for information about what picture file types Word uses for the different types of graphic content you might paste into your document as pictures.
Additionally, for both Windows and Mac users, Table 10-1 offers guidance on picture file formats to use when saving content from other programs as pictures for use in Office 2010 or Office 2011.
Note
When determining the best type of picture for your particular graphic, consider how the document will be used. If the document is likely to be used both on screen and printed, you might want to print a sample graphic to make sure the selected picture type is as clear in print as it is on screen. If the document will be shared online, consider viewing the file in Word Web App view mode to confirm the image quality.
Table 10-1. Common picture file types for use in Microsoft Office
Picture type | When to use it |
|---|---|
Picture (PNG) | When in doubt, always try PNG first for images. This applies both to paste type and when creating graphics—in almost any program—to be inserted into Word 2010 or Word 2011 as pictures. This is the best picture type to use when pasting any content from PowerPoint—and in most cases, Excel—into Word as a picture. (Note that for pasting content between versions of Word, PowerPoint, and Excel for Windows prior to Office 2007, Enhanced Metafile (EMF) is the better choice.) The .png file extension, which stands for Portable Network Graphic, is an Internet-compatible picture type similar to JPG (.jpg or .jpeg) or GIF (.gif), both referenced later in this table. Like the other Internet-compatible picture types, PNG pictures are a type of bitmap. This is a good format to try for most graphic types when the results you get from pasting in other picture formats are not as good as expected. This file format is also an excellent choice when pasting any type of graphic in documents that you will share across platform or online. For example, when you’re exporting vector art for use in Microsoft Office from a program such as Adobe Illustrator, PNG is usually the best choice. This is also the format used automatically by Word 2011 when you paste content from other Office 2011 applications (and many other applications, such as Adobe Illustrator) into Word as a picture. Note that .png is a picture file format offered in the Windows Paint accessory program available in Microsoft Windows, and it often provides excellent clarity for screenshots with much smaller file sizes than Windows bitmaps. This format is also available in the Preview application on Mac OS. So, for example, if you take a screenshot using the Grab utility in Mac OS (which always saves images as TIF files), on the Edit menu, click Copy. Then, in Preview, on the File menu, click New From Clipboard. Preview creates a new file with your image that you can save as a PNG (or a variety of picture formats). If taking screenshots on a Mac, also note that the keyboard shortcut Command+Shift+3 (screenshot of full screen) and Command+Shift+4 (drag to select screenshot area) automatically creates a PNG image of your screenshot, saved by default to your desktop. Add Ctrl to those keyboard shortcuts, and Mac OS copies your screenshot to the clipboard, where you can use the preceding tip to create a new file from it in Preview. (Thanks for this cool tip go to Dennis Cohen, one of this book’s talented tech reviewers.) |
Picture (Enhanced Metafile) | This format (the .emf file extension) is often the best picture type to use when pasting content from Visio into Word 2010 as a picture. Additionally, this is a good option to try when pasting an Excel 2010 chart into Word, if the PNG format doesn’t provide optimal results. As mentioned earlier, this format used to be the best choice for graphics originating in PowerPoint and Excel, but that is not usually the case in current versions. Both Word 2010 and Word 2011 save some linked objects (such as Excel charts that are saved as objects rather than live, editable charts) as .emf pictures along with the link data. Note that if you want to paste a Visio diagram with a link to the source file during document editing to save time, and then break that link for security reasons before sending out the file, choose Microsoft Visio Drawing Object along with the Paste Link option in the Paste Special dialog box. When you break the link, Word converts the object to an Enhanced Metafile Picture. Metafile images are not bitmaps (that is, they are not flat images). For this reason, Office 2010 can recognize the drawing elements in a metafile image—which means that you can in many cases convert metafile pictures to Office Art shapes. See the sidebar Copy Picture Files out of Your Documents, which follows this table, for information about converting metafile images to drawing shapes. |
Device Independent Bitmap or Bitmap | These file types, both of which use the .bmp file extension, are Windows bitmaps. They usually add significant file size to your document, but may also provide higher-quality alternatives in Word 2010 when you’re not happy with results from smaller file types. Note that device independent means that the graphic contents won’t be affected by settings in the program where the bitmap is placed. While this is an uncommon issue with graphics today, if you have a logo created in a vector graphics program and it contains text that was saved as text (rather than as outlines), the font definition might be different in Word than in the source program (causing the logo to look different in Word). If an image appears different in Word than in the source program, try the Device Independent Bitmap format. |
Most people are familiar with the .jpg (or .jpeg) file extensions, because JPG is the most common file format used by digital cameras. JPG is usually the best option for pasting or inserting photographs. Word 2011 keeps the original file type (JPEG or GIF) when you paste a picture that originated in that format into Word 2011. However, if you paste that object along with others (such as if you copy an image plus shapes from a PowerPoint slide and paste the collection into Word 2011 as a single picture), the image will be pasted as a PNG. When you’re pasting graphics originating in programs outside Microsoft Office as pictures, JPG/JPEG or GIF can also be good alternatives if the results with PNG are not ideal. | |
Though TIF is not an available option for many types of graphics, pasting a picture using the .tif file format when available can often provide an excellent alternative for high-quality graphics. In particular, when the graphic (such as a company logo designed in a vector graphics program) contains text, TIF will often provide the best picture quality both in print and on screen. The only thing to watch out for with TIF images is that they tend to be extremely large in file size. PNG, JPG/JPEG, TIF, and GIF are all good file formats to use when inserting images into Word 2010 or Word 2011 documents that you will be sharing cross-platform with other Microsoft Office users. |
Caution
Naturally, Murphy’s Law dictates that as soon as you get rid of a graphic source file, or even think that you won’t need to edit the graphic again, you are guaranteed not only to need to edit it, but to do so urgently. So, when you insert or paste a graphic into your document as a picture, be sure to note the name and location of the original source file for later use.
If you want to note the source file information in the document itself, comments are typically the best way to do this because they’re easy to see (visible by default when you open the document) and easy to remove before sharing the document. Other common methods, such as formatting the file information as hidden text or adding the path in the Alt Text description for the picture, carry a greater risk of leaving behind private information when you share the file because you may not see these elements when viewing your document.
Note
Mac users, please note that this section applies to your word processing style–documents only—that is, the documents you create in Print Layout or Draft view. Layout for Publishing Layout view documents is discussed in the section Working in Publishing Layout View in Word 2011, later in this chapter. For Windows users, this section applies to all of your Word 2010 documents.
When you’re ready to paste a graphic into your Word document, first ask yourself the following question: Would you prefer to spend the next 20 minutes of your life struggling to position that graphic, only to give up and decide it’s close enough, or do you have something better to do with that time?
If you have something better to do, and I hope that you do, just remember the following four words: In Line With Text.
It might seem as though text wrapping options such as Tight or Square, shown in Figure 10-5, are the easiest way to get the layout you want. But positioning and anchoring options can be complicated and documents can become much more difficult to manage.
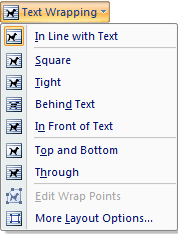
Instead, when you use the In Line With Text option at the top of the list shown in Figure 10-5, you’re actually turning off text wrapping. When you do this, your graphic sits on the same document layer as text or tables. So, you can position and format that graphic as easily as you do a paragraph of text. Additionally, when your graphics are formatted to be inline with text, you can place them in table cells for simplified solutions to complex page layouts.
Note
See Also To learn about the concept of layers in Word, see Chapter 6. To learn how to use tables to simplify complex page layouts, see Chapter 9.
Caution
Never place floating graphics (that is, graphics that use text wrapping settings other than In Line With Text) in front of or within tables, especially nested tables. Doing so can generate the table corruption error message and might require repairing the table.
Note
See Also For help with that error message, see the sidebar Keeping Tables Well Behaved in Chapter 9.
By default, most pictures are automatically positioned inline with text when you paste or insert them into your document. To set this default:
To set a graphic to the In Line With Text layout, right-click the graphic, point to Wrap Text, and then click In Line With Text. Or, find text wrapping options on the applicable contextual tab that appears when you select the graphic (such as Picture Tools Format in Word 2010 or Format Picture in Word 2011).
As mentioned earlier, graphics that use this layout option can be formatted as easily as text. For example, apply center or right paragraph alignment to move the graphic horizontally on the page. Paragraph indents and spacing before or after the paragraph can also come in handy for positioning graphics. In fact, if you have a lot of graphics in your document and want them all formatted consistently, it’s a good idea to create a paragraph style for your graphics, just as you would for text that you want to keep consistent throughout the document.
Tip
When you have a graphic in the body of a paragraph, in addition to paragraph formatting, you can use character spacing position (raised or lowered) to adjust the selected graphic vertically on the line of text.
Access character spacing position on the Advanced Tab of the Font dialog box. To access this dialog box in Word 2010, on the Home tab, in the Font group, click the dialog launch icon (note that when some types of graphic objects are selected, the shortcut Ctrl+D that normally opens this dialog box will instead duplicate the object). In Word 2011, on the Format menu, click Font (or press Command+D).
If the Font dialog box is not accessible (as is the case with a picture selected in Word 2011), select the picture as well as one character to the left or right of it to access the dialog box. To easily clear the formatting from additional characters after applying it, select just the additional character(s) and then press Ctrl+Spacebar.
In recent versions of Word, it was easy to distinguish a graphic formatted to be inline with text from a floating graphic, either by the handles that appear when the graphic is selected or by the mouse pointer when hovering over the graphic. That’s no longer the case, but there are still visual cues you can use to quickly identify whether a graphic is floating or sitting inline with text.
![]() If you’re viewing all formatting marks, you can see the object anchor (shown beside this paragraph) that appears for any floating object other than a text frame. The anchor may appear in the margin to the left of a paragraph, or it may appear inside the perimeter of the object, usually in the top-right corner. If you’re not viewing all formatting marks, or you’re not comfortable with this method, remember that Text Wrapping is an option when you right-click most types of graphics, so you can just right-click and then point to Text Wrapping to see the setting.
If you’re viewing all formatting marks, you can see the object anchor (shown beside this paragraph) that appears for any floating object other than a text frame. The anchor may appear in the margin to the left of a paragraph, or it may appear inside the perimeter of the object, usually in the top-right corner. If you’re not viewing all formatting marks, or you’re not comfortable with this method, remember that Text Wrapping is an option when you right-click most types of graphics, so you can just right-click and then point to Text Wrapping to see the setting.
Though the handles of selected objects no longer differ based on layout (except in legacy documents), it’s still good to know what you can learn about a graphic from the handles you see when the object is selected. Note that these handles are the same in Word 2010 and Word 2011.
Charts created using the current Excel chart functionality (whether created inside Word or pasted as live, editable charts from Excel or PowerPoint) and SmartArt diagrams both have a blue border. This looks just like the drawing canvas that I maligned just a couple of pages ago, but for these objects it is not excessive or in any way unnecessary, but rather just the border/handles of the object, as shown in Figure 10-6.
Figure 10-6. The handles of an Office Art chart or SmartArt graphic are dots around the edges of a blue frame.
This border is blue regardless of your color scheme (in both Word 2010 and Word 2011), and the handles are the series of dots on each side of the object as well as at its corners.
Pictures and Office Art shapes have round handles at the corners and square handles on each side, as you see in Figure 10-7, with the green rotation handle attached to the top picture handle.
Despite the fact that these handles look very similar to floating objects in versions of Word prior to 2007, and 2008 for Mac, they are now the same for pictures formatted to sit inline with text, including the rotation handle.
Embedded objects in Word 2010 and Word 2011 documents, as well as pictures formatted as inline with text in legacy Word documents, provide handles similar to earlier versions of Word, with the handles on the inside of a dotted-line border. Floating graphics in legacy documents opened in Word 2011 have handles similar to current pictures, as shown in Figure 10-7. In legacy documents opened in Word 2010, floating graphics have similar handles, but they are blue in color and smaller.
As discussed in Chapter 9, tables are the perfect layout tool for complex page layouts, such as when you need graphics beside text, tables, or other graphics. When it was more common (in earlier versions of Word) to create your graphics in other applications and paste them into Word, the table cell was also handy for providing the dimensions (cell height and width) to which to size the graphic before copying it into Word.
This is no longer necessary in most cases, since you are likely to create your graphic in Word or insert or paste it into Word as a picture. But you can save time when using a table to lay out a page by setting the table AutoFit setting to Fixed Column Width. When you do this, most types of graphics that you can insert into a table cell will automatically resize to fit the cell (and thereby maintain the page layout structure without extra work). This includes SmartArt graphics and charts that you create directly in Word (click in the table cell and then insert the new graphic from the Ribbon) and pictures that you insert from files or Clip Art in Word 2010 or Word 2011, as well as those that you insert from the Media Browser in Word 2011.
The fixed column width setting doesn’t prevent you from resizing columns if you choose; it only prevents columns from resizing automatically to accommodate content that you place in the cell. To set table columns to fixed column width:
In a perfect world, floating graphics would be as easy to manage in Word as those that are inline with text. Because the world (at least for now) isn’t perfect, in an ideal incarnation of the current real world, you’d never need to use floating objects in Word 2010 (or Word 2011 Print Layout view documents). But, although formatting graphics with the In Line With Text layout and using tables for page layouts can address most requirements for beautiful, effective Word documents, there are exceptions where you’ll need to use floating objects instead.
There will be times when using floating objects is necessary to avoid compromising a design or to meet a document’s requirements, and there’s just no way of getting around it. For example, you might need a design that sits behind the page, an image that sits behind text, a graphic that bleeds off the page, or a watermark in the header or footer.
When you absolutely have to use text wrap, follow these tips to help you keep it simple and easy to manage:
When you need to layer a graphic with text or other document content, always use the Behind Text wrap setting when possible.
In Word 2011, this option may not appear to be available, but it is. To set a graphic behind text in Word 2011, set Text Wrap to None. Then, right-click the graphic, point to Arrange, and then click Send Behind Text.
Watch the positioning of the anchor. The anchor nonprinting character (formatting mark) shown earlier always appears for a floating object, and the position of that anchor can make the graphic easier or more difficult to manage. An anchor always sits in a paragraph, but that paragraph can be attached to text or formatting marks, or even inside a table.
Remember that you can see anchors when you turn on formatting marks in the document. For best results and easy editing, always make sure that the anchor is not sitting inside a table and is not attached to a paragraph that contains a page layout formatting mark such as a page break or section break. To do this, just select and drag the anchor character itself to a harmless location. For example, if you see that the anchor resides in a table cell, drag it to the paragraph mark that follows the table.
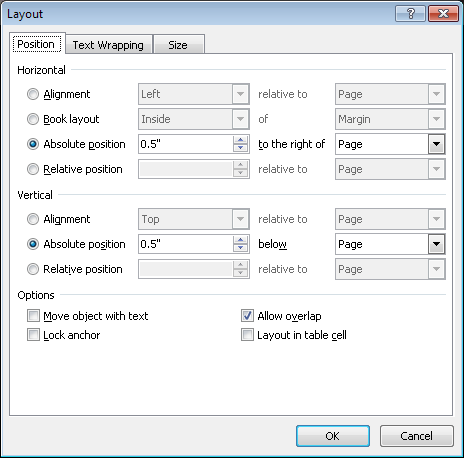
Always set floating graphics to be an absolute distance from the top and left of the page (as shown in Figure 10-8), unless you have a specific reason to do otherwise. To set the position of an object, on the applicable contextual tab (such as the Picture Tools Format tab in Word 2010 or the Format Picture tab in Word 2011), in the Arrange group, click Position and then click More Layout Options.
Note
The dialog box Position tab, shown in Figure 10-8 as it appears in Word 2010, has identical options in Word 2011. However, in Word 2011, the dialog box is named Advanced Layout.
Also notice the four check boxes shown in Figure 10-8. Always set Allow Overlap, or content will bounce out of your way when you try to position your object behind text or layered with something else. It’s usually a good idea to clear the check boxes other than Allow Overlap for the following reasons:
Layout In Table Cell is a well-intentioned feature but is likely to frustrate you and doesn’t actually help. If you want the object to be laid out in a table cell, drop it in the cell and use the In Line With Text layout setting. If the object is behind a table, chances are that you want to format the content in the table cells independently of the object, and you often can’t do that as easily with this option selected. If you have a floating graphic anywhere in the vicinity of a table and the table cell content doesn’t seem to go where you want it to, check to see if this option is set for the graphic, and if so, clear it.
Lock Anchor is simply something that you are unlikely to need very often, if ever. When the anchor is locked, you can’t drag it to move it to another location as indicated previously. So, before you use this option, make sure you really want that anchor to be locked to whatever paragraph mark it resides in.
Move Object With Text can’t do any harm, if in fact you want the graphic to move when the paragraph mark to which it’s attached moves. But if you’re using the graphic as a design element, that is rarely the case. If that is the case, you might also want to use position settings that provide an absolute distance from the paragraph rather than the page, depending upon your requirements.
Why Should I Avoid Using Frames?
When you must have content that wraps around or overlaps text, a text box is a better solution than a text frame. Frames are used for a number of features, such as drop caps or text wrap around tables, and they can also be included in paragraph styles. However, it’s common for documents containing frames to be more difficult to manage.
Fortunately, frames are less prevalent in recent versions of Word. However, if you can’t identify the source of trouble in your document, check for content in frames and delete the frame where possible. You can then place content in table cells for layout, or in text boxes if the layout requires a floating object.
A frame is easy to recognize when you click inside it or select it, because of its unique border and handles, as shown in Figure 10-9. Note that this image shows a frame in Word 2010. Frames look much the same in Word 2011, but the border and handles are black rather than blue.
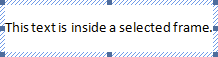
When you click inside a frame, the border appears thatched and with no handles. When you select the frame, the border is still thatched, but now has square handles at the sides and corners.
To remove a frame, right-click the frame border, select Format Frame, and then click Remove Frame. Note, however, that frames embedded in some features—such as drop caps—can’t be accessed this way. To remove the frame in these cases, turn off the feature that includes the frame.
Note that when used with text wrap around tables, the frame is invisible. However, the frame often becomes visible after the table becomes corrupted. In these cases, you can use the preceding instructions to remove the frame.
Note
Windows users, please note that this section describes features that are exclusive to Word for Mac 2011. However, if you work with Mac users and might have occasion to use documents that were created in Word 2011 Publishing Layout view in Word 2010, you might be interested in this section’s tips about sharing Publishing Layout view documents with Windows users.
Publishing Layout view makes me happy. I’ve had the privilege of building the templates that ship with Word for Mac for the past two versions, so I have built a lot of documents in Publishing Layout view, and I can tell you this: it’s fun, it’s very cool to see what you can create in Word using the tools it provides, and it’s probably much easier than you think.
When we began working on Word 2008 templates (the first version of Word for Mac that included Publishing Layout view) and I was told that many of the templates I’d be building would be composed entirely of floating objects, I felt a bit queasy, to say the least. Then I started to use the tools in Publishing Layout view, and I relaxed.
The great thing about Publishing Layout view is that it provides an environment specifically designed for working with layout—that is, for positioning and laying out objects as you do in a desktop publishing application. So, it greatly simplifies working with floating objects in Word. But, even better, it’s still Word, so you don’t have to learn a new program; you already know most of the features.
The best piece of advice I can give you as you begin to work in this view is to keep in mind that you’re still in Word. You are an experienced user of this software, so remember everything you already know about the program.
That said, this section treats you like an experienced Word user and doesn’t walk you through basics. Instead, it provides a list of key tips for working in Publishing Layout view.
So what aspects of Publishing Layout view are the same as when you’re working in traditional (Print Layout view) documents?
Text can (and should) be formatted using paragraph styles. You can use all the same font and paragraph formatting that you use in word processing documents, including the new text effects and OpenType typography features.
Because text always resides in a shape in Publishing Layout view (note that a text box is a shape), the primary difference about working with text in this view is that some paragraph formatting features for formatting page layout in Print Layout view documents may not apply (such as some of the line and page break options like Page Break Before formatting).
Also keep in mind that the text box area is the equivalent of the page to the text it contains. That is, text position is affected by text box margins and any line and paragraph spacing or paragraph indents you might apply, as well as by the height and width of the text box.
The colors, fonts, and graphic formatting effects come from the applied document theme.
Shapes, text boxes, and images in Publishing Layout view are the same as those you work with in other Word documents or, for that matter, in PowerPoint. And much like PowerPoint, the page in Publishing View is designed for you to pick up, move, position, and lay out objects as you need.
In fact, for best results when you’re positioning objects on the page, it’s usually a good idea to use the same absolute positioning settings discussed earlier in this chapter and shown in Figure 10-8.
The master pages in Publishing Layout view are essentially a cool environment for, and flashy way to say, the header/footer layer. That’s right—master pages are the same as clicking into the header/footer layer. In fact, when you use the feature to add a new master in Publishing Layout view, it adds a new section.
Note
See Also For help working with master pages in Publishing Layout view, to explore how the feature is the same and different from working with traditional headers and footers in Word, and to learn how to customize page number formatting when working in this view, see Chapter 11.
A small but powerful set of features in Publishing Layout view makes all the difference in the world when you need to create a publication style document.
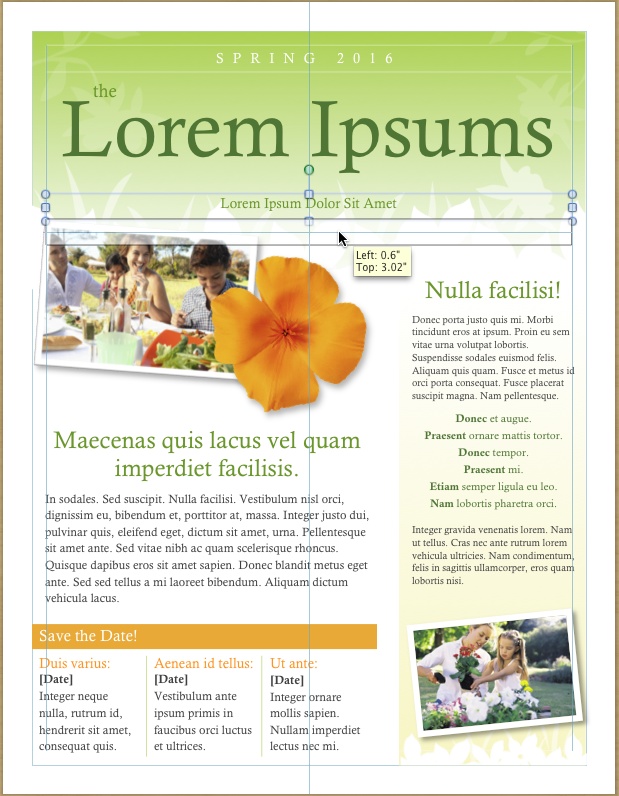
When you drag objects to move them on the page, notice that you see both dynamic guides (which show you when objects are aligned to the page or to other elements on the page) and a screen tip indicating the object position, as shown in Figure 10-10.
Figure 10-10. Dynamic guides and position ScreenTips appear automatically when you move objects on the page.
If you don’t see dynamic guides when you move objects, on the Layout tab, in the Guides group, click Show and then click Dynamic Guides.
You can also create static guides that you can position exactly where you need them on a page or master to help you align content. Guides don’t print and can be cleared easily.
To enable static guides, on the Layout tab, in the Guides group, click Show and then click Static Guides.
To create a static guide, drag from the horizontal or vertical ruler onto the page. As you do, you’ll see a blue guideline appear with a ScreenTip that shows you the position of the guide as you move it. Just drop the guide when you reach the position you want.
To clear a guide, drag it off the page. To clear all guides in the active document, on the Layout tab, in the Guides group, click Show and then click Clear Static Guides.
Note that static guides may disappear from one page or master when you create guides on another page or master.
For an example of how to use static guides to help set up a page, see the built-in Word 2011 Publishing Layout View business card templates. To access built-in templates in Word 2011, on the File menu, click New From Template. Notice that templates are divided into Print Layout view and Publishing Layout view.
The Document Map pane in Publishing Layout view shows you each page in the document; from this pane, you can drag and drop to rearrange pages in the document.
 To open the Document Map pane, on the Standard toolbar, click the Document Map button shown here.
Note that a double line between pages in the Document Map pane in Publishing Layout view indicates a section break (referred to as a new master in this view).
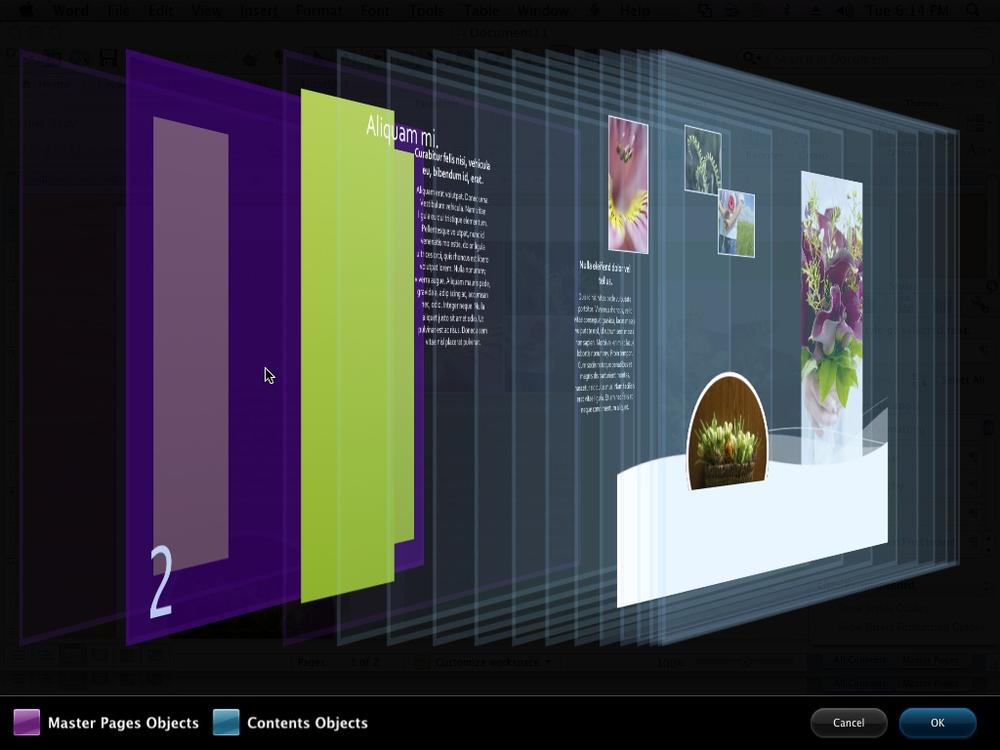
Dynamic Reordering, new to Office 2011 (it’s also available in PowerPoint 2011), makes me wish this book had a soundtrack. There should be angels singing as I introduce this feature…or at least a drum roll. It’s stunningly beautiful and will make you instantly feel like you’ve entered the future of document production. So what is it?
Dynamic Reordering is a three-dimensional view of all the layers in your document. You can use it to slice through the side of the document to see how it’s constructed and just drag any layer to rearrange it in the document.
No picture can do justice to this feature, certainly not a black-and-white one. But for those who don’t have access to Word 2011 to try it for yourself, Figure 10-11 at least gives you an idea. This image shows the built-in brochure template named Flow Trifold Brochure.
To use this feature, on the Home tab, in the Arrange group, click Reorder.
The ability to dynamically wrap text around objects is also unique to Publishing Layout view and helps you create truly dynamic, flexible layouts very easily.
Just move a shape or picture to overlap with a text box that has this feature enabled, and the text automatically wraps around the object. Adjust the position of the object, and the text will adjust in kind.
This feature is on by default when you create a text box. To enable it:
On the Format menu, click Shape.
On the Layout tab of the Format Shape dialog box, click Advanced.
On the Position tab, find the option Wrap Text In Text Boxes For Overlay Objects.
If this feature is enabled but text doesn’t wrap, the cause is usually one of two things:
Ensure that text wrap is on for the text box (such as setting the wrap to Square or Through).
Use the Arrange tools to move the text box in front of the object you want to wrap it around.
Linking text boxes to control text flow throughout your document is not unique to Publishing Layout view (or to Word for Mac). However, when you link text boxes in Word 2011, you see a number in the top-left corner of the text box that represents its order in the link, which is a behavior unique to this view. This feature is particularly useful in Publishing Layout view, where you might create complex documents such as newsletters or brochures that rely heavily on linked text boxes for layout.
Linking text boxes causes the text you add to the first text box in the link chain to automatically flow into the next as you add more content. To link text boxes, select the first text box and then, on the Format tab, click Link. Next, just click an empty text box to link it. You can add more links as needed by selecting each subsequent text box and then repeating the preceding step to link it to another.
See many examples of linked text box chains in the built-in Publishing Layout view templates, such as the newsletters.
When you want to share documents online—by saving them to a SharePoint 2010 site or a SkyDrive folder—you can do so with Publishing Layout view documents, but there are some limitations.
Those with whom you share the online location can, of course, download the files. They can also open the file in Word Web App in view mode and it will look great. But, as mentioned earlier in this chapter, because Word Web App edit mode does not support editing of floating objects, virtually everything in the document will be an uneditable placeholder. So, online editing of these documents is not currently available.
Also note that the new coauthoring feature in Word 2011 and Word 2010 is not available in Word 2011 for Publishing Layout View documents.
When you share your publication documents with users of Word 2010, those documents will look very much like they do in Word 2011 when formatting marks are not visible. For example, just as you see if you open your Publishing Layout view document in Print Layout view, master page content appears on the header and footer layer but is still visible.
However, Word 2010 doesn’t have the dynamic text wrap capability. Fortunately, it provides a workaround to keep dynamic text wrap intact. Text boxes that use dynamic text wrap in Word 2010 are automatically broken into a collection of single-line, linked text boxes. The users you share with can edit text in these text boxes similar to how you do in Word 2011, and the text will rewrap correctly. But they cannot adjust the wrap position or layout. When you next open the document in Word 2011, your dynamic wrap text box will automatically still be intact.
When collaborating across platforms, also keep in mind that Word 2010 users don’t have Publishing Layout view, so they don’t have many of the tools that make these documents easy for you to manage. Although the documents will look good and will make the round-trip between platforms with ease, they will be more difficult for your colleagues working on Windows to use. So, when you need to collaborate across platforms rather than simply sharing your beautiful finished product, consider sticking with Print Layout view documents that follow the traditional rules of Word.