
Chapter 5. Modeling Tools
So far, we have assumed that domain stories are documented on a modeling canvas, e.g., a whiteboard, or with software. Over the years, we have tried many different tools. We will now take a closer look at the available options, their advantages, and their disadvantages. First, we discuss analog tools. Then, we introduce some software tools. The chapter ends with a few tips for choosing a tool.
Modeling on Paper or Boards
Paper, flip charts, boards, etc., are cheap and ubiquitous modeling tools (see Figure 5.1). They work well for spontaneous modeling sessions with a small group of people. As there are some limitations too, we would like to give you our recommendations for modeling with the following:
• Pen and paper
• Sticky notes on a flip chart or paper roll
• Just a whiteboard
• Sticky notes on whiteboard
• The “whiteboard kit”
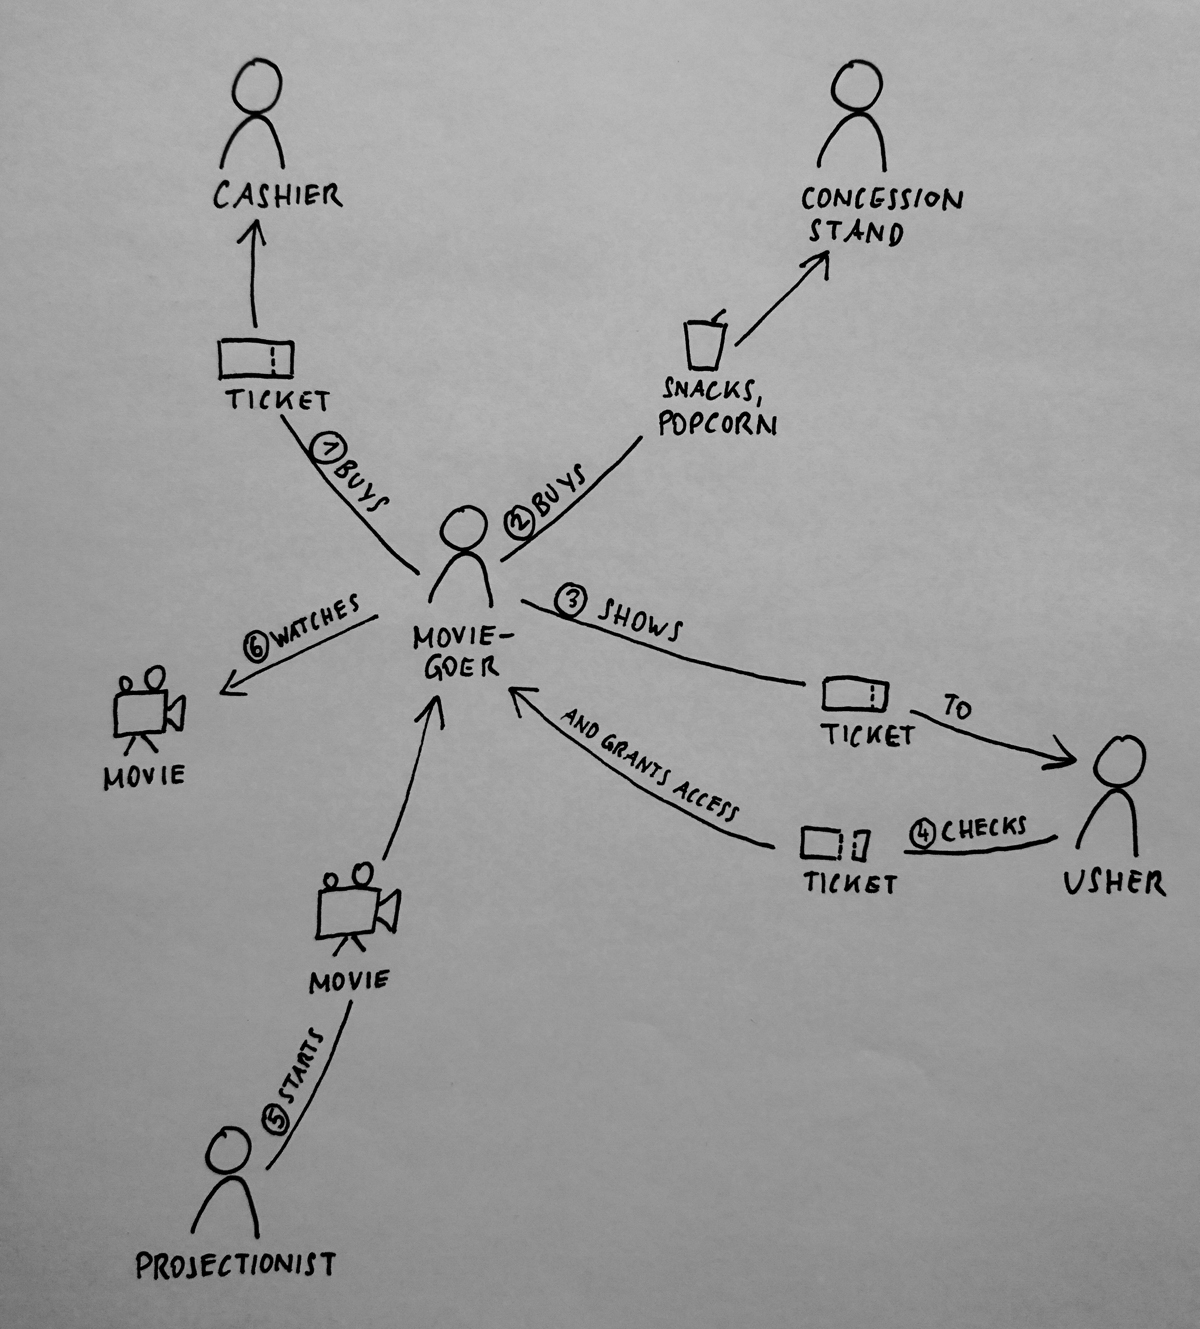
Figure 5.1 Modeling on paper
If you model alone and want to use Domain Storytelling as a thinking tool, pen and paper are all you need. Even if you model with one other person, a piece of paper will suffice. But as soon as there are three or more people involved, you will need a larger modeling canvas to enable everyone to see the domain story. This is when you want to switch to flip charts or a paper roll.
An obvious disadvantage of all paper-based modeling is that it is hard to revise the pictures. And you will need to revise them quite often, not only because domain experts correct their story as they go but also because even skilled modelers make mistakes. The moderator should also consider the layout of the picture in advance. For example, actors that are central to the story should be placed in the middle so that there is enough space to draw many incoming and outgoing arrows.
Using sticky notes for actors and work objects makes life a lot easier, especially if you use them on a whiteboard instead of paper (see Figure 5.2).

Figure 5.2 Sticky notes on a whiteboard
We’ve tried different ways of using sticky notes for Domain Storytelling on whiteboards. Here we highlight what has worked best for us.
We draw actors and work objects on sticky notes. Activities (arrows and labels) and sequence numbers go directly on the whiteboard. For us, this is the best compromise between ease of reorganizing and a clean and consistent look. We recommend you use square stickies for the work objects (see Figure 5.3) and larger, rectangular stickies for actors (see Figure 5.4). That makes the actors easily recognizable. Some practitioners favor using different colors to distinguish actors from work objects.
Another recommendation is to write a sentence’s number at the beginning of an arrow, next to the actor who initiates the activity. Draw a circle around the number so it is easy to spot.
Whichever personal style you develop, key to understandable domain stories is to apply your style consistently.

Figure 5.3 Put work objects on square sticky notes.
Figure 5.4 Put actors on rectangular sticky notes.
Experimenting with Sticky Notes on Whiteboards
It took us a while to figure out what works and what doesn’t. To spare you the hassle, we share our failures with you.
• Sticky notes for everything: We used large sticky notes for activities (arrows and labels) and smaller sticky notes for everything else. That did not work at all because it limits the layout of the domain stories too much.
• Sticky notes for everything but the arrows: We used sticky notes for actors, work objects, sequence numbers, and labels of activities, but the activity arrow was drawn directly on the whiteboard. That resulted in too much visual separation between an activity’s arrow and the label.
• Sticky notes just for work objects: Since domain stories evolve around the actors, we thought there would be less need for changing the position of actors. We were wrong. Also, the story looks weird if some icons are on sticky notes (those for the work objects) and other icons are on the whiteboard (those for the actors).
• Sticky notes for actors, work objects, and sequence numbers: We used very small stickies for the numbers (instead of writing the numbers next to the arrows). The idea was to make the numbers even easier to spot. But we found that three kinds of sticky notes are difficult to handle and that the small stickies produce a lot of clutter.
Sticky notes make it easier to correct mistakes and change the layout, but you still need to draw the icons by hand. We noticed that many moderators tend to draw only a few icons and rely on the textual representation of actors and work objects. If it works for the given purpose, that may be fine, but we think that such pictures lack in richness of expression. Discussing how a work object is represented uncovers hidden assumptions. Drawing icons facilitates such discussions and is therefore valuable.
To overcome the disadvantage of drawing icons by hand, Stefan printed icons on paper and taped them onto the modeling canvas. A more sophisticated version of this became known as the whiteboard kit (see Figure 5.5). We printed icons on slightly thicker paper, laminated it, and glued little flat magnets to the back. These cards stick on a whiteboard, and if you write on them with a whiteboard marker, they are reusable. We published a template for our whiteboard kit on www.domainstorytelling.org [DomainStorytelling Website]. Of course, you can (and in fact should) adapt the icon set to fit your domain.

Figure 5.5 Magnetic, laminated whiteboard kit
Modeling on whiteboards or large paper has an advantage over digital tools: All participants have “write access” to the model. This means that analog tools enable shared and collaborative modeling—at least for a limited number of people (see Chapter 6, “The Workshop Format”).
Modeling with Software Tools
Software tools fall into these categories:
• Digitalized hand-drawing (for example with tablet and digital pen)
• General-purpose drawing tools
• Virtual, collaborative whiteboards
• Special-purpose modeling tools, like our very own Egon.io—The Domain Story Modeler [Egon.io Website]
Most software tools are designed for a single user who uses an input device (mouse, keyboard, pen, etc.). Since shared modeling is not possible with such tools, one person needs to play the role of the modeler and do the drawing. As with analog tools, the model should be visible for all participants. That means you need to connect the modeler’s computer to a projector. Exceptions are virtual whiteboards and digital blackboards.
Digitalized Hand-Drawing
Digitalized hand-drawing (see Figure 5.6) can be done with a big touchscreen and a digital pen, like the Microsoft Surface Hub, or a tablet and digital pen, like the iPad and the Apple Pencil. It combines the freedom of drawing everything you want with the capability for easy change (i.e., moving parts of the domain story around without having to redraw it). Some people also like that they do not have to follow the rules and limitations that some modeling tools enforce.

Figure 5.6 Domain Storytelling with a digital blackboard
General-Purpose Drawing Tools
There is a wide range of general-purpose drawing tools that can be used to record domain stories graphically. Some popular tools that fall into this category are Gliffy, yEd, diagrams.net, Microsoft Visio, and even Microsoft PowerPoint (see Figure 5.7).

Figure 5.7 Modeling with diagrams.net
In our experience, there is no general-purpose tool that stands out when it comes to modeling domain stories. Hence, we do not have any recommendations other than using an icon set that fits to your domain.
Virtual Whiteboards
Virtual whiteboards are usually general-purpose drawing tools with real-time collaboration. We have already mentioned two of their characteristics: First, modeling can become collaborative. Second, whiteboards (analog and digital) tempt users to omit the icons altogether and just use (digital) sticky notes with text (see Figure 5.8).

Figure 5.8 Metropolis 2 without icons on a digital whiteboard
If that works for you, it’s fine. But as we discussed in Chapter 2, “The Pictographic Language,” the icons are not just there for beauty; they are supposed to convey meaning, enable discussions, and help with recognition. With a little effort, you can build your own icon set with tools like Miro, Mural, or Conceptboard (see Figure 5.9).

Figure 5.9 A suggestion for how to use icons in Miro
Virtual whiteboards can be combined with other modeling tools. For example, you can upload photos of domain stories that you modeled on an analog whiteboard. That makes it easy to compare several domain stories and annotate them collaboratively. See an example of the result of combining tools in Figure 5.10.
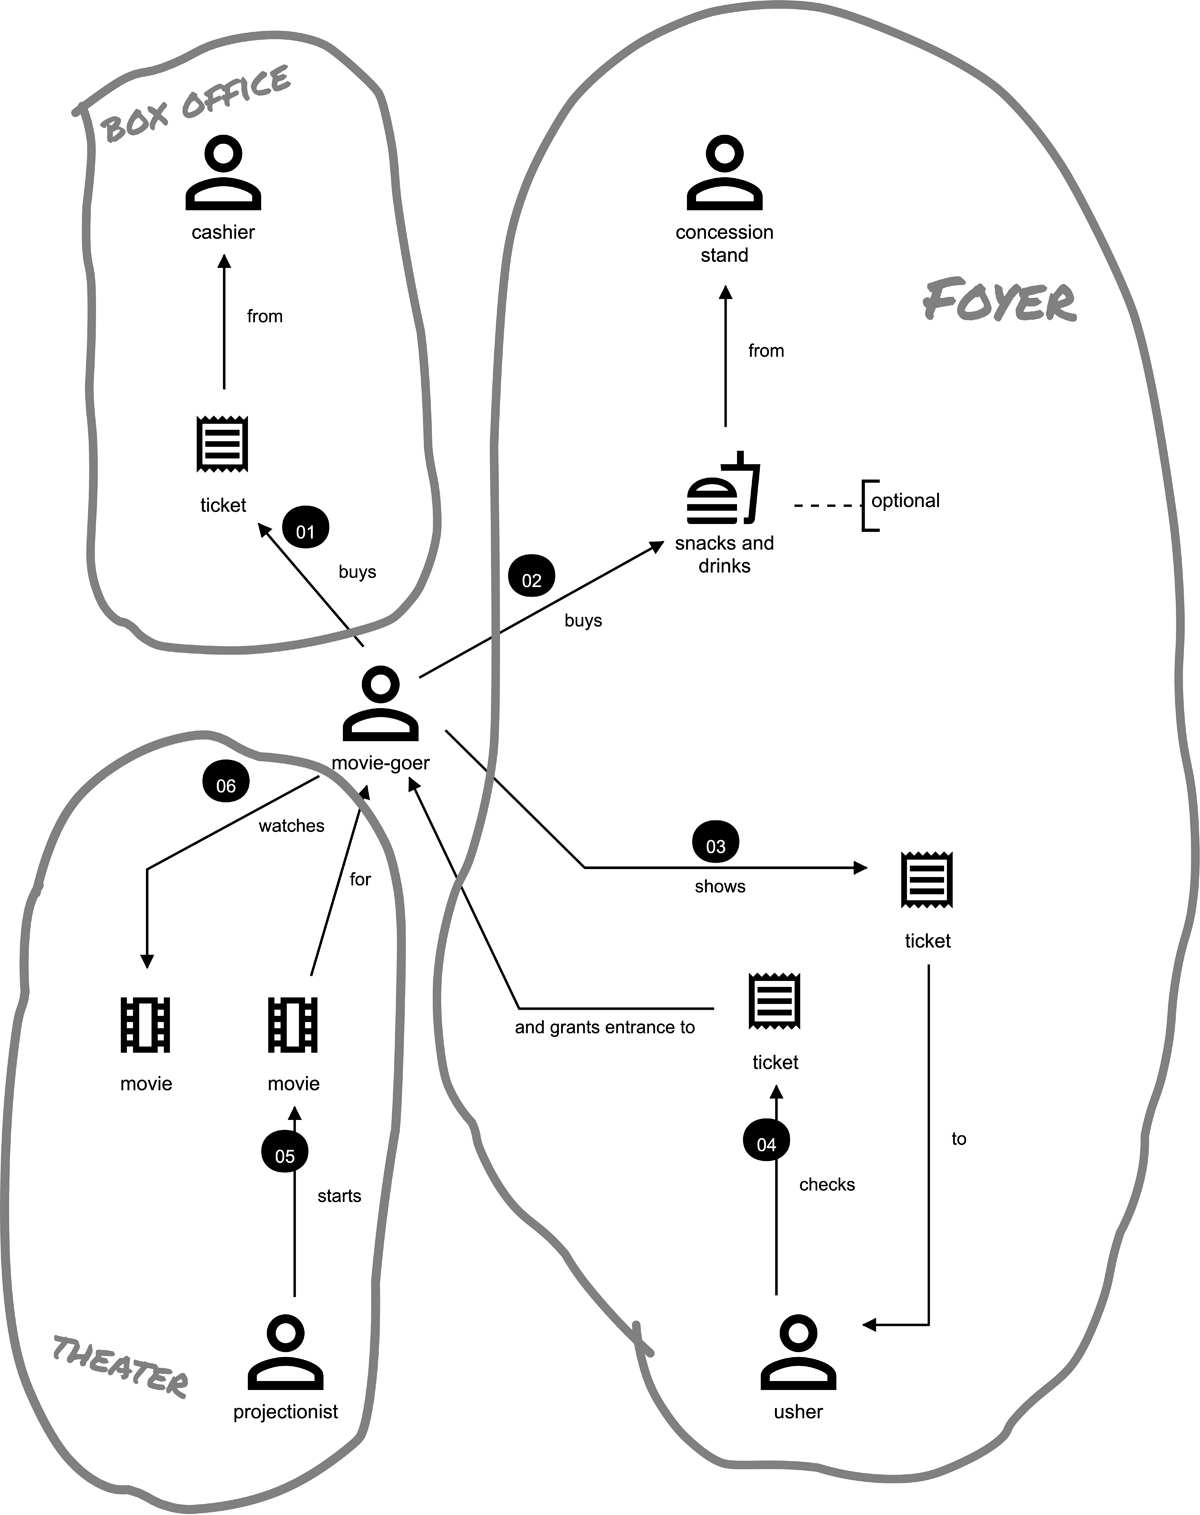
Figure 5.10 Combining tools—A domain story modeled in Egon.io with groups drawn in Miro
Special-Purpose Modeling Tools
In our opinion, a tool that really supports Domain Storytelling needs to do the following:
• Enforce the syntactic rules of domain stories. We want a tool for modeling, not for drawing.
• Number sentences automatically and make it easy to change the sequence of sentences.
• Help with storytelling by animating the sequence of sentences.
We built such a modeling tool at our company WPS: Egon.io—the Domain Story Modeler (see Figure 5.11). It supports you with numbering and with reorganizing models, and it helps you to retell a story sentence by sentence with a replay mode. If you were wondering how we made the figures in this book, now you know the answer.
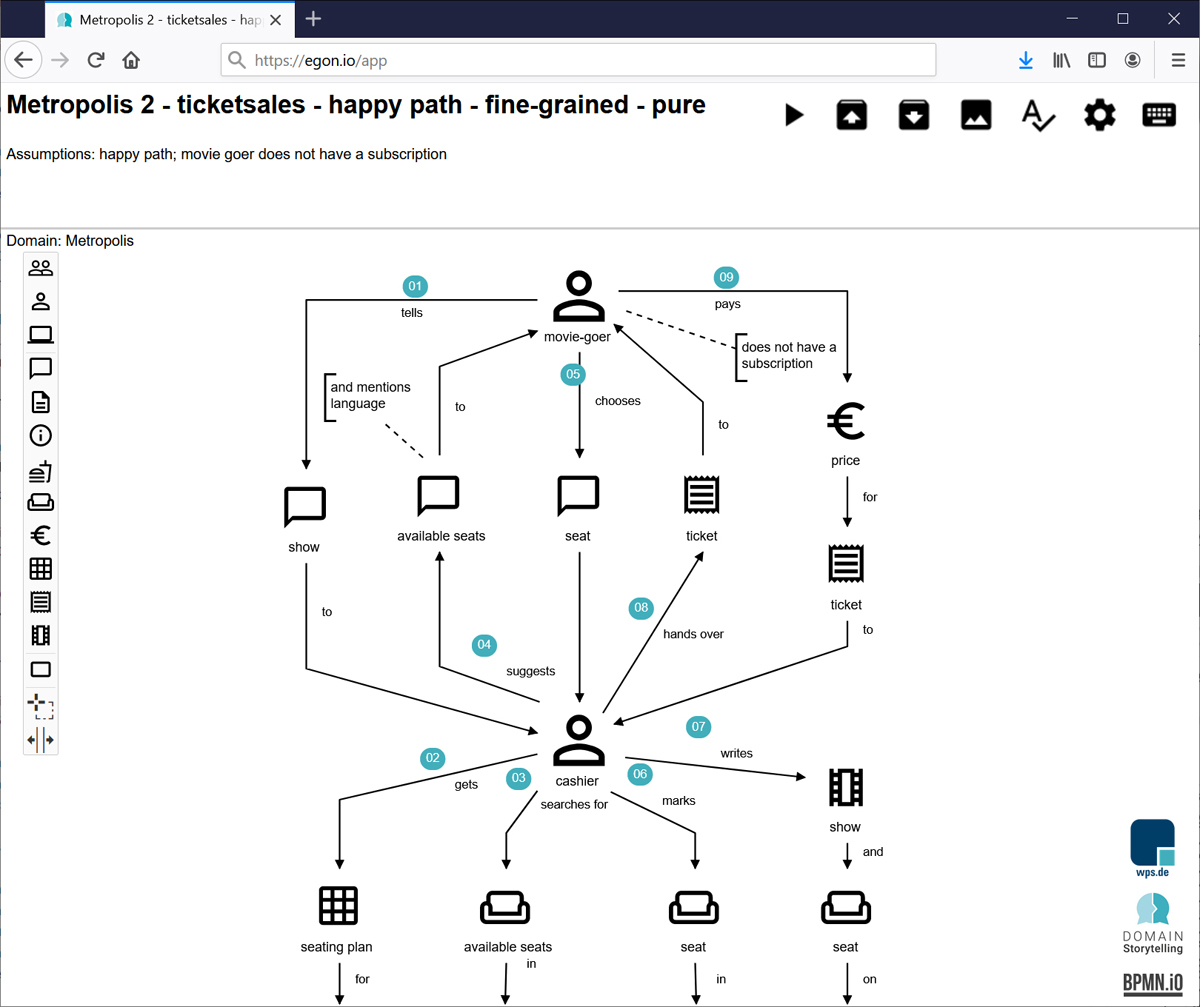
Figure 5.11 Modeling Metropolis 2 with Egon.io
Egon.io is open-source. Feel free to use it and adapt it. The source code and a ready-to-use, packaged version is available on GitHub [Egon.io Sources]. Or you can try it online [Egon.io Website].
Choosing a Tool
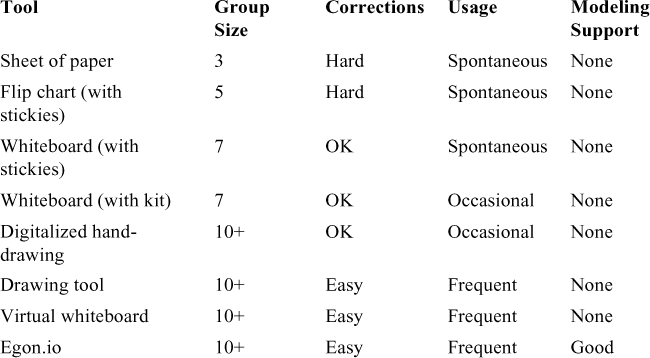
Table 5.1 lists all the tool categories that we’ve discussed in this chapter. For each, we recommend a maximum number of participants. Of course, this is not a strict rule.
Stefan’s Flip Chart Story
I once did COARSE-GRAINED Domain Storytelling for finding boundaries (see Chapter 10) with sticky notes on a flip chart with 25 people. It was challenging, and I definitely do not recommend it; but in the end, we reached our goal and then split up into smaller groups for FINE-GRAINED stories.
To help you with deciding which tool to use, we rated how easy it is to correct or restructure a domain story (easy, OK, or hard). We also give recommendations for which tool might be most useful in which situation: spontaneous (little to no preparation required), occasional (familiarity with tool required), and frequent (“enterprise settings” for when you need to create variations of a domain story, compare domain stories, etc.). We also note the degree of modeling support available (enforcing syntactic rules, numbering of activities, and animating the sequence of activities).
Table 5.1 Comparison of Modeling Tools
The tool you choose will have an effect on how the domain story is visualized. In principle, all activities should be numbered so that the number is placed at the origin of the activity’s arrow. With some tools it is easier to attach the number to the work object that is used in the activity. (You saw an example for these two variants in Figure 2.16.) There is no intended difference in semantics.
Another thing to consider is that your choice of tool will determine the available space for the model. If you model on flip charts or whiteboards, space is limited. That is not necessarily a disadvantage. Actually, limited modeling space can be helpful to keep domain stories tidy and concise. Digital tools often provide unlimited virtual modeling space and zoom capability. They require a disciplined moderator. As a rule of thumb, a domain story should be limited to the size of the screen (or flip chart, whiteboard, paper) or not more than approximately 20 sentences. If your domain story is much longer than that, consider splitting it into several stories and check if the level of detail is too fine for a visually “verbose” method like Domain Storytelling. We provide some help with splitting stories in Chapter 6, “The Workshop Format.”