
In this chapter, we look at some ideas to monitor system resources, such as kernel parameter usage, using tools like the new Web-based tool kcweb. We look at the hardware diagnostic tools known collectively as the Support Tools Manager, which has various interfaces from a simple command line interface through to an X-Windows GUI. While most of the tools are password protected, we can help HP hardware engineers collect vital hardware diagnostic information if they think we have an underlying hardware problem with our system. Ultimately, we are trying to assist in the Support process to ensure maximum availability of our systems. A useful tool in that armory is the ability to automatically monitor resources through the EMS framework. This can highlight any potential problems not only with hardware components but major system software features monitored by the EMS High Availability Monitors. We start with monitoring kernel resources and a review of dynamic kernel configuration.
Since HP-UX 11.0, the HP-UX kernel has had a dynamic component to its nature. There are two parts to this dynamic behavior: Dynamically Loadable Kernel Modules (DLKM) and Dynamically Tunable Kernel Parameters (DTKP). With HP-UX 11i, we have seen a growth in the use of both.
DLKM allows us to load and unload kernel device drivers and subsystems without requiring a reboot. Come the day when every kernel driver and subsystem is dynamically loadable, we may never need to reboot a system in order to load patch. I said “may never need to reboot” because I can envisage a situation where a device driver managing some low-level IO functionality becomes corrupted. At that time, we might not be able to do anything other than reboot the system in order to clear the resulting system hang. The idea here is that we minimize, as much as possible, the necessity for rebooting our system just to add driver/subsystem functionality.
I am going to use a system that has a few DLKM modules installed. The installation of a DLKM is different from the management of a DLKM. The installation is normally taken care of by a swinstall command. After it is installed, a DLKM is ready to be loaded and used. Take an example where we have a (fictitious) widget interface card and associated widgedrv device driver from the Acme Corporation. To use and manage the widget interface card, we need to ensure that the widgedrv driver is installed and loaded. In the following example, I am using a real system and real files, but it is purely for demonstration purposes. I don't think the Acme Corporation sells a widget interface card for HP-UX, yet! Here's a summary of the process: We need to install the widgedrv DLKM device driver. This is normally in the form of a swinstall from the installation CD supplied by the Acme Corporation. If the Acme Corporation does not supply a swinstall-enabled installation CD, we would need to install the widgetdrv driver manually. The process of installing a DLKM can be summarized as follows:
Load at least three files onto your system:
A file called
system: localizable kernel parameters for this device driverA file called
master: global default setting for the device driverA file called
mod.o: relocatable object code; the actual device driver
Use the
kminstall –a widgedrvcommand to locate the above three files to their appropriate locations:root@hpeos003[] ll mod.o system master -rw-r--r-- 1 root sys 956 Nov 17 13:20 master -rw-r--r-- 1 root sys 7904 Nov 17 13:20 mod.o -rw-r--r-- 1 root sys 174 Nov 17 13:20 system root@hpeos003[] kminstall -a widgedrv root@hpeos003[]
This will locate the three files to the locations listed in Table 10-1.
root@hpeos003[] ll /stand/system.d/widgedrv
-rw-r--r--   1 root       sys    174 Nov 17 13:23 /stand/system.d/widgedrv
root@hpeos003[] ll /usr/conf/master.d/widgedrv
-rw-r--r--   1 root       sys    956 Nov 17 13:23 /usr/conf/master.d/widgedrv
root@hpeos003[] ll /usr/conf/km.d/widgedrv/
total 16
-rw-r--r--   1 root       sys   7904 Nov 17 13:23 mod.o
root@hpeos003[]
Compile the kernel module from the installed relocatable object file using the mk_kernel command:
root@hpeos003[] mk_kernel -M widgedrv
Generating module: widgedrv...

  Specified module(s) below is(are) activated successfully.
      widgedrv

root@hpeos003[] ll /stand/dlkm/mod.d
total 168
-rw-r--r--   1 root       sys           8528 Oct 31 20:25 krm
-rw-r--r--   1 root       sys          67544 Oct 31 20:25 rng
-rw-rw-rw-   1 root       sys           8648 Nov 17 13:35 widgedrv
root@hpeos003[] file /stand/dlkm/mod.d/widgedrv
/stand/dlkm/mod.d/widgedrv:     ELF-64 relocatable object file - PA-RISC 2.0 (LP
64)
root@hpeos003[]
root@hpeos003[] kmadmin -s
Name            ID      Status          Type
=====================================================
krm             1       UNLOADED        WSIO
rng             2       LOADED          WSIO
widgedrv        3       UNLOADED        WSIO
root@hpeos003[]
This is normally the stage at which a swinstall would leave the DLKM, i.e., it's ready to be loaded. Let's assume that we have installed the widget interface card (using OLA/R techniques). Before we can use the widget interface card, i.e., before we run ioscan and insf, we need to ensure that the DLKM is loaded. This is achieved by the kmadmin –L command:
root@hpeos003[] kmadmin -L widgedrv
kmadmin: Module widgedrv loaded, ID = 3
root@hpeos003[] kmadmin -s
Name            ID      Status          Type
=====================================================
krm             1       UNLOADED        WSIO
rng             2       LOADED          WSIO
widgedrv        3       LOADED          WSIO
root@hpeos003[]
root@hpeos003[] kmadmin -Q widgedrv
Module Name             widgedrv
Module ID               3
Module Path             /stand/dlkm/mod.d/widgedrv
Status                  LOADED
Size                    61440
Base Address            0xe28000
BSS Size                53248
BSS Base Address        0xe36000
Hold Count              1
Dependent Count         0
Unload Delay            0 seconds
Description             widgedrv
Type                    WSIO
Block Major             -1
Character Major         67
Flags                   a5

root@hpeos003[]
After running ioscan and insf, we could now use our new widget interface card.
Sometime later, we find that we need to patch the widgedrv device driver. The point is the interface card hasn't been working well. It keeps dropping widgets all over the network. We have organized with our users that we can unload the driver, which will render the card unusable during this time. We have received new versions of the system, master, and mod.o files from the Acme Corporation. Once unloaded, we can update the driver files, recompile the module, and load it again:
root@hpeos003[] ll system master mod.o
-rw-r--r--   1 root       sys           1056 Nov 17 13:49 master
-rw-r--r--   1 root       sys           8321 Nov 17 13:49 mod.o
-rw-r--r--   1 root       sys            206 Nov 17 13:49 system
root@hpeos003[] kmadmin -U widgedrv
kmadmin: Module 3 unloaded
root@hpeos003[] kmadmin -s
Name            ID      Status          Type
=====================================================
krm             1       LOADED          WSIO
rng             2       LOADED          WSIO
widgedrv        3       UNLOADED        WSIO
root@hpeos003[] kminstall -u widgedrv
root@hpeos003[] mk_kernel -M widgedrv
Generating module: widgedrv...

  Specified module(s) below is(are) activated successfully.
      widgedrv

root@hpeos003[] kmadmin -L widgedrv
kmadmin: Module widgedrv loaded, ID = 3
root@hpeos003[] kmadmin -s
Name            ID      Status          Type
=====================================================
krm             1       UNLOADED        WSIO
rng             2       LOADED          WSIO
widgedrv        3       LOADED          WSIO
root@hpeos003[]
This all happens without a reboot. It should be noted that while unloaded the device was effectively useless. The advantage of DLKM is that we massively improve the overall availability of our system by removing the need to reboot a system in order to update a device drive (load a kernel patch). HP Labs are currently working to ensure that more and more device drivers and subsystems are DLKMs. Currently, more device drivers and subsystems are statically linked than dynamic modules. As time passes, I am sure we will see that situation rectified.
The last part of the DLKM puzzle is to ask a fundamental question regarding the nature of our widgedrv device driver:
“Do we need the widgedrv device driver to boot HP-UX?”
If the answer to this question is yes, then we need to compile the widgedrv driver into the kernel as a static module using the kmsystem command (-c y = configure yes, -l n = loadable no):
root@hpeos003[stand] cp system system.prev
root@hpeos003[stand] kmsystem -c y -l n widgedrv
root@hpeos003[stand] mk_kernel
Generating module: krm...
Generating module: rng...
Compiling /stand/build/conf.c...
Generating module: widgedrv...
Loading the kernel...
Generating kernel symbol table...
root@hpeos003[stand]
root@hpeos003[stand] cp vmunix vmunix.prev
root@hpeos003[stand] cp -pr dlkm dlkm.vmunix.prev/
root@hpeos003[stand] kmupdate

  Kernel update request is scheduled.

  Default kernel /stand/vmunix will be updated by
  newly built kernel /stand/build/vmunix_test
  at next system shutdown or startup time.

root@hpeos003[stand]
We are now ready to reboot this system (using shutdown –ry now) with a static widgedrv device driver.
If the answer to the question “Do we need the widgedrv device driver to boot HP-UX?” were no, we would simply add a line to the /etc/loadmods file naming the widgedrv device driver.
root@hpeos003[stand] cat /etc/loadmods
rng
widgedrv
root@hpeos003[stand]
This will ensure that after every reboot, widgedrv is loaded automatically.
At present, the number of DTKPs is in a similar state to the number of DLKMs. Currently, there are more statically configured kernel parameters than dynamic ones. When we install HP-UX, the value of kernel parameters is sufficient to run HP-UX. As soon as we install a real-world application, we will commonly need to modify a series of kernel parameters. It's not for me to say which kernel parameters need updating. That's the job of your third-party application suppliers. In some unique situations, HP may suggest adjusting certain kernel parameters. Whoever prompts for a kernel parameter to be changed, we need to understand whether this will involve a reboot of our system. The easiest way to find out whether a parameter is dynamically tunable is to look at the third field of output from the kmtune command. If it says Y, it means the parameter is dynamically tunable:
root@hpeos003[] kmtune | awk '$3 ~/Y/ {print $0}'
core_addshmem_read          0  Y  0
core_addshmem_write         0  Y  0
maxfiles_lim             1024  Y  1024
maxtsiz             0x4000000  Y  0x04000000
maxtsiz_64bit      0x40000000  Y  0x0000000040000000
maxuprc                    75  Y  75
msgmax                   8192  Y  8192
msgmnb                  16384  Y  16384
scsi_max_qdepth             8  Y  8
semmsl                   2048  Y  2048
shmmax              0x4000000  Y  0X4000000
shmseg                    120  Y  120
root@hpeos003[]
If a chosen parameter is not in this list, then changing it will involve a reboot of the system. I have been requested to change a few kernel parameters; some are dynamic, and some aren't.
The list of parameters I am going to change are the following:
root@hpeos003[] kmtune -q nproc
Parameter             Current Dyn Planned                  Module     Version
=============================================================================
nproc                    2068  -  (20+8*MAXUSERS)
root@hpeos003[] kmtune -q dbc_max_pct
Parameter             Current Dyn Planned                  Module     Version
=============================================================================
dbc_max_pct                50  -  50
root@hpeos003[] kmtune -q create_fastlinks
Parameter             Current Dyn Planned                  Module     Version
=============================================================================
create_fastlinks            0  -  0
root@hpeos003[] kmtune -q maxuprc
Parameter             Current Dyn Planned                  Module     Version
=============================================================================
maxuprc                    75  Y  75
root@hpeos003[]
As you can see, only the last parameter is a DTKP. That's just the way it is. I will change these parameters to the values I have been informed are appropriate for my system:
root@hpeos003[] kmtune -s nproc=5192
root@hpeos003[] kmtune -s dbc_max_pct=20
root@hpeos003[] kmtune -s create_fastlinks=1
root@hpeos003[] kmtune -s maxuprc=1024
root@hpeos003[]
With a single command, I can now dynamically update as many of these parameters as is possible:
root@hpeos003[] kmtune -u
WARNING: create_fastlinks cannot be set dynamically.
WARNING: dbc_max_pct cannot be set dynamically.
The kernel's value of maxuprc has been set to 1024 (0x400).
WARNING: nproc cannot be set dynamically.
root@hpeos003[] kmtune -d
Parameter             Current Dyn Planned                  Module     Version
=============================================================================
create_fastlinks            0  -  1
dbc_max_pct                50  -  20
nproc                    2068  -  5192
root@hpeos003[]
root@hpeos003[] kmtune -q maxuprc
Parameter             Current Dyn Planned                  Module     Version
=============================================================================
maxuprc                  1024  Y  1024
root@hpeos003[]
As you can see, maxuprc has been dynamically changed while the others will require us to rebuild the kernel and reboot the system in order to effect the change. If there was some mistake with these parameters, I can reset them to the factory defaults with the kmtune –r command.
root@hpeos003[] kmtune -r nproc
root@hpeos003[] kmtune -q nproc
Parameter             Current Dyn Planned                  Module     Version
=============================================================================
nproc                    2068  -  (20+8*MAXUSERS)
root@hpeos003[]
I won't go through the process of building a new kernel; you've seen that earlier. Just a reminder to always keep a copy of a backup kernel in case the changes you made here produce a kernel that is not capable of booting.
The kcweb utility is now available for all versions of HP-UX 11i. It is available as a free download from http://software.hp.com. It is a Web-based tool allowing you to monitor and makes changes to your kernel via a web interface. The installation is simplicity itself; it doesn't require a reboot:
root@hpeos003[] swlist -s /tmp/Casey_11.11.depot
# Initializing...
# Contacting target "hpeos003"...
#
# Target:  hpeos003:/tmp/Casey_11.11.depot
#

#
# Bundle(s):
#

  Casey         B.00.03        HP-UX KernelConfig (Kernel Configuration)
root@hpeos003[] swinstall -s /tmp/Casey_11.11.depot Casey

=======  11/17/03 16:00:21 GMT  BEGIN swinstall SESSION
         (non-interactive) (jobid=hpeos003-0081)

       * Session started for user "root@hpeos003".

       * Beginning Selection
...
NOTE:    More information may be found in the agent logfile using the
         command "swjob -a log hpeos003-0081 @ hpeos003:/".

=======  11/17/03 16:00:23 GMT  END swinstall SESSION (non-interactive)
         (jobid=hpeos003-0081)

root@hpeos003[]
When we start the kcweb daemon(s), it will start two apache Web server daemons listening on port 1188. The httpd.conf configuration file it uses lives under /opt/webadmin/conf/httpd.conf.
root@hpeos003[] kcweb
Creating server certificates...
Certificates successfully created.
Attempting to start server...
Server successfully started.
Attempting to find an existing browser...
    SECURITY WARNING: starting a browser in the current environment
    may open you to security risks. This is the case when the
    X Server and the browser are on different systems. Since kcweb
    cannot guarantee a secure browser is available, you may:
    .  Paste the URL https://hpeos003:1188/cgi-bin/kcweb/top.cgi
       into a browser.
    .  Close any non-local instances of Netscape on 192.168.0.70
       and rerun kcweb.
    .  Use kcweb with the "-F" (force) option.

    There is either one or more instances of Netscape running on
    192.168.0.70 that is not local, or Netscape cannot
    be started in a secure mode because the X Server is not on
    the same machine as the display variable.
root@hpeos003[]
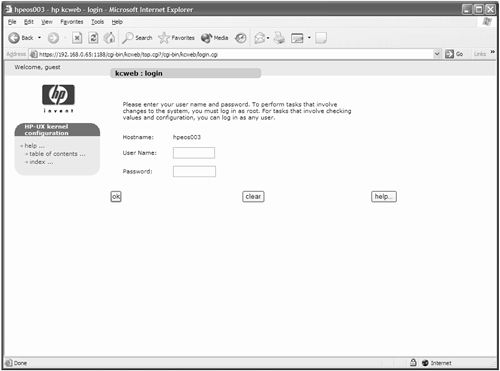
This message is displayed because the default behavior of kcweb is to start up the daemon processes and to launch a client Web browser. I am connected from my PC through X-Windows emulation software, and kcweb has detected that I have my DISPLAY variable set. If you want to simply start up the Web server without attempting to start a client browser, use the command kcweb –s startssl. The messages will not stop me from browsing on my local PC. When I do, I will be asked to verify the certificates issued by the kcweb server. When complete, I will presented with a login screen (see Figure 10-1).
The interface is intuitive and easy to navigate, as you can imagine. kcweb comes with a bolt-on kernel resource monitor for the EMS subsystem, allowing us to set up alarms to trigger when certain kernel parameters reach certain thresholds. After every reboot, the kcmond daemon is started up to monitor a series of kernel parameters. Being an EMS monitor means that we can integrate resource monitoring into other applications such as the OpenView products and Serviceguard. I particularly like the idea of setting up a Serviceguard resource that monitors a series of critical kernel resources. Should all the resource exceed their threshold, Serviceguard will move an application package to an adoptive node, under the premise that this machine doesn't have enough resources to sustain running this application. Using either the Web interface or via the kcalarm command, I can set up a series of alarms whereby notification is sent to various places (email, SNMP, and so on) whenever a kernel resource breaches a defined threshold. In this way, we can be pre-warned before a particular kernel resource overflows. Figure 10-2 shows a screen where I have logged in and clicked on the nproc kernel parameter:
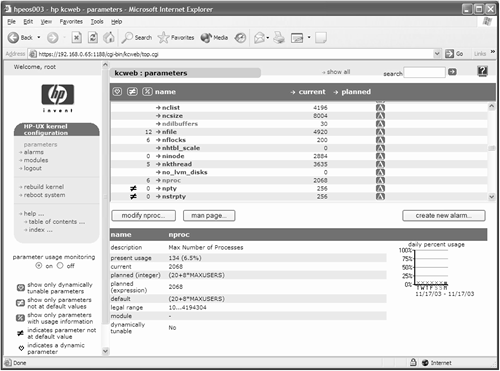
On the bottom right, you can see a small graph of parameter usage over the last week. You can extract this information from the logfiles maintained by the kcmond daemon in the directory /var/adm/kcmond/ either using the browser or using the kcusage command (you can display hourly, daily, monthly, or yearly data):
root@hpeos003[] kcusage -h nproc
Parameter:      nproc
Setting:        2068
Time                           Usage      %
=============================================
Mon 11/17/03 16:20 GMT           153    7.4
Mon 11/17/03 16:25 GMT            57    2.8
Mon 11/17/03 16:30 GMT            57    2.8
Mon 11/17/03 16:35 GMT            57    2.8
Mon 11/17/03 16:40 GMT            57    2.8
Mon 11/17/03 16:45 GMT             -      -
Mon 11/17/03 16:50 GMT           127    6.1
Mon 11/17/03 16:55 GMT           127    6.1
Mon 11/17/03 17:00 GMT           127    6.1
Mon 11/17/03 17:05 GMT           127    6.1
Mon 11/17/03 17:10 GMT           139    6.7
Mon 11/17/03 17:15 GMT           132    6.4
root@hpeos003[]
I won't go through every screen in kcweb because it's all intuitive. The only problem I had was that the kcweb Web server was not started up by default after a reboot and there is no startup script supplied. I think the idea is that the first time you need the Web server is when you actually run the kcweb command from the command line. I would have preferred a startup script that ran the command kcweb –s startssl. This will start the Web server, which will not die (unlike the Web server started by the simple kcweb command) until the system is rebooted or we explicitly kill it with the kcweb –s stop command.
There isn't a huge amount of documentation supplied with kcweb because it's straightforward and uncomplicated. There are man pages for the various commands, and the Web interface has a host of online documentation about various kernel parameters and tasks to be performed.
In this section, we talk about various diagnostic tools and utilities we can use to monitor general system activity. We don't go into the detail of individual processes (that's for the next chapter); we just keep the discussion at the system application level, e.g., networking, LVM, disks, memory—the level of monitoring that includes hardware diagnostics, monitoring the state of various hardware, software, and firmware resources. There are various tools and utilities that come with HP-UX that allow us to monitor general system activity, everything from syslogd and other standard logfiles to Event Monitoring System (EMS), to Support Tools Manager (STM) diagnostics. We look at utilizing all of these facilities to ensure that we are aware of what is happening on our system in relation to general hardware and software issues. Like most diagnostic/logging facilities, there is usually lots of information produced that goes unread. I hope that we can automate a number of these tasks to notify us only when something interesting and untoward happens.
The most commonly used facility for trapping hardware and software errors is syslogd. Unfortunately, because so many facilities use syslogd, the resulting logfile, /var/adm/syslog/syslog.log, commonly becomes overloaded with so much information that you can't decipher what is really happening. One of the first things I like to do is to separate all the networking information (except the mail system) away from syslog.log into a separate file. When a subsystem sends a message to the syslogd daemon, the message is tagged with a priority. The priority is made up of two dot-separated components—a facility and a level. The facility is intended to identify the subsystem that sent the message. The level indicates the urgency of the message. Table 10-2 shows a quick reminder of the different facility and level definitions we can use in syslog.conf:
Table 10-2. syslogd Facility and Level Definitions
Facility | Description | Level | Description |
|---|---|---|---|
kern | Messages generated by the kernel | emerg | A panic situation; this level of message |
user | Messages generated by random user processes | alert | A situation that should be corrected quickly |
The mail system | crit | Critical errors such as disk drive failures | |
daemon | System daemons such as networking daemons | err | General errors |
auth | The authentication subsystem, e.g., login, su, etc. | warning | Warning messages |
syslog | Internal messages generated by syslogd | notice | Not an error, but worth taking notice of |
lpr | The spooler | info | Information message |
news | The news system | debug | Information usually only seen when debugging programs |
uucp | The UUCP system | ||
cron | Message from the cron daemon | ||
local0 | Reserved for local use, e.g., user applications |
Most networking daemons use the daemon facility. If we are going to store networking-related messages into a separate file, the first thing we need to do is to decide at what level we want to start capturing data. As we are capturing information from daemons such as telnetd, inetd, ftpd, remshd, it might be appropriate to capture everything above the info level. It is this pairing of a facility and a level that syslog uses to decide what to do with messages. We have decided to send all message from the daemon facility at a level of info and above to a separate logfile. Here are the changes we need to make to syslogd's configuration file /etc/syslog.conf:
root@hpeos003[] vi /etc/syslog.conf
# @(#)B.11.11_LR
#
# syslogd configuration file.
#
# See syslogd(1M) for information about the format of this file.
#
mail.debug              /var/adm/syslog/mail.log
daemon.info             /var/adm/syslog/netdaemon.log
*.info;mail.none;daemon.none    /var/adm/syslog/syslog.log
*.alert                 /dev/console
*.alert                 root
*.emerg                 *
root@hpeos003[]
The first highlighted line defines what to do with messages coming from the daemon facility at the info level and above. The last part of the line defines what to do with the messages. The destination for a message can either be of the following:
A filename, beginning with a slash (it must be a fully qualified filename).
A hostname prefixed by the
@symbol. Messages will be directed to thesyslogdprocess on the name host, which can decide what to do with the messages depending on how thesyslogd.conffile has been configured. Try to avoid creating asyslogdnetwork loop where messages are sent from host to host to host in a continuous loop. It's not too clever.A comma-separated list of users who will receive a message on their console.
An asterisk means every user currently logged in will receive a message on the terminal. Use of user names and an asterisk should be limited to important messages.
A filename tells syslogd the name of the file (to open in append mode) we want to use. We don't need to create this file; syslogd will create it when we signal syslogd to reread its configuration file. The second highlighted line is as important as this entry that cancels (a level of none) all daemon messages going to the syslog.log file. Without this daemon, messages would go to syslog.log as well (notice the facility is set to *, which means all facilities). All that's left to do is to send the running syslogd process an HUP signal:
root@hpeos003[] kill -HUP $(cat /var/run/syslog.pid)
root@hpeos003[] cd /var/adm/syslog
root@hpeos003[syslog] ll *log
-rw-r--r--   1 root       root          7114 Nov 17 16:27 OLDsyslog.log
-r--r--r--   1 root       root        189454 Nov 17 16:51 mail.log
-r--r--r--   1 root       root             0 Nov 17 21:58 netdaemon.log
-rw-r--r--   1 root       root          6077 Nov 17 21:58 syslog.log
root@hpeos003[syslog] date
Mon Nov 17 21:58:46 GMT 2003
root@hpeos003[syslog]
As you can see, syslogd has created my new logfile. All my networking daemons should now have info messages (and above) directed to this new logfile. I just telnet to myself to test it out (assuming that inetd logging has been enabled):
root@hpeos003[syslog] telnet localhost
Trying...
Connected to localhost
Escape character is '^]'.
Local flow control on
Telnet TERMINAL-SPEED option ON

HP-UX hpeos003 B.11.11 U 9000/800 (ta)

login: root
Password:
Please wait...checking for disk quotas
(c)Copyright 1983-2000 Hewlett-Packard Co., All Rights Reserved.
(c)Copyright 1979, 1980, 1983, 1985-1993 The Regents of the Univ. of California
...

Value of TERM has been set to "dtterm".
WARNING:  YOU ARE SUPERUSER !!

root@hpeos003[] ll /var/adm/syslog/netdaemon.log
-r--r--r--   1 root       root           116 Nov 17 22:03 /var/adm/syslog/netdaemon.log
root@hpeos003[] cat /var/adm/syslog/netdaemon.log
Nov 17 22:03:14 hpeos003 inetd[4003]: telnet/tcp: Connection from localhost (127.0.0.1) at Mon Nov 17 22:03:14 2003
root@hpeos003[]
That seems to be working fine.
If we want to utilize syslog messaging to notify and store certain events from our applications, we can use the logger command to send a message, at a given priority to the syslogd daemon:
root@hpeos003[] logger -t FINANCE -p daemon.crit "Finance Database Corrupt"
root@hpeos003[] tail /var/adm/syslog/netdaemon.log
...
Nov 18 00:43:31 hpeos003 FINANCE: Finance Database Corrupt
root@hpeos003[]
One last thing. If you have to place a software call with your local Response Center, inform them that you have moved the daemon syslog entries to a different file. Otherwise, it just gets confusing as an engineer to have a whole chunk of information missing from syslog.log.
Every time the system is rebooted, the startup sequence for syslog (/sbin/init.d/syslogd) will rename the old syslog.log file to OLDsyslog.log. We need to decide what to do with the logfile we have just created. It is probably a good idea that we manage the logfile in a similar way to syslog, in other words, keep a copy of the logfile every time the system reboots. I suggest that you not change the /sbin/init.d/syslogd file because this file may change anytime you apply a patch or an operating system update. We could add an additional startup routine into /sinb/rc2.d. syslog uses the sequence number of S220 (currently). We could add a startup script jus after that, possibly S225. Here are my guidelines for writing a script to manage any new logfiles created by syslog.
Keep a copy of the current logfile.
Zero-length the current logfile by using the shell “
>” operator.Send
syslogdanHUPsignal to ensure that the daemon reads any changes to its configuration file.Do not use the
rmcommand to delete the logfile oncesyslogdis running. Thesyslogddaemon will have the inode for the file open. Deleting the file simply removes the filename from the directory, andsyslogdcontinues to write to disk blocks in the filesystem. As you don't have a filename anymore, you will not be able to read any of these messages. To rectify this, sendsyslogdanHUPsignal (this will release the filesystem blocks for the deleted file).
Trying to keep our systems up and running is a difficult enough task without hardware failing on us with no warning. EMS gives us the ability to set up hardware monitors that continuously check the status of numerous hardware components. Certain thresholds we set will determine how EMS views an event. An event is some form of unusual activity for the monitored device to experience, e.g., a SCSI reset on a disk drive. EMS uses a series of monitor daemons that keep track of the status of various resources. The current list of monitors can be found in the EMS dictionary (a series of descriptive files in the /etc/opt/resmon/dictionary directory). The .dict files in this directory describe the various monitors currently available, including the pathname to the monitoring daemon itself, as well as any command line arguments that you want to pass to it. The daemons will monitor a whole range of resources. Resources are organized into a structure similar to a filesystem in order to group resources together. We can navigate around this resource hierarchy using the resls command. Whenever we want to send a request to a monitor daemon, a registrar process will communicate between the user interface and the relevant monitor daemon. When a monitor detects an event, it will send an appropriate message to a particular destination using a configured delivery method. This could be an email message to a user, a message written on the system console, syslog, or even an SNMP trap sent to an OpenView Network Node Manager machine.
An additional part of EMS is something called the Peripheral Status Monitor (PSM). Whenever an event occurs, an EMS monitor will detect the event and report it accordingly. The hardware monitor has no memory as such; it simply reports the event and goes back to monitoring. To the hardware monitor, the event is temporary in that it happens, it gets reported, it moves on. For utilities such as Serviceguard, this is not enough. Serviceguard needs to know the hardware status of a resource; it wants to know whether the LAN card is up or down. Hardware status monitoring is an extension to Hardware event monitoring. It is the job of the Peripheral Status Monitor (psmctd and psmmon daemons) to notify EMS of the change of state of a resource. The hardware monitor will pass on an event to the Peripheral Status Monitor, which will convert the severity of the event into a device status. This will be passed to EMS, which will pass this information on to applications such as Serviceguard. From the hardware status, Serviceguard can take any appropriate actions such as moving an application package to another (adoptive) node.
Last, we have EMS HA Monitors. These are additional EMS resources that have their own monitor processes over and above the basic hardware monitors. These monitors are designed to assist High Availability applications such as Serviceguard to understand the overall state of a system. EMS HA Monitors go beyond the basic hardware monitors provided by EMS on its own. Examples of EMS HA Monitors include how full particular filesystems are and the status of certain kernel parameters. EMS HA Monitors can be configured to send notification messages in the same way as basic hardware monitors and can interface with the Peripheral Status Monitor in order to maintain the state of a resource.
This is the basic framework EMS operates in.
EMS is installed as part of the Support Tools Manager online diagnostics product (Supp-Tool-Mgr). The most recent version is supplied with the quarterly published Support Plus CD/DVD, or it can be downloaded from the Web site http://software.hp.com/SUPPORTPLUS.
Events have a Criteria Threshold (known as a severity) assigned to them by the monitors themselves. The application developer who designed and wrote the monitor defines the Criteria Threshold for each event. In some ways, the Criteria Threshold can be thought of as similar in principle to a syslog priority. We can use the Criteria Threshold to decide where to send a message. There are five Criteria Thresholds with which a message can be tagged:
INFORMATION
MINOR WARNING
MAJOR WARNING
SERIOUS
CRITICAL
By default, EMS will send messages to three main destinations:
Most hardware monitors that produce an event with a severity greater than or equal of MAJOR WARNING are sent to
syslogvia an email to therootuser.Events with a severity greater than or equal to INORMATION are sent to the text file
/var/opt/resmon/log/event.log.
The interface to managing basic hardware monitors is the menu interface /etc/opt/resmon/lbin/monconfig. Before using monconfig, it is worthwhile to navigate around the Resource Hierarchy using the resls command.
The resls command allows you to navigate through the entire resource hierarchy, so we may find resources that are part of the EMS HA Monitor package and can't be managed via monconfig. Here's an example:
root@hpeos003[] resls /
Contacting Registrar on hpeos003

NAME:   /
DESCRIPTION:    This is the top level of the Resource Dictionary
TYPE:   / is a Resource Class.

There are 7 resources configured below /:
Resource Class
        /system
        /StorageAreaNetwork
        /adapters
        /connectivity
        /cluster
        /storage
        /net
root@hpeos003[] resls /system
Contacting Registrar on hpeos003

NAME:   /system
DESCRIPTION:    System Resources
TYPE:   /system is a Resource Class.

There are 9 resources configured below /system:
Resource Class
        /system/jobQueue1Min
        /system/kernel_resource
        /system/numUsers
        /system/jobQueue5Min
        /system/filesystem
        /system/events
        /system/jobQueue15Min
        /system/kernel_parameters
        /system/status
root@hpeos003[]
We can see that resls has found a number of resource classes, one being called system. Under this resource class, you'll find resource classes such as filesystem, events, and kernel_parameters. There is no way to tell from here which are basic hardware monitors and which are HA Monitors. The only way to find out is to use the monconfig command. Before we look at monconfig, a quick word on the resls command. While we are getting used to the extent of our resource hierarchy, we will have to persevere with resls in that it doesn't have a recursive option whereby you can get the command to list every resource in every resource class. Here's the monconfig command:
root@hpeos003[] /etc/opt/resmon/lbin/monconfig


============================================================================
===================       Event Monitoring Service       ===================
===================      Monitoring Request Manager      ===================
============================================================================

  EVENT MONITORING IS CURRENTLY ENABLED.
  EMS Version : A.03.20.01
  STM Version : A.42.00

============================================================================
==============      Monitoring Request Manager Main Menu      ==============
============================================================================

Note: Monitoring requests let you specify the events for monitors
      to report and the notification methods to use.

Select:
   (S)how monitoring requests configured via monconfig
   (C)heck detailed monitoring status
   (L)ist descriptions of available monitors
   (A)dd a monitoring request
   (D)elete a monitoring request
   (M)odify an existing monitoring request
   (E)nable Monitoring
   (K)ill (disable) monitoring
   (H)elp
   (Q)uit
   Enter selection: [s]
This is the main menu for managing the basic hardware monitors. We can add, modify, and delete monitors and what type of notification they will use. You need to know which monitor you are interested in before navigating through the screens. I will cut down much of the screen output in order to show you how to set up a basic hardware monitor:
  Enter selection: [s] a


...
  20) /storage/events/disk_arrays/High_Availability
  21) /system/events/cpu/lpmc
  22) /adapters/events/scsi123_em
  23) /system/events/system_status
   Enter monitor numbers separated by commas
      {or (A)ll monitors, (Q)uit, (H)elp} [a] 21

Criteria Thresholds:
   1) INFORMATION    2) MINOR WARNING    3) MAJOR WARNING
   4) SERIOUS        5) CRITICAL
   Enter selection {or (Q)uit,(H)elp} [4] 1

Criteria Operator:
   1) <      2) <=      3) >      4) >=      5) =      6) !=
   Enter selection {or (Q)uit,(H)elp} [4] 4

Notification Method:
   1) UDP        2) TCP        3) SNMP       4) TEXTLOG
   5) SYSLOG     6) EMAIL      7) CONSOLE
   Enter selection {or (Q)uit,(H)elp} [6] 7

User Comment:
   (C)lear   (A)dd
   Enter selection {or (Q)uit,(H)elp} [c] a

   Enter comment: [] Information : LPMC Reported

Client Configuration File:
   (C)lear   (A)dd
   Use Clear to use the default file.
   Enter selection {or (Q)uit,(H)elp} [c] c

New entry:
      Send events generated by monitors
        /system/events/cpu/lpmc
      with severity >= INFORMATION to CONSOLE
      with comment:
        Information : LPMC Reported


   Are you sure you want to keep these changes?
      {(Y)es,(N)o,(H)elp} [n] y

  Changes will take effect when the diagmond(1M) daemon discovers that
  monitoring requests have been modified.  Use the 'c' command to wait for
  changes to take effect.


============================================================================
==============      Monitoring Request Manager Main Menu      ==============
============================================================================

Note: Monitoring requests let you specify the events for monitors
      to report and the notification methods to use.

Select:
   (S)how monitoring requests configured via monconfig
   (C)heck detailed monitoring status
   (L)ist descriptions of available monitors
   (A)dd a monitoring request
   (D)elete a monitoring request
   (M)odify an existing monitoring request
   (E)nable Monitoring
   (K)ill (disable) monitoring
   (H)elp
   (Q)uit
   Enter selection: [s]
In this example, I have set up a monitor such that any messages greater than or equal to the INFORMATION severity for the /system/events/cpu/lpmc resource will be sent to the system console with a comment “Information: LPMC Reported”.
The interface for managing PSM and HA Monitors is SAM. SAM will run the EMS GUI, allowing us to set up notifications for additional EMS monitors. From SAM's Main Menu, we navigate to Resource Management−Event Monitoring System. From the main screen, I can Add Monitoring Request (under the Actions menu item) for a resource, answering similar questions as the questions posed by monconfig (see Figure 10-3):
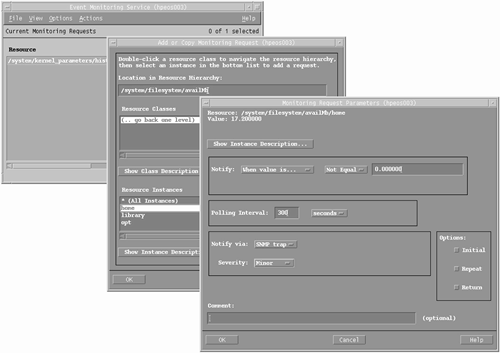
I don't need to tell you how to navigate through SAM. One option to watch is the Options on the lower-right side of the screen. These options will determine additional conditions when you will be notified, i.e., Initial = the initial time the condition is met, Repeat = every time the condition is met, and Return = when the condition is no longer met. You can choose multiple Options.
You may be able to see in Figure 10-3 that there appear to be some EMS monitors already set up on this system. If you install the kcweb utility, it can be configured to use EMS monitors to track the historical behavior of kernel parameters.
Support Tools Manager (STM) is a series of offline and online diagnostics allowing you to perform a number of tests on hardware components. STM also comes with a number of diagnostic monitoring daemons that will record activity coming from hardware components. The vast majority of the STM functionality is password protected, as many of the diagnostic tests are destructive, e.g., to read/write test on disk drives. The only time we get involved with STM diagnostics is when we suspect that we may have a hardware error with a particular component, e.g., memory, CPU, or a disk. By running an information test on a component, we can gather any errors trapped by the component. In addition, we can look at diagnostic logfiles maintained by the diagnostic daemons to help us glean any further information regarding the behavior of our system. It should be noted that we are not trying to make you into a hardware engineer. This information will assist you in putting together a picture of what might be happening on your system. If you suspect that you have a hardware problem on your system, you should contact your local Response Center for further assistance.
We look at some features of STM that can give us insight into some other hardware monitoring that takes place on our system.
The Support Tools Manager (STM) is installed from the quarterly Support Plus CD/DVD, or it is available from the web site http://software.hp.com/SUPPORTPLUS. The STM diagnostic daemons constantly monitor system hardware for any activity. Whenever something is reported to the daemon, it simply records the information in a diagnostic logfile under the directory /var/stm/logs. The primary logging daemon diaglogd will maintain a series of binary logfiles under the /var/stm/logs/os/ directory. If we have lots of hardware errors, the logfiles in this directory will grow considerably. We have STM commands whereby we can manage these logfiles. Other daemons include memlogd that monitors for memory errors and cclogd that monitors and records Chassis Logs. Chassis logs are log records generated by various system hardware, software, and firmware. The overall diagnostic management daemon is the diagmond. Each daemon has a man page if you require any more information. We look at how to read the various logfiles created by these daemons.
There are three interfaces to STM: a GUI (xstm), a MUI (mstm), and a CLUI (cstm). To make capturing screen output easier, I use the command-line user interface, cstm. The job of looking at logfiles in STM is under the banner of running an STM utility (ru command). From there, we select the most recent raw logfile (sr command), format the raw logfile (fr command), and then display the formatted logfile (fl command). This detailed report we can save to a disk file for further analysis. Here goes:
root@hpeos003[] cstm
Running Command File (/usr/sbin/stm/ui/config/.stmrc).

-- Information --
Support Tools Manager


Version A.42.00

Product Number B4708AA

(C) Copyright Hewlett Packard Co. 1995-2002
All Rights Reserved

Use of this program is subject to the licensing restrictions described
in "Help-->On Version".  HP shall not be liable for any damages resulting
from misuse or unauthorized use of this program.

cstm>ru
-- Run Utility --
Select Utility
    1 MOutil
    2 logtool
Enter selection : 2

-- Logtool Utility --
To View a Summary of Events in a Raw Log

  1. Select a raw (unformatted) log file.  (File Menu -> "Select Raw")
     The current log file ends in ".cur", e.g., "log1.raw.cur".
     You do not have to switch logs.

  2. View the summary of the selected log file. (View Menu -> "Raw Summary")

To Format a Raw Log

  1. Set the format filter for the types of entries you want to see.
     (Filters Menu -> "Format").  To see all entries, skip this step.

  2. Format the raw log file. (File Menu -> "Format Raw")

  3. Display the formatted file. (View Menu -> "Formatted Log")

  4. To further narrow the entries displayed, set a display filter.
     (Filters Menu -> "Display" -> "Formatted")

For more information, use the on-line help (Help Menu -> "General help").

Logtool Utility> sr
-- Logtool Utility:  Select Raw Log File --

Select a raw log file or files to view, format or filter.
[/var/stm/logs/os/log2.raw.cur]
Path: /var/stm/logs/os/
File Name:log2.raw.cur

-- Converting a (784) byte raw log file to text. --
Preparing the Logtool Utility: View Raw Summary File ...

.... hpeos003  :  192.168.0.65 ....

-- Logtool Utility: View Raw Summary --

Summary of: /var/stm/logs/os/log2.raw.cur

  Date/time of first entry:    Wed Nov 12 22:38:32 2003

  Date/time of last  entry:    Wed Nov 12 22:38:32 2003


  Number of LPMC entries:               0
  Number of System Overtemp entries:    0
  Number of LVM entries:                0
  Number of Logger Event entries:       1

  Number of I/O Error entries:          32


    Device paths for which entries exist:

       (32)  0/0/1/0.4.0
-- Logtool Utility: View Raw Summary --
View   - To View the file.
Print  - To Print the file.
SaveAs - To Save the file.
Enter Done, Help, Print, SaveAs, or View: [Done] <cr>
Select Raw processing file /var/stm/logs/os/log2.raw.cur
Number of entries analyzed is 1.
Number of entries analyzed is 33.
The Select Raw operation completed.

The Display Raw Summary operation is currently in progress.

Display of the raw log file summary was successful.

Logtool Utility>fr
-- Logtool Utility:  Format Raw Log File --

Select a directory into which to place the formatted file:
Directory: [/var/stm/logs/os/]

The Format Raw operation is currently in progress.

Entries processed is 1 of 33 total entries; entries formatted is 1.
Entries processed is 33 of 33 total entries; entries formatted is 33.
The Format Raw operation completed successfully. The following raw log file(s)
were formatted into /var/stm/logs/os/log2.fmt4:

      /var/stm/logs/os/log2.raw.cur

The Display Formatted Summary operation is currently in progress.

-- Converting a (1116) byte raw log file to text. --
Preparing the Logtool Utility: View Formatted Summary File ...

.... hpeos003  :  192.168.0.65 ....

-- Logtool Utility: View Formatted Summary --

Summary of:           /var/stm/logs/os/log2.fmt4
Formatted from:       /var/stm/logs/os/log2.raw.cur


  Date/time of first entry:    Wed Nov 12 22:38:32 2003

  Date/time of last  entry:    Wed Nov 12 22:38:32 2003


  Number of LPMC entries:               0
  Number of System Overtemp entries:    0
  Number of LVM entries:                0
  Number of Logger Event entries:       1

  Number of I/O Error entries:          32


    Device paths for which entries exist:
-- Logtool Utility: View Formatted Summary --
View   - To View the file.
Print  - To Print the file.
SaveAs - To Save the file.
Enter Done, Help, Print, SaveAs, or View: [Done] <cr>
Display of the formatted log file summary was successful.

Logtool Utility>fl
The Display Formatted Log operation is currently in progress.

-- Converting a (100176) byte raw log file to text. --
Preparing the Logtool Utility: View Formatted Log File ...

.... hpeos003  :  192.168.0.65 ....

-- Logtool Utility: View Formatted Log --

Formatted Output of:  /var/stm/logs/os/log2.fmt6
Formatted from:       /var/stm/logs/os/log2.raw.cur

  Date/time of first entry:    Wed Nov 12 22:38:32 2003

  Date/time of last  entry:    Wed Nov 12 22:38:32 2003


Display Filters:

    Starting Date: Wed Nov 12 22:38:32 2003

    Ending Date:   Wed Nov 12 22:38:32 2003


=-+-=-+-=-+-=-+-=-+-=-+-=-+-=-+-=-+-=-+-=-+-=-+-=-+-=-+-=-+-=-+-=-+-=-+-=-+-=


Entry Type:  I/O Error
-- Logtool Utility: View Formatted Log --
View   - To View the file.
Print  - To Print the file.
SaveAs - To Save the file.
Enter Done, Help, Print, SaveAs, or View: [Done] SA
-- Save Logtool Utility: View Formatted Log --
Logtool Utility: View Formatted Log File
Path: /
File Name:/tmp/logtool.18Nov03

Enter Done, Help, Print, SaveAs, or View: [Done]
Display of the formatted log file was successful.

Logtool Utility>
If I exit all the way out of cstm, I can view the formatted logfile just created:
root@hpeos003[] more /tmp/logtool.18Nov03
.... hpeos003  :  192.168.0.65 ....

-- Logtool Utility: View Formatted Log --

Formatted Output of:  /var/stm/logs/os/log2.fmt6
Formatted from:       /var/stm/logs/os/log2.raw.cur

  Date/time of first entry:    Wed Nov 12 22:38:32 2003

  Date/time of last  entry:    Wed Nov 12 22:38:32 2003

Display Filters:

    Starting Date: Wed Nov 12 22:38:32 2003

    Ending Date:   Wed Nov 12 22:38:32 2003


=-+-=-+-=-+-=-+-=-+-=-+-=-+-=-+-=-+-=-+-=-+-=-+-=-+-=-+-=-+-=-+-=-+-=-+-=-+-=


Entry Type:  I/O Error
Entry logged on Wed Nov 12 22:38:32 2003
Entry id: 0x3fb2b66800000011

    Device Path:        0/0/1/0.4.0
    Product:            SCSI Disk
    Product Qualifier:  HP73.4GST373307LC
    Logger:             sdisk
    Device Type:        Disk
    Device Qualifier:   Hard

---------------------------------------------------------------------------


Description of Error:

     The device was not ready to process requests, initialization is required.
     This I/O request and all subsequent I/O requests directed to this device
     will not be processed.

Probable Cause / Recommended Action:

     The device may have been powered off and may be being powered on.
...
root@hpeos003[]
As you can imagine, this file can be some considerable size on a system that is having numerous hardware problems. Within the Logtool Utility, you can use the SwitchLog (sl) command to switch to a new raw logfile, allowing you to archive the current raw logfile.
Other logfiles we can look at from within Logtool include the memory logfile. We use the vd (view detail) command and save the output to a logfile:
Logtool Utility>vd
Formatting of the memory error log is in progress.

-- Converting a (208) byte raw log file to text. --
Preparing the Logtool Utility: View Memory Report File ...

.... hpeos003  :  192.168.0.65 ....

-- Logtool Utility: View Memory Report --

System Start Time         Thu Jan  1 00:00:00 1970

Last Error Check Time     Tue Nov 18 02:36:30 2003

Logging Time Interval     3600


   NOTE:  There are no error entries in the Memory Log file.
-- Logtool Utility: View Memory Report --
View   - To View the file.
Print  - To Print the file.
SaveAs - To Save the file.
Enter Done, Help, Print, SaveAs, or View: [Done] SA
-- Save Logtool Utility: View Memory Report --
Logtool Utility: View Memory Report File
Path: /
File Name:/tmp/memlog.18Nov03

Enter Done, Help, Print, SaveAs, or View: [Done]
Display of the Memory Report Log with all memory errors was successful.

Logtool Utility>
Similarly for the Chassis logs, we can look at the Chassis Boot logs (cb command) and the Chassis Error logs (ce command), and save the output to a text file. You can explore these commands yourself.
The other important task we can perform with STM is to run an information diagnostic on a hardware component. Lots of components will record information such as errors or status information; processors store a previous tombstone in the Processor Information Module (PIM), memory records any pages deallocated in the Page Deallocation Table (PDT), and disks record the number of recoverable and unrecoverable errors. In a similar manner to Logtool, once we have run the information diagnostic, we can store the output to a text file. When we first run cstm, we need to display a map of all the devices in the system (map command). We can then select an individual device (sel dev <device number> command) or select an entire class of device (sc command). Once we have selected the device(s), we run the information diagnostic (info command) and then display the information diagnostic logfile (infolog command). Let's look at an example of performing an information diagnostic on memory:
root@hpeos003[] cstm
Running Command File (/usr/sbin/stm/ui/config/.stmrc).

-- Information --
Support Tools Manager


Version A.42.00

Product Number B4708AA

(C) Copyright Hewlett Packard Co. 1995-2002
All Rights Reserved

Use of this program is subject to the licensing restrictions described
in "Help-->On Version". HP shall not be liable for any damages resulting
from misuse or unauthorized use of this program.

cstm>map
                             hpeos003

  Dev                                                 Last        Last Op
  Num  Path                 Product                   Active Tool Status
  ===  ==================== ======================= =========== =============
    1  system               system ()
    2  0                    Bus Adapter (582)
    3  0/0                  PCI Bus Adapter (782)
    4  0/0/0/0              Core PCI 100BT Interface
    5  0/0/1/0              PCI SCSI Interface (10000
    6  0/0/1/1              PCI SCSI Interface (10000
    7  0/0/1/1.15.0         SCSI Disk (HP36.4GST33675
    8  0/0/2/0              PCI SCSI Interface (10000
    9  0/0/2/0.2.0          SCSI Disk (TOSHIBACD-ROM)
   10  0/0/2/1              PCI SCSI Interface (10000
   11  0/0/2/1.15.0         SCSI Disk (HP36.4GST33675
   12  0/0/4/1              RS-232 Interface (103c104
   13  0/2                  PCI Bus Adapter (782)
   14  0/2/0/0              PCI Bus Adapter (8086b154
   15  0/2/0/0/4/0          PCI 4 Port 100BT LAN (101
   16  0/2/0/0/5/0          PCI 4 Port 100BT LAN (101
   17  0/2/0/0/6/0          PCI 4 Port 100BT LAN (101
   18  0/2/0/0/7/0          PCI 4 Port 100BT LAN (101
   19  0/4                  PCI Bus Adapter (782)
   20  0/4/0/0              Fibre Channel Interface (
   21  0/6                  PCI Bus Adapter (782)
   22  0/6/0/0              PCI SCSI Interface (10000
   23  0/6/0/1              PCI SCSI Interface (10000
   24  0/6/2/0              Fibre Channel Interface (
   25  8                    MEMORY (9b)
   26  160                  CPU (5e3)
cstm>
cstm>sel dev 25
cstm>info
-- Updating Map --
Updating Map...
cstm>infolog
-- Converting a (1196) byte raw log file to text. --
Preparing the Information Tool Log for MEMORY on path 8 File ...

.... hpeos003  :  192.168.0.65 ....

-- Information Tool Log for MEMORY on path 8 --

Log creation time: Tue Nov 18 03:34:50 2003

Hardware path: 8


Basic Memory Description

    Module Type: MEMORY
    Total Configured Memory   : 1024 MB
    Page Size: 4096 Bytes

    Memory interleaving is supported on this machine and is ON.

Memory Board Inventory

   DIMM Slot      Size (MB)
   ---------      ---------
          01            512
          02            512
   ---------      ---------
   System Total (MB):  1024

Memory Error Log Summary

    The memory error log is empty.

Page Deallocation Table (PDT)

    PDT Entries Used: 0
    PDT Entries Free: 50
    PDT Total Size: 50
-- Information Tool Log for MEMORY on path 8 --
View   - To View the file.
Print  - To Print the file.
SaveAs - To Save the file.
Enter Done, Help, Print, SaveAs, or View: [Done] SA
-- Save Information Tool Log for MEMORY on path 8 --
Information Tool Log for MEMORY on path 8 File
Path: /
File Name:/tmp/info.mem.18Nov03

Enter Done, Help, Print, SaveAs, or View: [Done]
cstm>
cstm>exit
-- Exit the Support Tool Manager --
Are you sure you want to exit the Support Tool Manager?
Enter Cancel, Help, or OK: [OK]
root@hpeos003[]
If we were working with our local Response Center, we could pass this information on to a qualified hardware engineer to help him diagnose any potential problems.
The problem we may be investigating may be the result of a system crash. In Chapter 9, we discussed how the system stores a crashdump to disk and the savecrash process. We now look at the process of trying to work out whether the problem was related to a hardware or software problem. With this information, we can log an appropriate call with our local Response Center, which is responsible for conducting root cause analysis.
After a system has crashed, one of the main things you want to do is establish why it crashed. In order to do this, we need to employ the services of our local HP Response Center. They have engineers trained in crashdump analysis and will endeavor to get to the root cause of why your system crashed. When we place a support call, we will be asked if we want to place a Software support call or Hardware support call. This is where we can do a little bit of investigation in order to streamline the process of getting to the root cause of the system crash.
There are essentially three types of system crashes:
High Priority Machine Check (HPMC): This is normally the result of a piece of hardware causing a Group 1 interrupt, an HPMC. A Group 1 interrupt is the highest priority interrupt the system can generate. Such an interrupt signifies THE MOST serious event has just occurred. The interrupt will be handled by a processor and passed to the operating system for it to process further. When the operating system receives an HPMC, the only thing it can do is to cause the system to crash. This will produce a system crashdump. As an example, a double-bit memory error will cause an HPMC. Many other hardware-related events will cause an HPMC. There is a small chance that an HPMC could be caused by a software error, but the vast majority of HPMCs are caused by hardware problems.
There is also a Low Priority Machine Check (LPMC). An LPMC does not necessarily cause the system to crash. An LPMC may be related to a hardware error that is recoverable, e.g., a single-bit memory error.
Transfer of Control (TOC): If a system hangs, i.e., you can't get any response from a
ping, from the system console, the system has frozen, and you may decide to initiate a TOC from the system console by using theTCcommand from the Command Menu (pressingctrl-bon the console or via the GSP). If you are using Serviceguard, thecmclddaemon may cause the system to TOC in the event of a cluster reformation. All of these situations are normally associated with some form of software problem (the Serviceguard issue may be related to a hardware problem in our networking, but it was software that initiated the TOC).PANIC: A PANIC occurs when the kernel detects a situation that makes no logical sense, e.g., kernel data structures becoming corrupted or logical corruption in a software subsystem such as a filesystem trying to delete a file twice (
freeing free frag). In such situations, the kernel decides that the safest thing to do is to cause the system to crash. A PANIC is normally associated with a software problem, although it could be an underlying hardware problem (the filesystem problem mentioned above may have been caused by a faulty disk).
In summary, an HPMC is probably a hardware problem, and a TOC or PANIC is probably some form of software problem.
If we can distinguish between these three types of crashes, we can assist the analysis process by placing the appropriate call with our local Response Center. When we speak to a Response Center engineer, he may require us to send in the crashdump files on tape, as well as something called a tombstone. A tombstone details the last actions of the processor(s) when an HPMC occurred. We see this later.
In some instances, the engineer may log in to our systems remotely and perform crashdump analysis on our systems. If you don't want the engineer to log in to your live production systems, you will need to relocate the files from the savecrash directory (/var/adm/crash) onto another system to which the engineer does have access.
Let's look at a number of crashdumps in order to distinguish which are an HPMC, a TOC, or a PANIC. To look inside a crashdump, we need a debugging tool. HP-UX comes with a kernel debugger called q4. The debugger is installed by default with HP-UX. We could spend an entire book talking about q4. You'll find some documentation on q4 in the file /usr/contrib/docs/Q4Docs.tar.Z if you want to have a look. In reality, you need to know kernel internals to be able to exploit q4 to its fullest. This is why we need to employ the help of our local Response Center to analyze the crashdump in full. I will give you some idea of how to use it by going through some examples. It is an interactive command and once you get used to it, it is quite easy to use.
An HPMC is a catastrophic event for a system. This is the highest priority interrupt that an HP system can generate. This is regarded as an unrecoverable error. The operating system must deal with this before it does anything else. For HP-UX, this means it will perform a crashdump. That means we will have files to analyze in /var/adm/crash. Our task is to realize that this crash was an HPMC, locate the tombstone (if there is one), and place a hardware call with our local HP Response Center: Here's a system that recently had an HPMC:
root@hpeos002[] # more /var/adm/shutdownlog
12:21  Thu Aug 22, 2002.  Reboot:  (by hpeos002!root)
01:01  Tue Aug 27, 2002.  Reboot:  (by hpeos002!root)
04:38  Sun Sep  1, 2002.  Reboot:
22:40  Wed Sep 25, 2002.  Reboot:  (by hpeos002!root)
09:33  Sun Sep 29, 2002.  Reboot:
10:19  Sun Sep 29, 2002.  Reboot:  (by hpeos002!root)
...
17:00  Sun Nov 16 2003.  Reboot after panic: trap type 1 (HPMC), pcsq.pcoq = 0.aa880, isr.ior = 0.7dc8
root@hpeos002[] #
root@hpeos002[] # cd /var/adm/crash
root@hpeos002[crash] # ll
total 4
-rwxr-xr-x   1 root       root             1 Nov 16 16:59 bounds
drwxr-xr-x   2 root       root          1024 Nov 16 17:00 crash.0
root@hpeos002[crash] # cd crash.0/
root@hpeos002[crash.0] # cat INDEX
comment   savecrash crash dump INDEX file
version   2
hostname  hpeos002
modelname 9000/715
panic     trap type 1 (HPMC), pcsq.pcoq = 0.aa880, isr.ior = 0.7dc8
dumptime  1069001748 Sun Nov  16 16:55:48 GMT 2003
savetime  1069001959 Sun Nov  16 16:59:19 GMT 2003
release   @(#)          $Revision: vmunix:    vw: -proj    selectors: CUPI80_BL2000_1108 -c 'Vw for CUPI80_BL2000_1108 build' -- cupi80_bl2000_1108 'CUPI80_BL2000_1108'  Wed Nov  8 19:05:38 PST 2000 $
memsize   268435456
chunksize 8388608
module    /stand/vmunix vmunix 20418928 3531348543
module    /stand/dlkm/mod.d/rng rng 55428 3411709208
image     image.1.1 0x0000000000000000 0x00000000007fe000 0x0000000000000000 0x000000000000113f 2736590966
image     image.1.2 0x0000000000000000 0x00000000007fa000 0x0000000000001140 0x0000000000001a07 3970038878
image     image.1.3 0x0000000000000000 0x00000000007fc000 0x0000000000001a08 0x00000000000030d7 3687677982
image     image.1.4 0x0000000000000000 0x0000000000800000 0x00000000000030d8 0x00000000000064ef 2646676018
image     image.1.5 0x0000000000000000 0x00000000007fe000 0x00000000000064f0 0x0000000000009c57 3361770983
image     image.1.6 0x0000000000000000 0x0000000000464000 0x0000000000009c58 0x000000000000ffff 569812247
root@hpeos002[crash.0] #
The first thing to note is that this appears to be a definite HPMC. I can confirm this by looking at the dump itself.
root@hpeos002[crash.0] # q4 .
@(#) q4 $Revision: B.11.20f $ $Fri Aug 17 18:05:11 PDT 2001 0
Reading kernel symbols ...

This kernel does not look like it has been prepared for debugging.
If this is so, you will need to run pxdb or q4pxdb on it
before you can use q4.

You can verify that this is the problem by asking pxdb:

        $ pxdb -s status ./vmunix

If pxdb says the kernel has not been preprocessed, you will need to run
it on the kernel before using q4:

        $ pxdb ./vmunix

Be aware that pxdb will overwrite your kernel with the fixed-up version,
so you might want to save a copy of the file before you do this.

(If the "-s status" command complained about an internal error,
you will need to get a different version of pxdb before proceeding.)

If you were not able to find pxdb, be advised that it moved from its
traditional location in /usr/bin to /opt/langtools/bin when the change
was made to the System V.4 file system layout.

If you do not have pxdb, it is probably because the debugging tools are
now an optional product (associated with the compilers and debuggers)
and are no longer installed on every system by default.
In this case you should use q4pxdb in exactly the same manner as you would
use pxdb.

quit
root@hpeos002[crash.0] #
This error is not uncommon, and it tells me that the kernel needs some preprocessing in order to be debugged:
root@hpeos002[crash.0] # q4pxdb vmunix
.
Procedures: 13
Files: 6
root@hpeos002[crash.0] #
root@hpeos002[crash.0] # q4 .
@(#) q4 $Revision: B.11.20f $ $Fri Aug 17 18:05:11 PDT 2001 0
Reading kernel symbols ...
Reading data types ...
Initialized PA-RISC 1.1 (no buddies) address translator ...
Initializing stack tracer ...
script /usr/contrib/Q4/lib/q4lib/sample.q4rc.pl
executable /usr/contrib/Q4/bin/perl
version 5.00502
SCRIPT_LIBRARY = /usr/contrib/Q4/lib/q4lib
perl will try to access scripts from directory
/usr/contrib/Q4/lib/q4lib

q4: (warning) PXDB:Some debug info sections were missing in the module.
q4: (warning) PXDB:Some debug info sections were missing in the module.
Processing module rng for debug info
q4: (warning) Debug info not found in the module
q4: (warning) Debug info not found in the module
q4> ex panicstr using s
trap type 1 (HPMC), pcsq.pcoq = 0.aa880, isr.ior = 0.7dc8
q4>
Here I can see the panic string that we see in the shutdownlog file. For every processor in the system, an event is stored in a structure known in the crash event table. These events are numbered from 0. We can trace each of these events individually:
q4> trace event 0
stack trace for event 0
crash event was an HPMC
vx_event_post+0x14
invoke_callouts_for_self+0x8c
sw_service+0xcc
up_ext_interrupt+0x108
ivti_patch_to_nop2+0x0
idle+0x57c
swidle_exit+0x0
q4>
This can become tedious if you have more than one running processor (runningprocs). Alternately, you can load the entire crash event table and trace every (a pile) event that occurred.
q4> load crash_event_t from &crash_event_table until crash_event_ptr max 100
loaded 1 crash_event_t as an array (stopped by "until" clause)
q4> trace pile
stack trace for event 0
crash event was an HPMC
vx_event_post+0x14
invoke_callouts_for_self+0x8c
sw_service+0xcc
up_ext_interrupt+0x108
ivti_patch_to_nop2+0x0
idle+0x57c
swidle_exit+0x0
q4>
In this case, every (okay, there's only one) processor has indicated that an HPMC was called. At this point, I would be looking to place a Hardware support call. If we can find the associated tombstone for this system, it might speed up the process of root cause analysis quite a bit. We need contributed diagnostic software loaded in order to automatically save a tombstone. The program I am looking for is called pdcinfo; it normally resides under the /usr/sbin/diag/contrib directory and is supported on most machines (it's not supported on some workstations). If we don't have the program, we can still extract the tombstone using the Online Diagnostic tools—the Support Tool Manager. I can run an info diagnostic on the processors, which will extract the PIM (Processor Information Module) information from the processor. The PIM information is the tombstone.
root@hpeos002[crash.0] # pdcinfo
HP-UX hpeos002 B.11.11 U 9000/715 2007116332
pdcinfo: The host machine is not supported by this program.
root@hpeos002[crash.0] #
If this is the error message you receive, then your only option is to place a Hardware support call with the Response Center and let them take it from there. Let's look at extracting the PIM from a different system using the STM diagnostics. First, if pdcinfo is available, it is run at boot time and creates the most recent tombstone in a file called /var/tomstones/ts99:
root@hpeos003[] cd /var/tombstones/
root@hpeos003[tombstones]
root@hpeos003[tombstones] ll | more
...
-rw-r--r--   1 root       root          3683 Nov 14 10:35 ts97
-rw-r--r--   1 root       root          3683 Nov 15 09:10 ts98
-rw-r--r--   1 root       root          3683 Nov 16 10:54 ts99
root@hpeos003[tombstones]
root@hpeos003[tombstones] more ts99
HP-UX hpeos003 B.11.11 U 9000/8000 894960601

CPU-ID( Model ) = 0x13

PROCESSOR PIM INFORMATION


-----------------  Processor 0 HPMC Information - PDC Version: 42.19  ------

Timestamp =    Fri Nov  14 23:41:28 GMT 2003    (20:03:11:14:23:41:28)

HPMC Chassis Codes = 0xcbf0  0x20b3  0x5008  0x5408  0x5508  0xcbfb


General Registers 0 - 31
 0 -  3  0x00000000  0x00004a4f  0x0004dc33  0x00000001
 4 -  7  0x40001840  0x00000001  0x7b36bf04  0x00000001
 8 - 11  0x41936338  0x40001844  0x40001844  0x41934338
12 - 15  0x00000000  0x41932168  0x00000001  0x00000020
16 - 19  0x419322ab  0x7b36bf60  0x00000001  0x00000003

...
root@hpeos003[tombstones]
The tombstone has valid data in it, which is a series of what seems like inexplicable hex codes. The hex codes relate to the state of various hardware components at the time of the crash. This needs careful analysis by a hardware engineer who can decipher it, and it tells what caused the HPMC in the first place. We should place a Hardware support call and inform the Response Center that you have a tombstone for the engineer to analyze. If we don't have a tombstone in the form of a ts99 file, we can attempt to extract the PIM information from the processors themselves.
root@hpeos003[] cstm
Running Command File (/usr/sbin/stm/ui/config/.stmrc).

-- Information --
Support Tools Manager


Version A.34.00

Product Number B4708AA

(C) Copyright Hewlett Packard Co. 1995-2002
All Rights Reserved

Use of this program is subject to the licensing restrictions described
in "Help-->On Version". HP shall not be liable for any damages resulting
from misuse or unauthorized use of this program.

cstm>
cstm>map
                             hpeos003.hq.maabof.com

  Dev                                                 Last        Last Op
  Num  Path                 Product                   Active Tool Status
  ===  ==================== ========================= =========== ===========
    1  system               system ()                 Information Successful
    2  0                    Bus Adapter (582)
    3  0/0                  PCI Bus Adapter (782)
    4  0/0/0/0              Core PCI 100BT Interface
    5  0/0/1/0              PCI SCSI Interface (10000
    6  0/0/1/1              PCI SCSI Interface (10000
    7  0/0/1/1.15.0         SCSI Disk (HP36.4GST33675 Information Successful
    8  0/0/2/0              PCI SCSI Interface (10000
    9  0/0/2/1              PCI SCSI Interface (10000
   10  0/0/2/1.15.0         SCSI Disk (HP36.4GST33675 Information Successful
   11  0/0/4/1              RS-232 Interface (103c104
   12  0/2                  PCI Bus Adapter (782)
   13  0/2/0/0              PCI Bus Adapter (8086b154
   14  0/2/0/0/4/0          Unknown (10110019)
   15  0/2/0/0/5/0          Unknown (10110019)
   16  0/2/0/0/6/0          Unknown (10110019)
   17  0/2/0/0/7/0          Unknown (10110019)
   18  0/4                  PCI Bus Adapter (782)
   19  0/4/0/0              Fibre Channel Interface (
   20  0/6                  PCI Bus Adapter (782)
   21  0/6/0/0              PCI SCSI Interface (10000
   22  0/6/0/1              PCI SCSI Interface (10000
   23  0/6/2/0              Fibre Channel Interface (
   24  8                    MEMORY (9b)               Information Successful
   25  160                  CPU (5e3)                 Information Successful
cstm>
cstm>sel dev 25
cstm>info
-- Updating Map --
Updating Map...
cstm>
cstm>infolog
-- Converting a (5324) byte raw log file to text. --
Preparing the Information Tool Log for CPU on path 160 File ...

.... hpeos003  :  192.168.0.65 ....

-- Information Tool Log for CPU on path 160 --

Log creation time: Sun Nov 16 17:31:35 2003

Hardware path: 160


Product ID:                CPU          Module Type:              0
Hardware Model:            0x5e3        Software Model:           0x4
Hardware Revision:         0            Software Revision:        0
Hardware ID:               0            Software ID:              894960601
Boot ID:                   0x1          Software Option:          0x91
Processor Number:          0            Path:                     160
Hard Physical Address:     0xfffffffffffa0000     Soft Physical Address:    0

Slot Number:               8            Software Capability:      0x100000f0
PDC Firmware Revision:     42.19        IODC Revision:            0
Instruction Cache [Kbyte]: 768          Processor Speed:          N/A
Processor State:           N/A
Monarch:                   Yes          Active:                   Yes
Data Cache        [Kbyte]: 1536
Instruction TLB   [entry]: 240          Processor Chip Revisions: 2.3
Data TLB Size     [entry]: 240          2nd Level Cache Size:[KB] N/A
Serial Number:             N/A


-----------------  Processor 0 HPMC Information - PDC Version: 42.19  ------

CPU-ID( Model ) = 0x13

PROCESSOR PIM INFORMATION

Timestamp =    Fri Nov  14 23:41:28 GMT 2003    (20:03:11:14:23:41:28)

HPMC Chassis Codes = 0xcbf0  0x20b3  0x5008  0x5408  0x5508  0xcbfb


General Registers 0 - 31
 0 -  3  0x00000000  0x00004a4f  0x0004dc33  0x00000001
 4 -  7  0x40001840  0x00000001  0x7b36bf04  0x00000001
 8 - 11  0x41936338  0x40001844  0x40001844  0x41934338
12 - 15  0x00000000  0x41932168  0x00000001  0x00000020
16 - 19  0x419322ab  0x7b36bf60  0x00000001  0x00000003
…
There are numerous pages of output that I have left out for reasons of brevity. When you have finished looking at, you should save it to a disk file to pass on to the Response Center engineer.
        Module              Revision
        ------              --------
        System Board        A24245
        PA 8700 CPU Module  2.3

-- Information Tool Log for CPU on path 160 --
View   - To View the file.
Print  - To Print the file.
SaveAs - To Save the file.
Enter Done, Help, Print, SaveAs, or View: [Done] SA
-- Save Information Tool Log for CPU on path 160 --
Information Tool Log for CPU on path 160 File
Path: /
File Name:/tmp/pim.HPMC.16Nov03

Enter Done, Help, Print, SaveAs, or View: [Done]
cstm>quit
-- Exit the Support Tool Manager --
Are you sure you want to exit the Support Tool Manager?
Enter Cancel, Help, or OK: [OK]
root@hpeos003[]
root@hpeos003[tombstones] ll /tmp/pim.HPMC.16Nov03
-rw-rw-r--   1 root       sys         4791 Nov 16 17:33 /tmp/pim.HPMC.16Nov03
root@hpeos003[tombstones]
On a V-Class system, the tools to extract a tombstone are located on the test-station. The command is pim_dumper and needs to be run by the sppuser user. The PIM is usually stored in a file /spp/data/<node>/pimlog (or /spp/data/pimlog on a V2200).
We should make both the tombstone and the crashdump files available to the Response Center engineers. In most cases, an HPMC is related to some form of hardware fault. However, there are situations were an HPMC is software related. Ensure that you keep the crashdump files until the Response Center engineers are finished with them.
This system has been experiencing a number of problems. It has a number of crashdumps in /var/adm/crash:
root@hpeos001[crash] # pwd
/var/adm/crash
root@hpeos001[crash] # ll
total 12
-rwxr-xr-x   1 root       root             1 Aug  2  2002 bounds
drwxr-xr-x   2 root       root          1024 Feb  5  2003 crash.0
drwxr-xr-x   2 root       root          1024 Feb  5  2003 crash.1
drwxr-xr-x   2 root       root          1024 Feb  5  2003 crash.2
drwxr-xr-x   2 root       root          1024 Apr  5  2003 crash.3
drwxr-xr-x   2 root       root          1024 Aug  2  2002 crash.4
root@hpeos001[crash] #
We start with the latest one, crash.4:
root@hpeos001[crash] # cd crash.4
root@hpeos001[crash.4] # ll
total 65660
-rw-r--r--   1 root       root          1184 Aug  2  2002 INDEX
-rw-r--r--   1 root       root       3649642 Aug  2  2002 image.1.1.gz
-rw-r--r--   1 root       root       5366814 Aug  2  2002 image.1.2.gz
-rw-r--r--   1 root       root       5132853 Aug  2  2002 image.1.3.gz
-rw-r--r--   1 root       root       5389805 Aug  2  2002 image.1.4.gz
-rw-r--r--   1 root       root       4722164 Aug  2  2002 image.1.5.gz
-rw-r--r--   1 root       root       1341565 Aug  2  2002 image.1.6.gz
-rw-r--r--   1 root       root       7999699 Aug  2  2002 vmunix.gz
root@hpeos001[crash.4] #
As you can see, the savecrash command has compressed these files. Let's have a look in the INDEX file to see if we can pick up any information in there:
root@hpeos001[crash.4] # cat INDEX
comment   savecrash crash dump INDEX file
version   2
hostname  hpeos001
modelname 9000/777/C110
panic     TOC, pcsq.pcoq = 0.15f4b4, isr.ior = 0.95c4b8
dumptime  1028316356 Fri Aug   2 20:25:56 BST 2002
savetime  1028316646 Fri Aug   2 20:30:46 BST 2002
release   @(#)      $Revision: vmunix:    vw: -proj    selectors: CUPI80_BL2000_1108 -c 'Vw for CUPI80_BL2000_1108 build' -- cupi80_bl2000_1108 'CUPI80_BL2000_1108'  Wed Nov  8 19:05:38 PST 2000 $
memsize   134217728
chunksize 16777216
module    /stand/vmunix vmunix 19959792 3822072703
image     image.1.1 0x0000000000000000 0x0000000000ffb000 0x0000000000000000 0x0000000000001ad7 2506990029
image     image.1.2 0x0000000000000000 0x0000000000ffb000 0x0000000000001ad8 0x0000000000003547 2619725050
image     image.1.3 0x0000000000000000 0x0000000000ffa000 0x0000000000003548 0x0000000000004c4f 3285117231
image     image.1.4 0x0000000000000000 0x0000000000ffd000 0x0000000000004c50 0x0000000000006227 1045138142
image     image.1.5 0x0000000000000000 0x0000000001000000 0x0000000000006228 0x0000000000007957 3167489837
image     image.1.6 0x0000000000000000 0x00000000004d5000 0x0000000000007958 0x0000000000007fff 2277772794
root@hpeos001[crash.4] #
All I can tell from the panic string is that this was a TOC. Sometimes, there is a more descriptive panic string, which I could feed into the ITRC knowledge database and see if the panic string had been seen before. For most people, the fact that this was a TOC is enough information. You should now place a Software call with your local Response Center and get an engineer to take a detailed look at the crashdump.
If the file /var/adm/shutdownlog exists, we should see the panic string in that file as well.
root@hpeos001[crash] # more /var/adm/shutdownlog
19:52  Wed Feb 27, 2002.  Reboot:
08:50  Mon Mar  4, 2002.  Halt:
13:03  Mon Jun 10, 2002.  Halt:
...
20:56  Sat Apr 05 2003.  Reboot after panic: TOC, pcsq.pcoq = 0.15f4b4, isr.ior = 0.95c4b8
root@hpeos001[crash] #
In this instance, I will look a little further to see what else I can find out. In order to look at the crashdump itself, I will gunzip at least the kernel file:
root@hpeos001[crash.4] # gunzip vmunix.gz
root@hpeos001[crash.4] #
Before I run q4, I will preprocess the kernel with the q4pxdb command:
root@hpeos001[crash.4] # q4pxdb vmunix
.
Procedures: 13
Files: 6
root@hpeos001[crash.4] #
Now I can run q4:
root@hpeos001[crash.4] # q4 .
@(#) q4 $Revision: B.11.20f $ $Fri Aug 17 18:05:11 PDT 2001 0
Reading kernel symbols ...
Reading data types ...
Initialized PA-RISC 1.1 (no buddies) address translator ...
Initializing stack tracer ...
script /usr/contrib/Q4/lib/q4lib/sample.q4rc.pl
executable /usr/contrib/Q4/bin/perl
version 5.00502
SCRIPT_LIBRARY = /usr/contrib/Q4/lib/q4lib
perl will try to access scripts from directory
/usr/contrib/Q4/lib/q4lib

q4: (warning) No loadable modules were found
q4: (warning) No loadable modules were found
System memory: 128 MB
Total Dump space configured: 256.00 MB
Total Dump space actually used: 84.74 MB
Dump space appears to be sufficient : 171.26 MB extra
q4>
q4> examine panicstr using s
TOC, pcsq.pcoq = 0.15f4b4, isr.ior = 0.95c4b8
q4>
This is the panic string that we see in the INDEX file. I want to find out what each processor was doing at the time of the crash. First, I want to know how processors were configured on this system:
q4> runningprocs
01      1       0x1
q4>
I can look at a structure known as the multi-process information table. This structure (one per processor) will list the instructions that each processor was executing at the time of the crash.
q4> load mpinfo_t from mpproc_info max nmpinfo
loaded 1 mpinfo_t as an array (stopped by max count)
q4> trace pile
processor 0 claims to be idle
stack trace for event 0
crash event was a TOC
Send_Monarch_TOC+0x2c
safety_time_check+0x110
per_spu_hardclock+0x308
clock_int+0x7c
inttr_emulate_save_fpu+0x100
idle+0x56c
swidle_exit+0x0
q4>
In this particular instance, a safety_time_check instruction tells me that Serviceguard was running on this machine (the safety timer is an integral part of a Serviceguard node's regular checking of the status of the cluster). If Serviceguard TOCs a server, there are normally messages in the kernel message buffer (the buffer read by the dmesg command). The message buffer has a 8-byte header, which I am not interested in, so I can skip the header and read the data in the buffer itself:
q4> ex &msgbuf+8 using s
NOTICE: nfs3_link(): File system was registered at index 3.
NOTICE: autofs_link(): File system was registered at index 6.
NOTICE: cachefs_link(): File system was registered at index 7.
8 ccio
8/12 c720
8/12.5 tgt
8/12.5.0 sdisk
8/12.6 tgt
8/12.6.0 sdisk
8/12.7 tgt
8/12.7.0 sctl
8/16 bus_adapter
8/16/4 asio0
8/16/5 c720
8/16/5.0 tgt
8/16/5.0.0 sdisk
8/16/5.2 tgt
8/16/5.2.0 sdisk
8/16/5.3 tgt
8/16/5.3.0 stape
8/16/5.7 tgt
8/16/5.7.0 sctl
8/16/6 lan2
8/16/0 CentIf
8/16/10 fdc
8/16/1 audio
ps2_readbyte_timeout: no byte after 500 uSec
ps2_readbyte_timeout: no byte after 500 uSec
8/16/7 ps2
8/20 bus_adapter
8/20/5 eisa
8/20/5/2 lan2
8/20/2 asio0
8/20/1 hil
10 ccio
10/12 c720
10/12.6 tgt
10/12.6.0 sctl
10/16 graph3
32 processor
49 memory

    System Console is on the Built-In Serial Interface
Entering cifs_init...
Initialization finished successfully... slot is 9
Logical volume 64, 0x3 configured as ROOT
Logical volume 64, 0x2 configured as SWAP
Logical volume 64, 0x2 configured as DUMP
    Swap device table:  (start & size given in 512-byte blocks)
        entry 0 - major is 64, minor is 0x2; start = 0, size = 524288
    Dump device table:  (start & size given in 1-Kbyte blocks)
        entry 00000000 - major is 31, minor is 0x6000; start = 88928, size = 262144
Warning: file system time later than time-of-day register

Getting time from file system
Starting the STREAMS daemons-phase 1
Create STCP device files
          $Revision: vmunix:    vw: -proj    selectors: CUPI80_BL2000_1108 -c 'Vw for CUPI80_BL2000_1108 build' -- cupi80_bl2000_1108 'CUPI80_BL2000_1108'  Wed Nov  8 19:05:38 PST 2000 $
Memory Information:
    physical page size = 4096 bytes, logical page size = 4096 bytes
    Physical: 131072 Kbytes, lockable: 82636 Kbytes, available: 96004 Kbytes

SCSI: Reset requested from above -- lbolt: 547387, bus: 1
SCSI: Resetting SCSI -- lbolt: 547687, bus: 1
SCSI: Reset detected -- lbolt: 547687, bus: 1
SCSI: Reset requested from above -- lbolt: 670315, bus: 1
SCSI: Resetting SCSI -- lbolt: 670615, bus: 1
SCSI: Reset detected -- lbolt: 670615, bus: 1
MC/ServiceGuard: Unable to maintain contact with cmcld daemon.
Performing TOC to ensure data integrity.

q4>
This is definitely a Serviceguard issue. The SCSI lbolt messages are normal during a Serviceguard cluster reformation. Analyzing the dump may reveal more, but my immediate task is to log a software call with my local Response Center to take this analysis further. In the meantime, I would be investigating my Serviceguard logfiles for any more clues as to why this Serviceguard node went through a cluster reformation and ended up TOC'ing.
q4> exit
root@hpeos001[crash.4] #
In this instance, we don't have an HPMC or a TOC to deal with. This one is a PANIC. This type of problem is normally associated with a problem with a kernel device driver or software subsystem, but it is not inconceivable that it could be associated with an underlying hardware problem. We are back on the system hpeos001 we saw earlier:
root@hpeos001[] # cd /var/adm/crash
root@hpeos001[crash] # grep panic crash*/INDEX
crash.0/INDEX:panic     TOC, pcsq.pcoq = 0.afb04, isr.ior = 0.0
crash.1/INDEX:panic     TOC, pcsq.pcoq = 0.15f4b4, isr.ior = 0.9561f8
crash.2/INDEX:panic     free: freeing free frag
crash.3/INDEX:panic     TOC, pcsq.pcoq = 0.15f4b4, isr.ior = 0.95c4b8
crash.4/INDEX:panic     TOC, pcsq.pcoq = 0.15f4b4, isr.ior = 0.95c4b8
root@hpeos001[crash] #
I am interested in crash.2 because there is no mention of an HPMC or a TOC, an early indication that this is a PANIC:
root@hpeos001[crash] # cd crash.2
root@hpeos001[crash.2] # ll
total 213178
-rw-r--r--   1 root       root          1218 Feb  5  2003 INDEX
-rw-r--r--   1 root       root       16744448 Feb  5  2003 image.1.1
-rw-r--r--   1 root       root       16777216 Feb  5  2003 image.1.2
-rw-r--r--   1 root       root       16764928 Feb  5  2003 image.1.3
-rw-r--r--   1 root       root       16777216 Feb  5  2003 image.1.4
-rw-r--r--   1 root       root       16773120 Feb  5  2003 image.1.5
-rw-r--r--   1 root       root       10465280 Feb  5  2003 image.1.6
-rw-r--r--   1 root       root       14842104 Feb  5  2003 vmunix
root@hpeos001[crash.2] #
root@hpeos001[crash.2] # cat INDEX
comment   savecrash crash dump INDEX file
version   2
hostname  hpeos001
modelname 9000/777/C110
panic     free: freeing free frag
dumptime  1044424474 Wed Feb   5 05:54:34 GMT 2003
savetime  1044424740 Wed Feb   5 05:59:00 GMT 2003
release   @(#)     $Revision: vmunix:    vw: -proj    selectors: CUPI80_BL2000_1108 -c 'Vw for CUPI80_BL2000_1108 build' -- cupi80_bl2000_1108 'CUPI80_BL2000_1108'  Wed Nov  8 19:05:38 PST 2000 $
memsize   134217728
chunksize 16777216
module    /stand/vmunix vmunix 19931120 1462037576
warning   savecrash: savecrash running in the background

image     image.1.1 0x0000000000000000 0x0000000000ff8000 0x0000000000000000 0x00000000000019f7 3186480777
image     image.1.2 0x0000000000000000 0x0000000001000000 0x00000000000019f8 0x0000000000003017 3525696154
image     image.1.3 0x0000000000000000 0x0000000000ffd000 0x0000000000003018 0x0000000000004a57 3554239297
image     image.1.4 0x0000000000000000 0x0000000001000000 0x0000000000004a58 0x0000000000005eff 811243188
image     image.1.5 0x0000000000000000 0x0000000000fff000 0x0000000000005f00 0x000000000000724f 2125486394
image     image.1.6 0x0000000000000000 0x00000000009fb000 0x0000000000007250 0x0000000000007fff 4051446221
root@hpeos001[crash.2] #
Let's run q4 and see what happens:
root@hpeos001[crash.2] # q4 .
@(#) q4 $Revision: B.11.20f $ $Fri Aug 17 18:05:11 PDT 2001 0
q4: (warning) Here are the savecore warning messages -
q4: (warning) savecrash: savecrash running in the background
Reading kernel symbols ...
Reading data types ...
Initialized PA-RISC 1.1 (no buddies) address translator ...
Initializing stack tracer ...
script /usr/contrib/Q4/lib/q4lib/sample.q4rc.pl
executable /usr/contrib/Q4/bin/perl
version 5.00502
SCRIPT_LIBRARY = /usr/contrib/Q4/lib/q4lib
perl will try to access scripts from directory
/usr/contrib/Q4/lib/q4lib

q4: (warning) No loadable modules were found
q4: (warning) No loadable modules were found
System memory: 128 MB
Total Dump space configured: 356.00 MB
Total Dump space actually used: 89.91 MB
Dump space appears to be sufficient : 266.09 MB extra
q4>
q4> ex &msgbuf+8 using s
NOTICE: nfs3_link(): File system was registered at index 3.
NOTICE: autofs_link(): File system was registered at index 6.
NOTICE: cachefs_link(): File system was registered at index 7.
8 ccio
8/12 c720
8/12.5 tgt
8/12.5.0 sdisk
8/12.6 tgt
8/12.6.0 sdisk
8/12.7 tgt
8/12.7.0 sctl
8/16 bus_adapter
8/16/4 asio0
8/16/5 c720
8/16/5.0 tgt
8/16/5.0.0 sdisk
8/16/5.2 tgt
8/16/5.2.0 sdisk
8/16/5.3 tgt
8/16/5.3.0 stape
8/16/5.7 tgt
8/16/5.7.0 sctl
8/16/6 lan2
8/16/0 CentIf
8/16/10 fdc
8/16/1 audio
8/16/7 ps2
8/20 bus_adapter
8/20/5 eisa
8/20/5/2 lan2
8/20/2 asio0
8/20/1 hil
10 ccio
10/12 c720
10/12.6 tgt
10/12.6.0 sctl
10/16 graph3
32 processor
49 memory

    System Console is on the Built-In Serial Interface
Entering cifs_init...
Initialization finished successfully... slot is 9
Logical volume 64, 0x3 configured as ROOT
Logical volume 64, 0x2 configured as SWAP
Logical volume 64, 0x2 configured as DUMP
    Swap device table:  (start & size given in 512-byte blocks)
        entry 0 - major is 64, minor is 0x2; start = 0, size = 524288
    Dump device table:  (start & size given in 1-Kbyte blocks)
        entry 00000000 - major is 31, minor is 0x6000; start = 88928, size = 262144
Starting the STREAMS daemons-phase 1
Create STCP device files
         $Revision: vmunix:    vw: -proj    selectors: CUPI80_BL2000_1108 -c 'Vw for CUPI80_BL2000_1108 build' -- cupi80_bl2000_1108 'CUPI80_BL2000_1108'  Wed Nov  8 19:05:38 PST 2000 $
Memory Information:
    physical page size = 4096 bytes, logical page size = 4096 bytes
    Physical: 131072 Kbytes, lockable: 82676 Kbytes, available: 94672 Kbytes

dev = 0x4000000d, block = 144, fs = /data, cgp = 0xbac50000, ip = 0x7fff0ca0

linkstamp:          Thu Jan 9 13:40:49 GMT 2003
_release_version:   @(#)     $Revision: vmunix:    vw: -proj    selectors: CUPI80_BL2000_1108 -c 'Vw for CUPI80_BL2000_1108 build' -- cupi80_bl2000_1108 'CUPI80_BL2000_1108'  Wed Nov  8 19:05:38 PST 2000 $
panic: free: freeing free frag

PC-Offset Stack Trace (read across, top of stack is 1st):
  0x0015e58c  0x0036a708  0x0035f310  0x0035df00  0x0005d09c  0x0005d1e8
  0x00066d34  0x001360d0  0x00069d60  0x000e0814  0x00034578
End Of Stack

sync'ing disks (0 buffers to flush): (0 buffers to flush):
0 buffers not flushed
0 buffers still dirty

q4>
First, in this specific instance, we can see output relating to the affected filesystem. Don't necessarily expect this type of information for every PANIC. The PC-Offset Stack Trace is the list of instructions leading up to the crash. These may give us some clues. We can use a structure known as the crash event table to analyze what was happening at the time of the crash. This is an alternative structure to the multi-processor information table:
q4> load crash_event_t from &crash_event_table until crash_event_ptr max 100
loaded 1 crash_event_t as an array (stopped by "until" clause)
q4> trace pile
stack trace for event 0
crash event was a panic
panic+0x60
free+0x7b8
itrunc+0xd84
post_inactive_one+0x7c
post_inactive+0xdc
flush_all_inactive+0x10
ufs_sync+0x44
update+0x4c
tsync+0x124
syscall+0x1bc
$syscallrtn+0x0
q4>
There was something happening to a UFS (HFS) filesystem. I would immediately be logging a Software call with my local HP Response Center. While it looks like something strange was happening with the UFS code, it is not inconceivable that a disk problem introduced some form of unique corruption in the filesystem. It would be up to an engineer to diagnose this and possibly run a diagnostic check on the disk in question.
While we were waiting for contact from the Response Center, we could take the entire stack trace along with our panic string and feed them into the ITRC knowledge database to see if this problem has been seen before. It may suggest possible reasons for the problem and possible solutions. We can pass any information we get from the ITRC to the Response Center engineer to help him get to root cause of the problem.
If we are asked to store a crashdump to tape, we should store all the files under the /var/adm/crash/crash.X directory. To avoid any issues with pathnames, it's a good idea to change into the /var/adm/crash directory and use relative pathnames when storing your crashdump files to tape; absolute pathnames would just overwrite the crashdump files for the server in the Response Center! It just makes the whole process come to a conclusion much quicker! It's best to use a common backup command such as tar. Make sure that you put a label on the tape with your Response Center case number and the command you used to create the tape. Some people put their company name on the label. HP realizes that there are potential confidentiality issues with that, so your name is optional but make sure the Support Call Case Number is on the label. If, for whatever reason, the files in the /var/adm/crash/crash.X directory are accidentally deleted or corrupted, we can always attempt to resave a crashdump. If the swapping system has overwritten the dump, then it is lost forever. We can but try by using the –r option to the savecrash utility:
root@hpeos002[crash] # pwd
/var/adm/crash
root@hpeos002[crash] # ll
total 4
-rwxr-xr-x   1 root       root             1 Nov 16 16:59 bounds
drwxr-xr-x   2 root       root          1024 Nov 16 17:58 crash.0
root@hpeos002[crash] # savecrash -r /var/adm/crash
root@hpeos002[crash] # ll
total 6
-rwxr-xr-x   1 root       root             1 Nov 16 19:14 bounds
drwxr-xr-x   2 root       root          1024 Nov 16 17:58 crash.0
drwxrwxrwx   2 root       sys           1024 Nov 16 19:14 crash.1
root@hpeos002[crash] #
As you can see, we specify the directory where the crashdump will be stored. Alternately, we could have used the –t <tape device> to store that crashdump direct to tape.
The various diagnostic monitoring tools we have looked at so far have allowed us to get our hands on critical information regarding the state of our system. Being able to get to this information quickly and passing it on to a qualified HP engineer can assist in diagnosing potential problems, especially if the problem involves some form of system crash. In doing so, we can help to maintain system availability by planning any system outages, as necessary, before they happen unexpectedly.